Ontario’s 2016 Budget reaffirmed the government’s commitment to eliminate the budget deficit by 2017-18, and to maintain a balanced budget going forward. The Province’s plan continues to rely on relatively optimistic assumptions for revenue growth combined with aggressive plans to limit the growth in program spending. Maintaining balanced budgets beyond 2017-18 will likely prove challenging as new spending pressures emerge and revenue growth remains moderate.
The government assumes that revenues will increase strongly in the next three fiscal years, mainly buoyed by relatively optimistic economic assumptions, additional federal transfers and new Cap-and-Trade proceeds. As well, in 2015-16, revenues were boosted by the first sale of Hydro One equity.
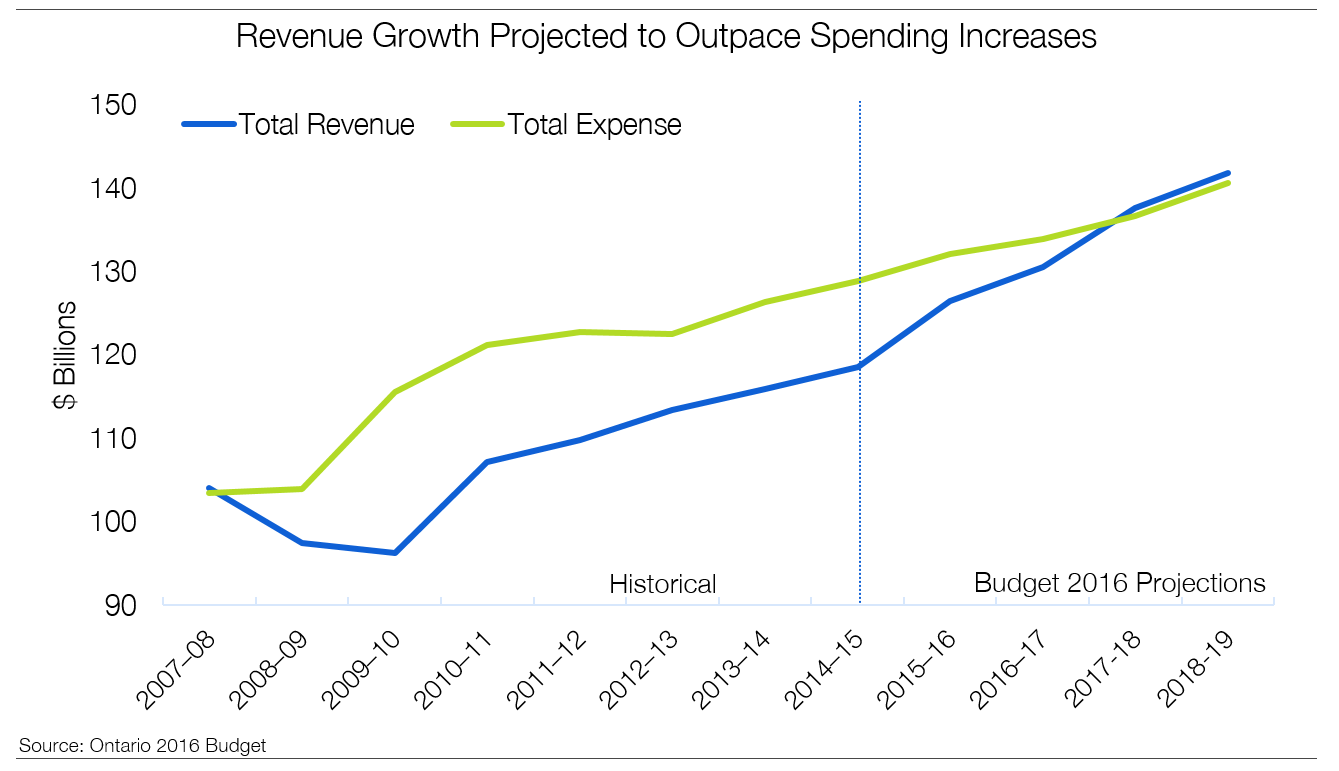
The government projects total revenue to rise by 5.1% per year on average from 2014-15 to 2017-18. This is much higher than the 2.6% average annual growth recorded over the past four years, as noted in the FAO’s fall report.[1]
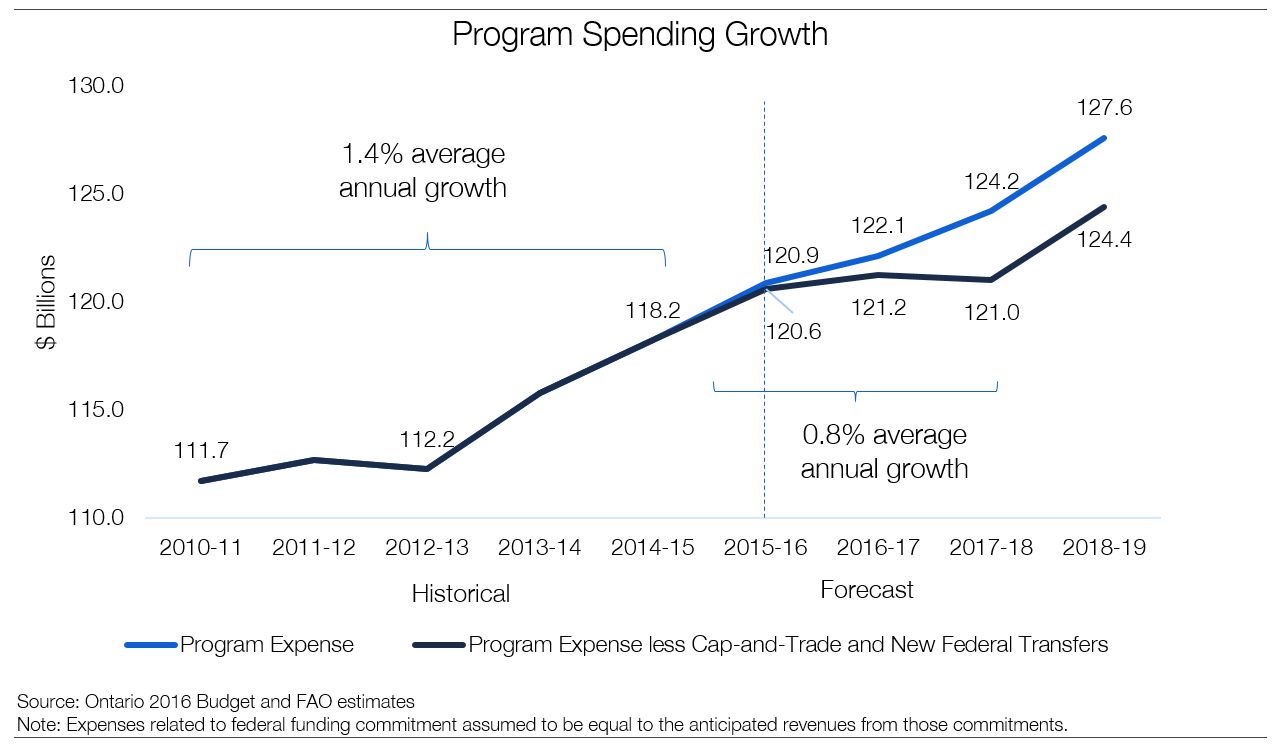
Program spending is projected to increase by 1.7% per year on average from 2014-15 to 2017-18. If the Cap-and-Trade proceeds and new federal transfers are spent on new initiatives, the growth in all other program spending would be just 0.8% per year, well below the 1.4% average annual growth in program spending recorded since 2010.
Ontario’s Economic Outlook
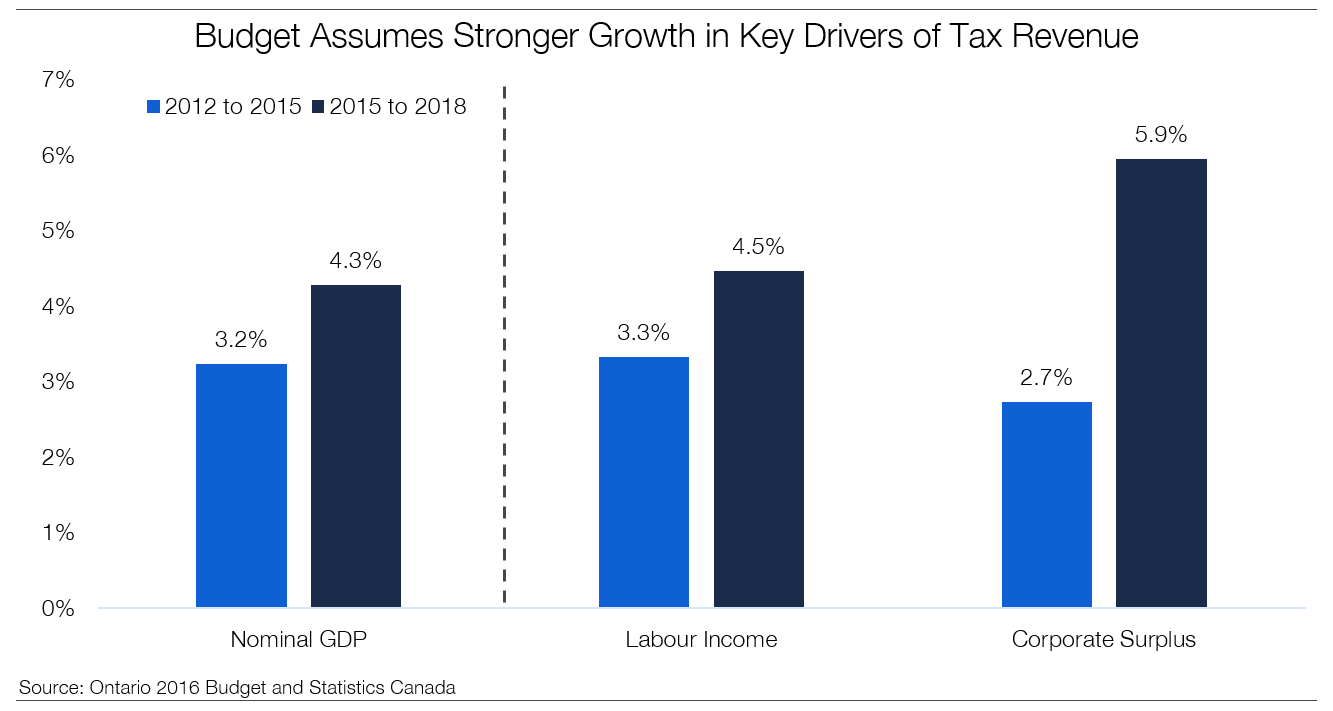
The revenue projections in the 2016 Budget are based on 4.3% average growth in nominal GDP (the broadest single measure of the tax base) over the outlook, with strong gains in both labour income and corporate surpluses. This pace of nominal GDP growth is significantly above the 3.2% average rate of growth of the past three years.
The Province’s economic forecast for Ontario relies on relatively robust U.S growth, a competitively valued Canadian dollar, low interest rates and sharply lower oil prices. While the budget assumption of 2.2% real GDP growth over the outlook is prudently below the average private sector forecast, the budget assumes nominal GDP growth slightly above that of private sector economists, reflecting an outlook for higher economy-wide price gains.
The budget forecast also relies on a significant shift in the key drivers of real economic growth for Ontario, with strong gains in exports and business investment expected to offset more moderate growth in household spending. While this shift is possible, given the lower Canadian dollar and the strengthening U.S. economy, it has yet to occur. In 2015, Ontario’s real exports posted growth of just 0.7%.
The budget’s relatively optimistic forecast for economic growth increases the possibility that the economy will underperform expectations. In particular, the budget document highlights a number of economic risks that could lead to weaker growth in Ontario. These risks include volatility and uncertainty in the global economy, the challenging competitive environment faced by Ontario exporters as well as the potential for a domestic housing market correction made worse by elevated levels of household debt.
Revenue Assumptions
The budget’s relatively optimistic forecast for nominal GDP growth forms the foundation for the revenue outlook. The budget also incorporates a number of significant additional revenue assumptions, including new revenue from the Cap-and-Trade program, additional transfers from the federal government, as well as proceeds from the government’s planned asset sales.
The Province expects to receive revenues of $1.9 billion by 2017-18 from the sale of permits under the new Cap-and-Trade program, which are legislatively required to be used to fund Greenhouse Gas reduction initiatives.
The budget also assumes new federal transfers of $0.7 billion in 2016-17 and $1.3 billion in 2017-18. This assumption appears prudent given the federal government’s additional funding commitment of $4 to $5 billion per year from 2016-17 to 2018-19 and Ontario’s population-based share of federal transfers. The details of the federal government commitment will be clarified with the release of the federal budget on March 22.
Finally, the 2016 Budget recorded $2.7 billion in revenues in 2015-16 from the partial sale of Hydro One, reporting the financial impact across a number of revenue categories. However, the government has not provided complete details on the impact of the sale on the fiscal plan.
The fiscal plan assumes additional proceeds from asset sales of $0.7 billion in 2016-17 and $0.8 billion in 2017-18. However, the budget did not indicate which assets will be sold. In addition, the timing and proceeds from future asset sales may be different than assumed in the fiscal plan depending on market conditions.
Spending Assumptions
The 2016 Budget assumes average annual program spending growth of 1.7% from 2014-15 to 2017-18, rising to 2.7% for 2018-19. This pace of program spending growth is higher than assumed in the 2015 Budget and reflects new spending associated with the Cap-and-Trade program as well as new federal funding.
Assuming that both Cap-and-Trade proceeds and the expected new federal transfers will largely be tied to new spending initiatives[2], both sources of revenue may prove to be fiscally neutral – with offsetting increases to both revenues and spending. Excluding the spending associated with these two new revenues sources, the growth of all other program spending falls to an average of 0.8% per year from 2014-15 to 2017-18, below the 1.4% average annual growth recorded over the past four years. As noted in the FAO’s October 2015 economic and fiscal assessment report, the government’s plan to further reduce the growth in core program spending will face upward pressure from population growth and price inflation.

Although the budget document outlined some of the government’s planned measures to reduce program spending growth, the details remain vague and the results uncertain. Ontario is currently in its fifth year of public sector spending restraint and pressures for new spending continue to build. For instance, while the government has indicated that it has been successful in restraining wage compensation, according to Statistics Canada data, growth in provincial public sector employment and wages were both higher in 2015, relative to 2014. As the economy strengthens and inflation rises, wage and other cost drivers will place increasing pressure on the government’s aggressive plan to restrain program spending.
Provincial Debt
According to the budget, net debt is projected to increase to $296.1 billion in 2015-16, up from $284.6 billion in 2014-15. As a result, the Province’s net debt-to-GDP is forecast to peak at 39.6% in 2015-16 before edging down to 38.9% of GDP in 2017-18. In the budget, the Province reiterated its commitment to reduce net debt-to-GDP to 27%, but did not provide a timeline.
Although the pace of growth in the province’s net debt has slowed, total borrowing requirements remain elevated at over $20 billion per year.
David West* dwest@fao-on.org
Chief Economist
Financial Accountability Office of Ontario
* With contributions from Luan Ngo, Edward Crummey and Nicolas Rhodes.
Media queries, contact: Kismet Baun, 416.254.9232 or email kbaun@fao-on.org.
[1] An Assessment of Ontario’s Medium-Term Economic and Fiscal Outlook
[2] It is unclear to what extent these new revenues will be directly tied to new program spending or can be used to fund existing spending commitments.
Revenue Growth Projected to Outpace Spending Increases
This chart shows two lines, one represents total revenue and the other is total expenditure, both in billions of dollars for the period of 2007-08 to 2018-19. The chart shows that, after dipping significantly following the recession, the government expects stronger growth in revenues than expenditures over the forecast. By 2017-18, the government expects total revenue to be larger than total expense.
Budget Assumes Stronger Growth in Key Drivers of Tax Revenue
This chart contains three bar graphs which compare historical and government forecasts of three key tax drivers; Nominal GDP, Labour Income and Corporate Surplus. The historical period is from 2012 to 2015 and the forecasted period is 2015 to 2018. It shows forecasted nominal GDP growth of 4.3 per cent, exceeding historical growth by 1.1 percentage points. Forecasted labour income is expected to grow at 4.5 per cent, exceeding historical by 1.2 percentage points. Forecasted corporate surplus is expected to grow at 5.9 per cent, exceeding historical by 3.2 percentage points.
Program Spending Growth
This chart shows two lines, one represents program expense and the other is program expense less Cap-and-Trade transfers, both in billions of dollars for the period of 2010-11 to 2018-19. The chart shows that unadjusted program expense is expected to grow at a fairly consistent rate for the entire forecast, reaching $127.6 billion by 2018-19. Removing Cap-and-Trade and new Federal transfers result in plateaued program expenditures between 2015-16 and 2017-18 (of around $120-121 billion) before rising in 2018-19 to a value of $124.4 billion. The graph also notes that the average annual program expense growth rate was 1.4 per cent from 2010-11 to 2014-15. However, over the forecast, after removing the effect of Cap-and-Trade and new Federal transfers, the average annual growth rate is forecasted to be 0.8 per cent from 2014-15 to 2017-18.


