


Highlights
- This report examines how home energy spending differs across household income levels and regions in Ontario. The report also discusses how the benefits from provincial programs that subsidize the cost of electricity are distributed to Ontario households by income level and region.
- Home energy spending represents what Ontarians pay to heat and cool their homes and power their appliances. In 2019, the average Ontario household spent $2,128 on home energy.
- Average home energy spending varies significantly by income level. In 2019, households in the highest income quintile (those earning more than $151,063) spent an average of $3,070 on home energy, while households in the lowest income quintile (those earning less than $36,070) spent an average of $1,050.
- Although lower income households spend less overall on home energy compared to higher income households, they spend a higher percentage of their income on home energy. In 2019, households in the lowest income quintile spent on average 4.6 per cent of their before-tax income on home energy, while households in the highest income quintile spent 1.2 per cent.
- Home energy spending across household income groups is significantly affected by provincial programs that subsidize the cost of electricity.[1] Households in the highest income quintile received the highest average electricity subsidy at $706 per household, while households in the second lowest income quintile (those earning between $36,071 and $68,884) received the lowest average subsidy at $537 per household.
- In general, as a household’s average income decreased, the average electricity subsidy provided by the Province decreased, largely due to the design of the Ontario Electricity Rebate (OER), which provides benefits to all households that scale with the amount of their electricity bill.
- However, households in the lowest income quintile received higher average subsidies ($571 per household) than households in the second lowest income quintile ($537 per household) due to the Ontario Electricity Support Program, which provides a monthly on-bill credit to low-income households.
- Comparing provincial electricity subsidies as a share of pre-subsidy household electricity costs, the FAO estimates that the Province subsidized 34 per cent of total home electricity costs in 2019. Households in the lowest income quintile had the largest proportion of their electricity costs subsidized, at 48 per cent, while the highest income households had the lowest share of their electricity costs subsidized, at 29 per cent.
- In general, as a household’s average income decreased, the average electricity subsidy provided by the Province decreased, largely due to the design of the Ontario Electricity Rebate (OER), which provides benefits to all households that scale with the amount of their electricity bill.
- Home energy spending in Ontario varies by region, reflecting differences in household income, the sources of energy used for home heating and the cost of distributing energy to the region. In 2019, households in the Eastern ($2,338), Northern ($2,245), and Western ($2,192) regions of Ontario had the highest home energy spending, while households in the Greater Toronto Area ($2,010) and Hamilton-Niagara ($2,118) regions spent the least on home energy.[2]
- Households in rural areas of Ontario had higher home energy costs due to less access to natural gas, which is the most cost-effective energy source for home heating, and the high cost of distributing electricity and fuels to rural areas. The FAO estimates that households in rural areas of Ontario (with populations of 1,000 or lower) spent an average of $3,198 on home energy in 2019, compared with an average of $2,002 spent by households in large urban centres (with populations of 250,000 or more).
- The differences in home energy spending across regions is significantly mitigated by provincial electricity subsidies, especially subsidies targeted to households living in rural areas. The FAO estimates that households in the Northern region, which has the lowest population density, received the highest average provincial electricity subsidies in 2019, at $995 per household, while households in the more densely populated Hamilton-Niagara and Greater Toronto Area (GTA) regions received the lowest average benefits at $546 and $467 per household, respectively.
- Without provincial electricity subsidies, the differences in home energy spending across regions in Ontario would be significantly higher. For example, after accounting for provincial electricity subsidies, households in the Northern region on average spent 12 per cent more on home energy than households in the GTA region in 2019. Without provincial electricity subsidies, households in the Northern region would have spent 31 per cent more on home energy than households in the GTA.
Introduction
Home energy spending represents what Ontarians pay to heat and cool their homes and power their appliances. The amount Ontario households spend on home energy depends on the cost of electricity and fuels, and how much energy they consume. In March 2020, the FAO released Home Energy Spending in Ontario: 2019 Update which reviewed home energy spending in 2019 and how that spending has changed since 2010. The report also analyzed the effect of provincial programs that subsidize the cost of electricity on home energy spending.
The purpose of this report is to examine how home energy spending differs across household income levels and regions in Ontario. The report also discusses how the benefits from provincial programs that subsidize the cost of electricity are distributed to Ontario households by income level and region.
Home Energy Spending by Income Level
In 2019, the average Ontario household spent $2,128 on home energy. However, average home energy spending varied significantly by household income quintile. As shown in Figure 1, on average, households with higher incomes spent more on home energy.
Households in the highest income quintile in 2019 (the highest earning 20 per cent of Ontario households, with $151,063 or more in before-tax income), spent an average of $3,070 on home energy, while households in the lowest income quintile (with incomes of $36,070 or less) spent an average of $1,050 on home energy. In general, home energy spending tends to increase with income primarily because higher income households have larger homes.[3]
Figure 1Ontario household average home energy spending by income level and as a share of income, 2019
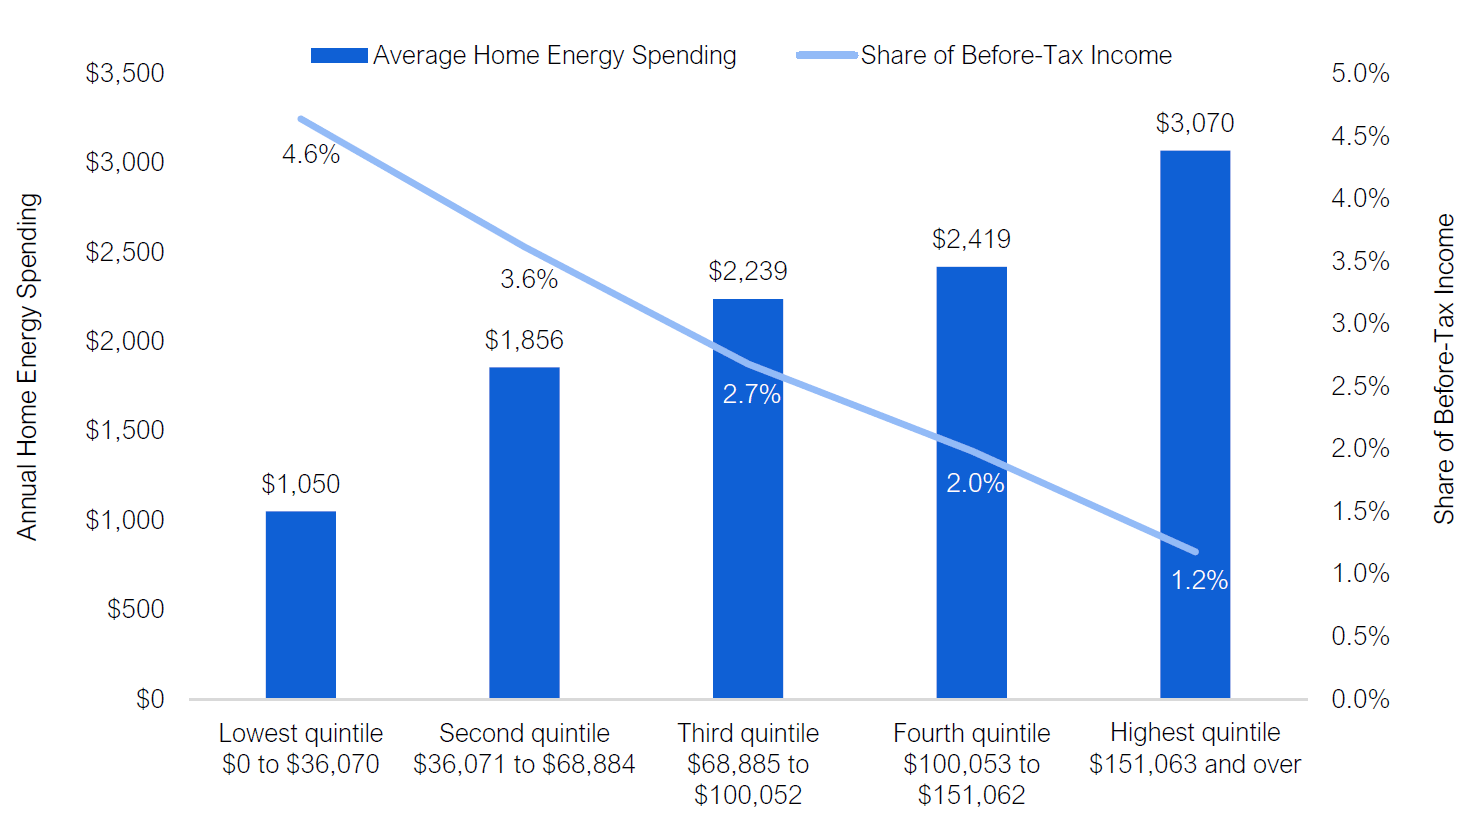
Source: Adapted by FAO from Statistics Canada, Table 11-10-0223-01 Household spending by household income quintile, Canada, regions and provinces.
Although lower income households spend less overall on home energy compared to higher income households, lower income households spend a higher percentage of their household income on home energy. In 2019, households in the lowest income quintile spent on average 4.6 per cent of their before-tax income on home energy, while households in the highest income quintile spent 1.2 per cent.
Looking at home energy spending by source, of the $2,128 average household spending on home energy, 56 per cent ($1,190) was for electricity, 38 per cent ($811) was for natural gas, and six per cent ($127) was for other fuels. The share of home energy spending by source was largely consistent with the provincial average across the second through highest income quintiles. In contrast, the lowest income quintile had relatively higher spending on electricity (59 per cent) and other fuels (10 per cent) and lower spending on natural gas (32 per cent). This is because lower income homes in Ontario are nearly twice as likely to use electricity or heating oil as their primary heating source.[4]
Figure 2Ontario household average home energy spending by income level and energy source, 2019
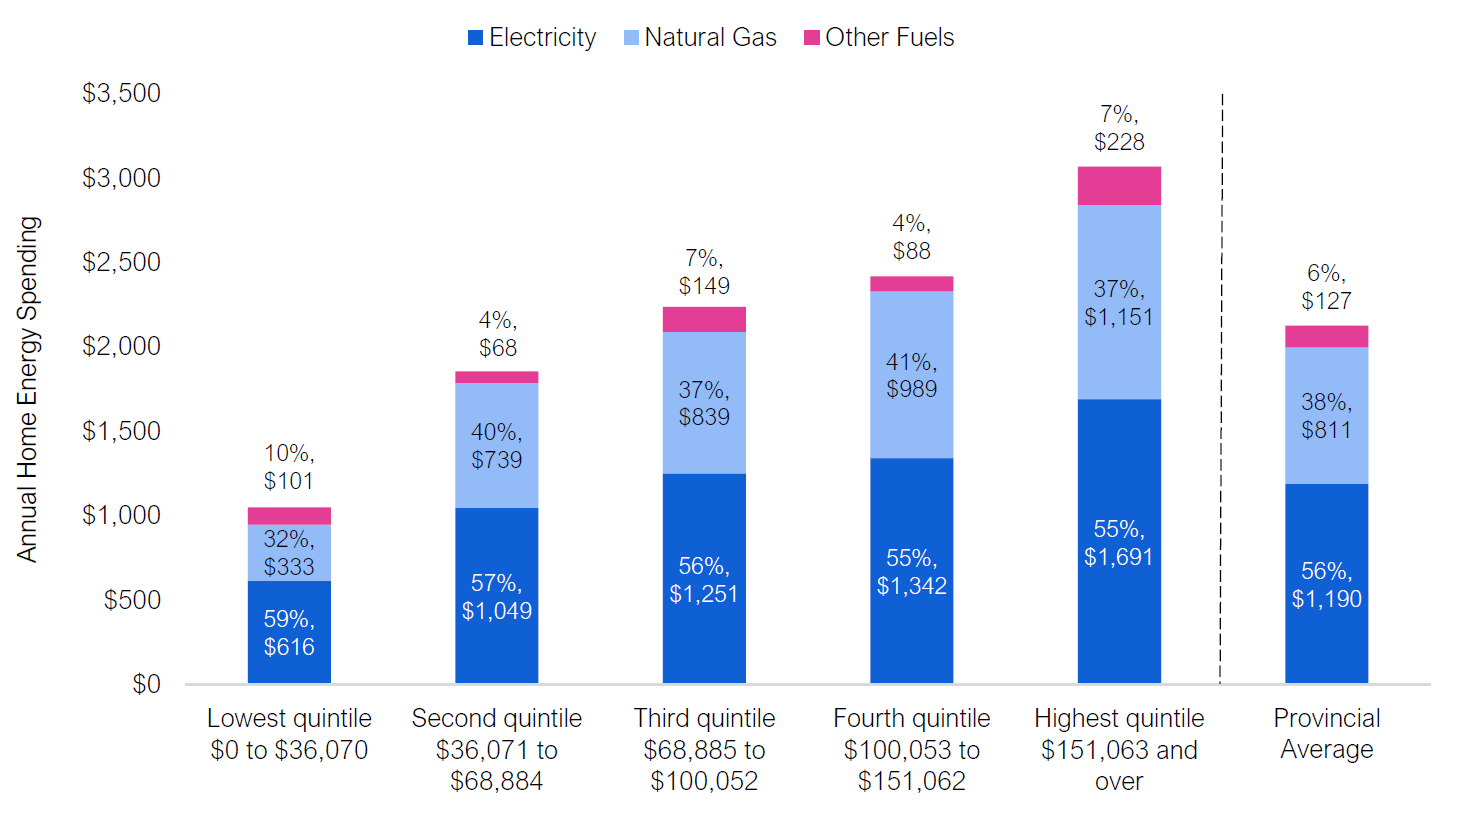
Source: Statistics Canada, Table 11-10-0223-01 Household spending by household income quintile, Canada, regions and provinces.
Effect of Provincial Home Electricity Subsidy Programs by Income
The distribution of home energy spending across income groups is significantly affected by provincial programs that subsidize the cost of electricity. In 2019, the Province spent $3.5 billion[5] through five programs to reduce electricity bills for Ontario households.[6]
| Program | Program Description | Benefit to Eligible Ratepayers in 2019 | Cost to the Province in 2019 ($ millions) |
|---|---|---|---|
| Ontario Electricity Rebate (OER), replaced the Fair Hydro Plan (FHP) in November 2019 | Provides a rebate to all households on their pre-tax electricity bills. | Rebate equal to 31.8 per cent of the pre-tax electricity bill. | $2,781 |
| Distribution Rate Protection Program (DRP) | Reduces the cost of delivering electricity to households in areas with high electricity distribution costs. | Monthly base delivery charge capped at $36.90. | $253 |
| Rural or Remote Electricity Rate Protection Program (RRRP) | Reduces the cost of delivering electricity to households in rural or remote areas of Ontario. | Monthly delivery charge reduced by $60.50. | $241 |
| Ontario Electricity Support Program (OESP) | Reduces electricity bills for eligible low-income ratepayers. | On bill credit ranging from $35 to $113 per month depending on household size, income, and energy intensity. | $174 |
| On-Reserve First Nations Delivery Credit | Removes the electricity delivery charge for all on-reserve First Nations households. | Monthly delivery charge eliminated. | $24 |
| Total | $3,473 |
Overall, the FAO estimates that the Province’s electricity subsidy programs reduced the cost of electricity for the average Ontario household by $609 in 2019.[7] In general, as a household’s average income increased, the average electricity subsidy provided by the Province increased, with the exception of households in the lowest income quintile, which received higher average subsidies than households in the second income quintile.
Figure 3Ontario household average home electricity subsidy by income quintile and program, 2019
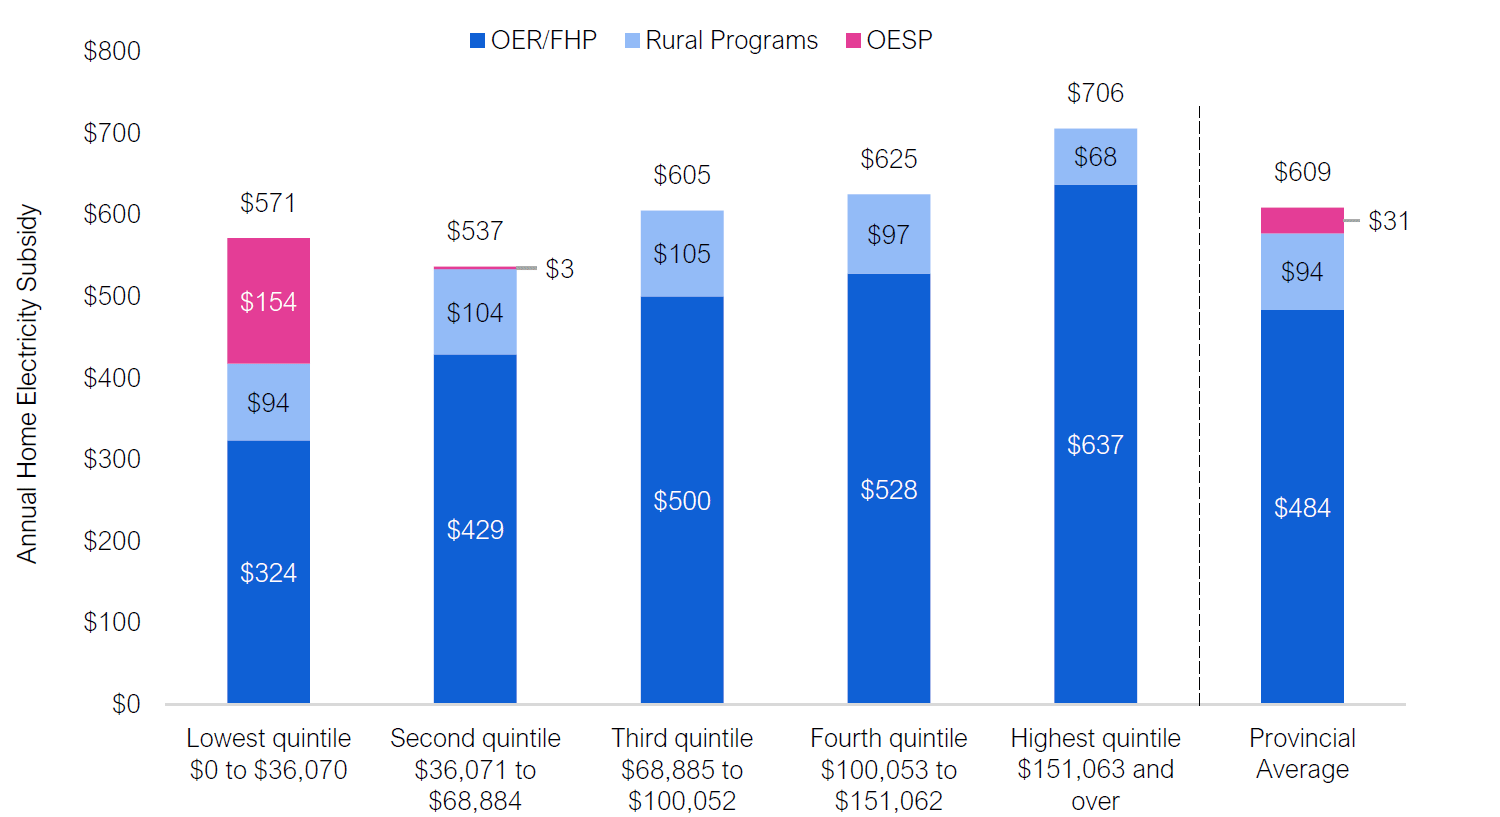
Note: “OER/FHP” is the Ontario Electricity Rebate program (previously the Fair Hydro Plan); “Rural Programs” is the Distribution Rate Protection Program, the Rural or Remote Electricity Rate Protection Program, and the On-Reserve First Nations Delivery Credit; and the “OESP” is the Ontario Electricity Support Program.
Source: FAO.
The average cost reduction varied across income quintiles due to differences in electricity consumption and program eligibility. The FAO has grouped the provincial subsidy programs into three categories: the OER/FHP, which provides benefits that scale with the total household electricity bill, the OESP which provides a monthly on-bill credit to low-income households, and rural programs that reduce electricity delivery charges for rural and on-reserve households (the DRP, RRRP and the On-Reserve First Nations Delivery Credit).
Households in the fourth and highest income quintiles received the highest average benefits from provincial subsidy programs, at $625 and $706 per household, respectively, because higher income households received the most benefits on average from the OER/FHP. The subsidy paid by the OER/FHP is calculated based on electricity consumption and the total electricity bill, therefore, as higher income households use more electricity, they also receive higher average benefits. On the other hand, higher income households did not receive any benefit from the OESP, which is targeted to lower income households, and fewer benefits from the rural programs.
Households in the third and lowest income quintiles received the next highest average benefits at $605 and $571 per household, respectively. Households in the third quintile used less electricity on average than households in higher income quintiles and therefore received lower subsidies from the OER/FHP. Households in the lowest income quintile received the lowest average benefits from the OER/FHP; however, they received the vast majority of the OESP benefits.
Finally, households in the second income quintile received the lowest average benefits at $537 per household. This is due to a combination of having relatively low electricity consumption compared to higher income quintiles and less eligibility for OESP benefits compared to the lowest income quintile.
Looking at provincial electricity subsidies as a share of total household electricity costs (i.e., subsidy as a share of total electricity costs without subsidy), the FAO estimates that the Province subsidized 34 per cent of total home electricity costs in 2019.[8] Households in the lowest income quintile had the largest proportion of their electricity costs subsidized at 48 per cent. The distribution of subsidies for the second through fourth income quintiles was relatively flat, ranging from 34 per cent to 32 per cent, while the highest income households had the lowest share of their electricity costs subsidized at 29 per cent.
Figure 4Share of household electricity costs subsidized by provincial programs in 2019 by income quintile
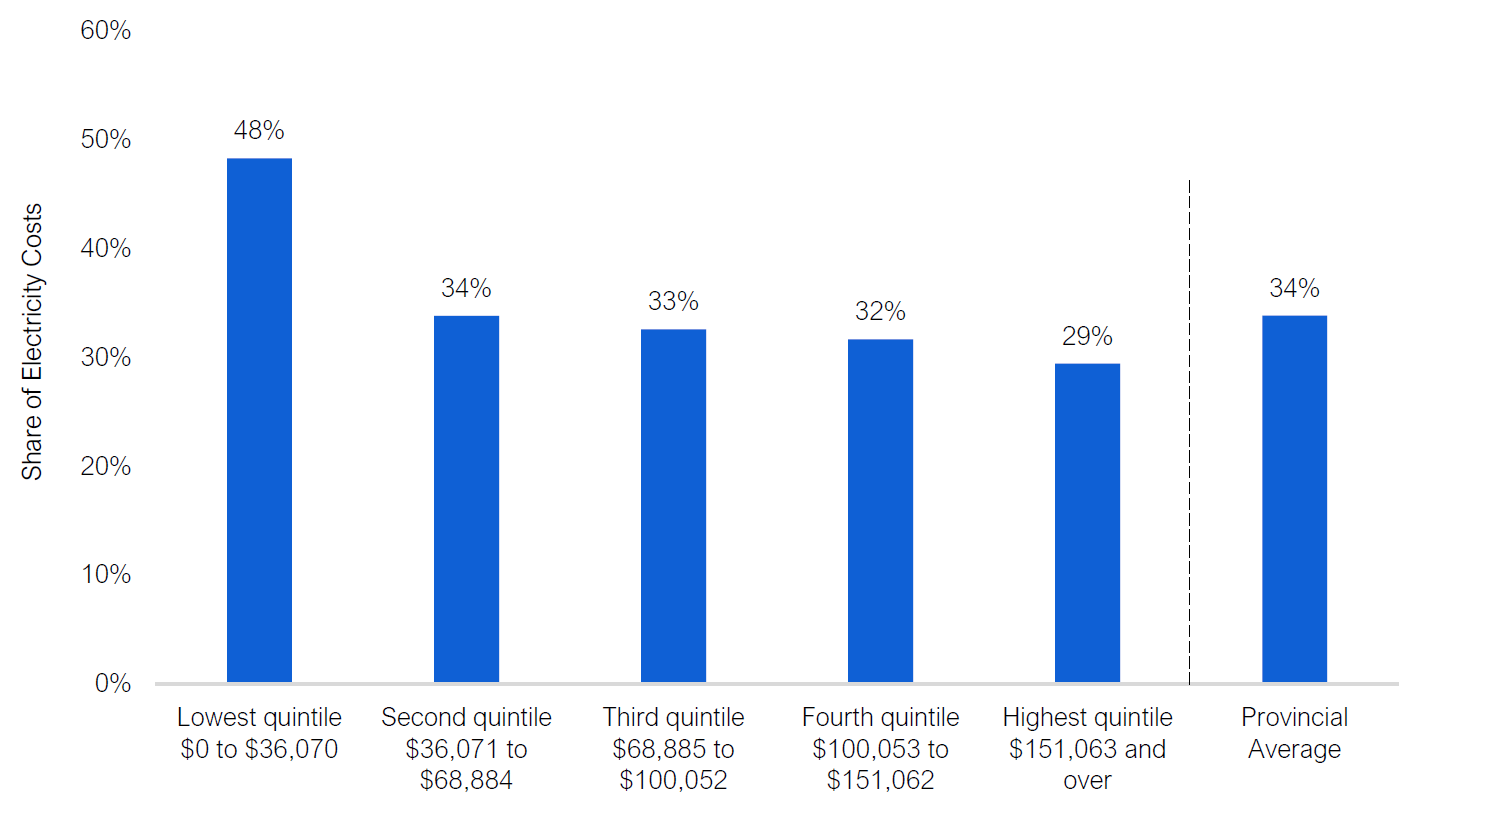
Source: FAO.
Home Energy Spending by Region
To illustrate the differences in home energy spending across Ontario, the FAO has separated the province into the five regions depicted in Figure 5: North, East, West, Hamilton-Niagara and the Greater Toronto Area (GTA).[9] In 2019, households in the Eastern ($2,338), Northern ($2,245), and Western ($2,192) regions had the highest home energy costs, while households in the GTA ($2,010) and Hamilton-Niagara ($2,118) regions spent the least on home energy.[10]
Figure 5Average Ontario household home energy spending by region in 2019
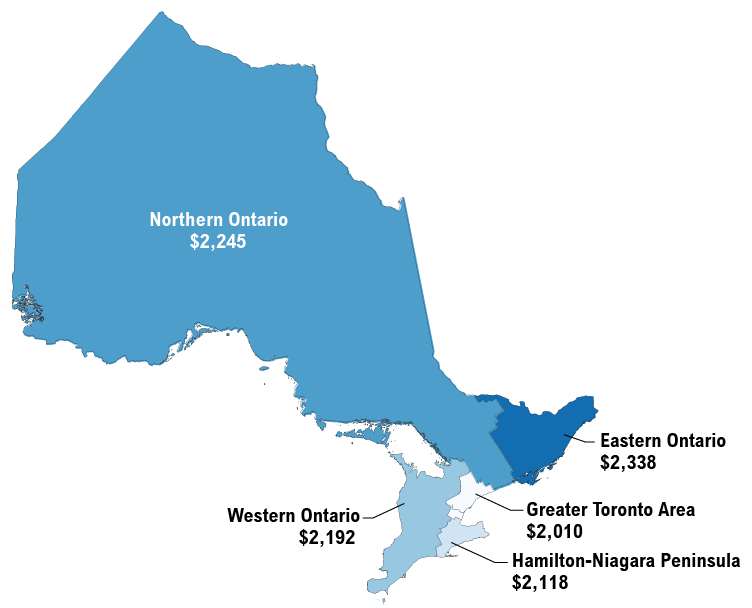
Note: Eastern region is Statistics Canada’s economic regions of Ottawa and Kingston-Pembroke; Hamilton-Niagara region is the economic region of Hamilton-Niagara Peninsula; Northern region is the economic regions of Muskoka-Kawarthas, Northeast, and Northwest; Greater Toronto Area region is the economic region of Toronto; and Western region is the economic regions of Kitchener-Waterloo-Barrie, London, Windsor-Sarnia, and Stratford Bruce Peninsula.
Source: Adapted by FAO from Statistics Canada, Survey of Household Spending, 2019.
Three of the main factors that contribute to the differences in home energy spending across Ontario regions are the average household income of the region, differences in the sources of energy used for home heating, and the cost of distributing energy to the region. As discussed above in the analysis of home energy spending by income level, households with higher average incomes spend more on home energy. Therefore, regions with higher average household incomes will tend to have higher home energy spending.
The other two factors, the sources of energy used for home heating and the cost of distributing energy, are closely related to the population density (population per square kilometer) of the region. Households in rural regions of Ontario tend to have higher home energy costs due to less access to natural gas, which is the most cost-effective energy source for home heating. They also tend to pay higher energy prices due to the high cost of distributing electricity and fuels to rural areas. For perspective, the FAO estimates households in rural areas of Ontario (with populations of 1,000 or lower) spent $3,198 on home energy in 2019, compared to an average $2,002 spent by households in large urban centres (with populations of 250,000 or more). This represents 60 per cent higher spending on home energy by rural households compared to households in large urban centres.
Figure 6Average home energy spending by size of population centre, 2019
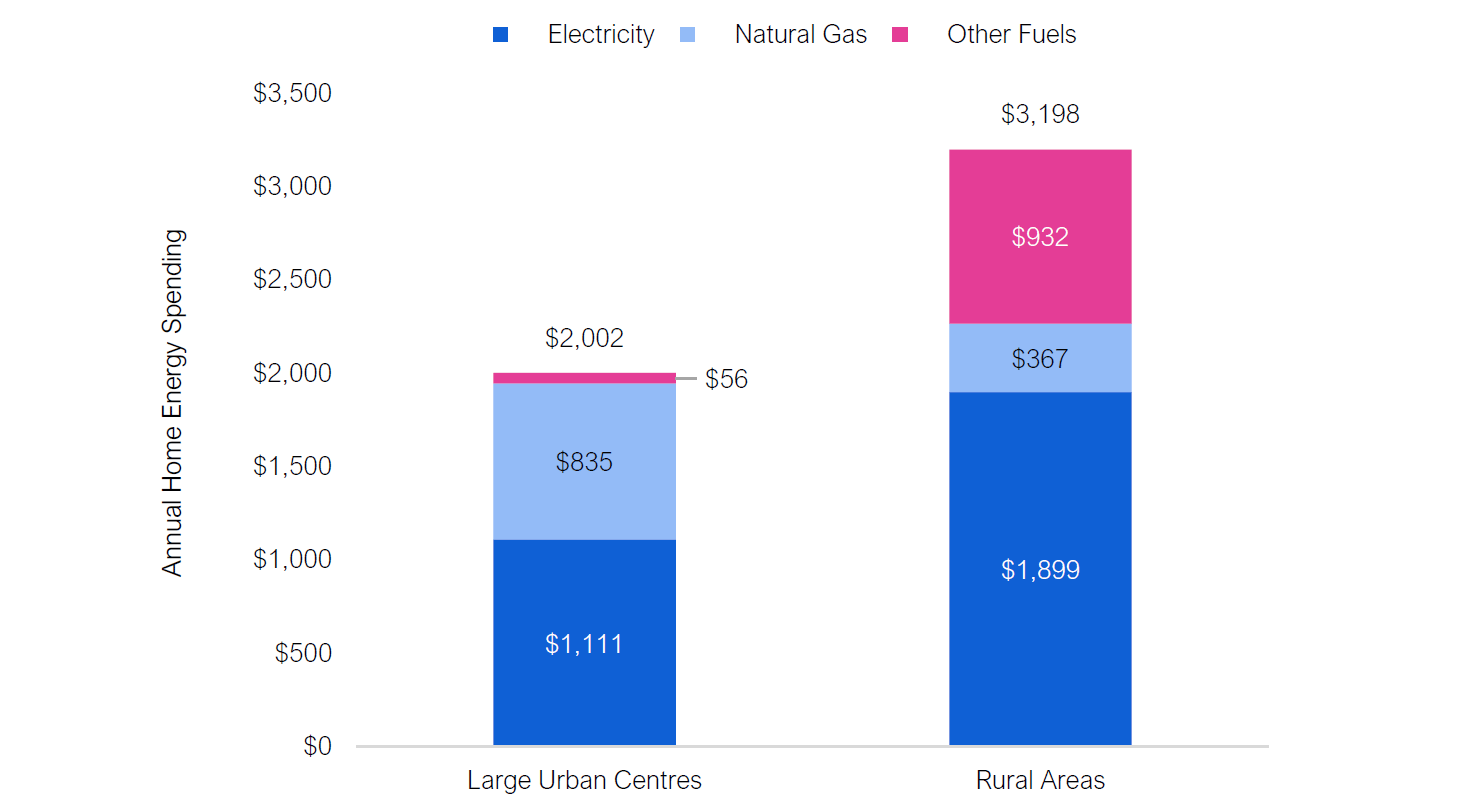
Note: Large urban centres have populations of 250,000 or higher. Rural areas have populations of 1,000 or lower.
Source: Adapted by FAO from Statistics Canada, Survey of Household Spending, 2019.
Looking at home energy spending across the five regions used in the FAO’s analysis, population density and average household income are key indicators of the differences in home energy spending.
| Region | Average Home Energy Spending | Population per Square Kilometer | Average Before-Tax Household Income |
|---|---|---|---|
| Eastern Region | $2,338 | 49 | $108,888 |
| Northern Region | $2,245 | 1 | $81,671 |
| Western Region | $2,192 | 74 | $93,702 |
| Hamilton-Niagara Region | $2,118 | 198 | $92,614 |
| Greater Toronto Area Region | $2,010 | 898 | $107,967 |
| Provincial Average | $2,128 | 13 | $100,884 |
The Eastern region has the highest home energy spending in Ontario due to a combination of having the highest average household income and the second lowest population density. High household incomes and large dwelling sizes, particularly in the Ottawa-Gatineau area, drive high energy use in the Eastern region.[11] The Eastern region also has a large rural population that relies on more expensive electricity and other fuels for home heating.
The Northern region has the second highest home energy spending in Ontario. The Northern region has the lowest population density leading to high home heating costs due to less access to natural gas and high energy distribution costs. Additionally, the colder climate in the Northern region contributes to higher energy use for home heating. These factors are partially offset by the impact of lower average household incomes and higher provincial electricity subsidies.
The Western region has the third highest home energy spending in Ontario. This region has both the third highest average household income and population density.
Finally, households in the GTA and Hamilton-Niagara regions spend the least on home energy. These two regions have the highest population densities, the highest use of natural gas for home heating, and the lowest energy distribution costs. Interestingly, the GTA region has the lowest home energy costs despite having the second highest average household income, reflecting the very high use of natural gas in the GTA.
As outlined in Figure 7, the share of household energy spending by source varies by region reflecting the factors discussed above. The more rural Eastern, Northern, and Western regions have the highest spending on other fuels and electricity, reflecting the higher use of those energy sources for home heating. The more urban GTA and Hamilton-Niagara regions have the highest spending on natural gas and lowest on electricity and other fuels, reflecting the higher use of natural gas for home heating in those regions.
Figure 7Average household home energy spending in Ontario by energy source and region, 2019
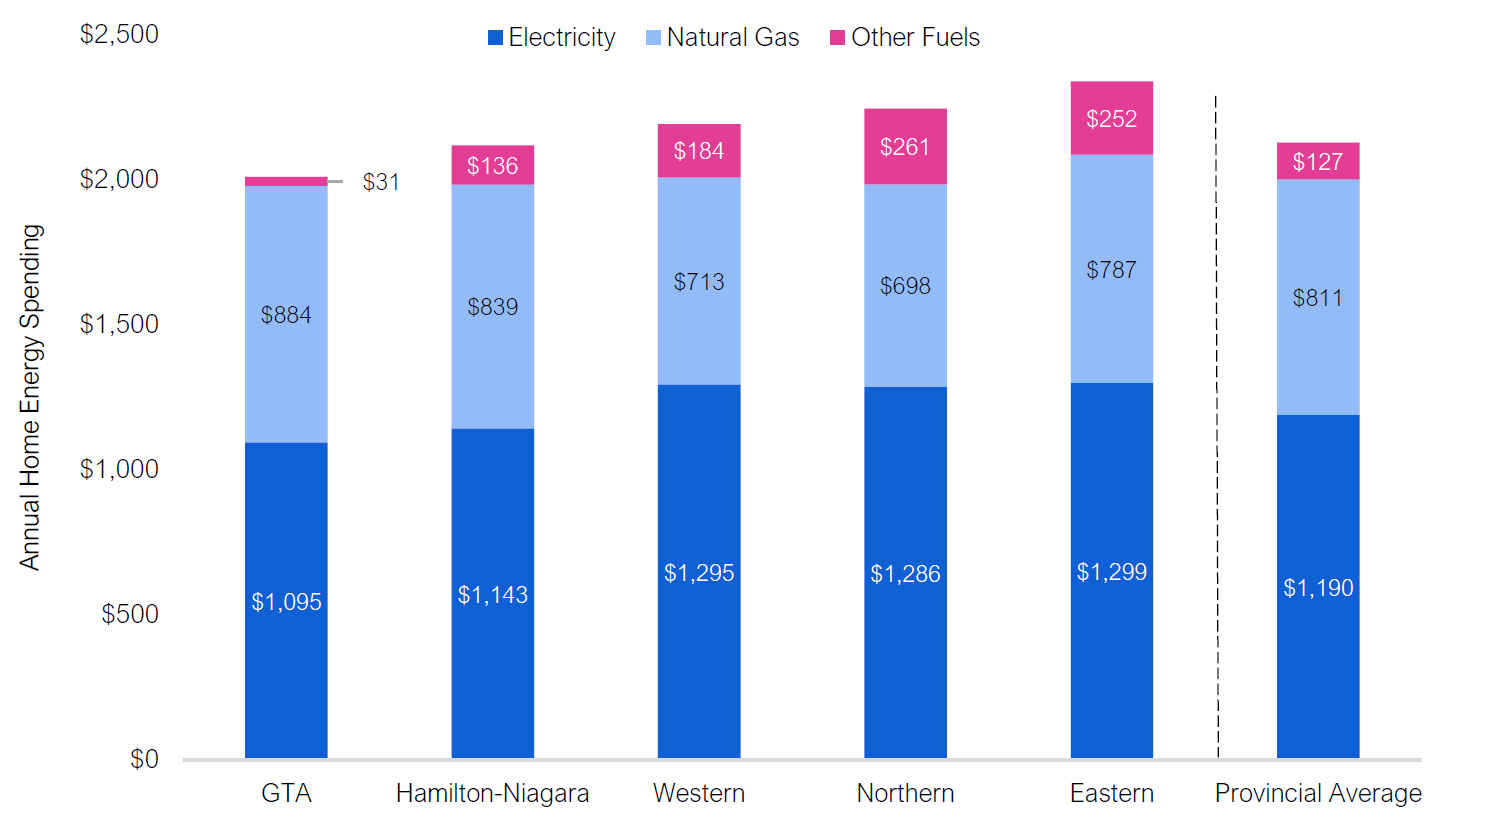
Note: Eastern region is Statistics Canada’s economic regions of Ottawa and Kingston-Pembroke; Hamilton-Niagara region is the economic region of Hamilton-Niagara Peninsula; Northern region is the economic regions of Muskoka-Kawarthas, Northeast, and Northwest; Greater Toronto Area region is the economic region of Toronto; and Western region is the economic regions of Kitchener-Waterloo-Barrie, London, Windsor-Sarnia, and Stratford Bruce Peninsula.
Source: Adapted by FAO from Statistics Canada, Survey of Household Spending, 2019.
Effect of Provincial Home Electricity Subsidy Programs by Region
The differences in home energy spending across regions is significantly mitigated by provincial electricity subsidies. Households in rural areas of Ontario receive higher provincial electricity subsidies than households in urban areas. This is due to a combination of higher electricity use in rural regions, leading to higher subsidies from the OER/FHP, and the rural programs (DRP, RRRP and the On-Reserve First Nations Delivery Credit) that provide targeted assistance to rural and remote ratepayers.
Overall, the FAO estimates that households in the Northern region received the highest average provincial subsidies in 2019 at $995 per household. This is due to a combination of having the highest average electricity consumption and the highest proportion of households receiving targeted rural subsidies. The Eastern and Western regions received average benefits of $712 and $682, respectively, due to having lower average electricity consumption and higher population density than the Northern region. The Hamilton-Niagara and GTA regions received the lowest average benefits at $546 and $467 per household, respectively, due to having both the lowest average electricity consumption and highest population density of all regions, leading to limited benefit from the Province’s rural subsidy programs.
Figure 8Average household home electricity subsidy by program and region, 2019
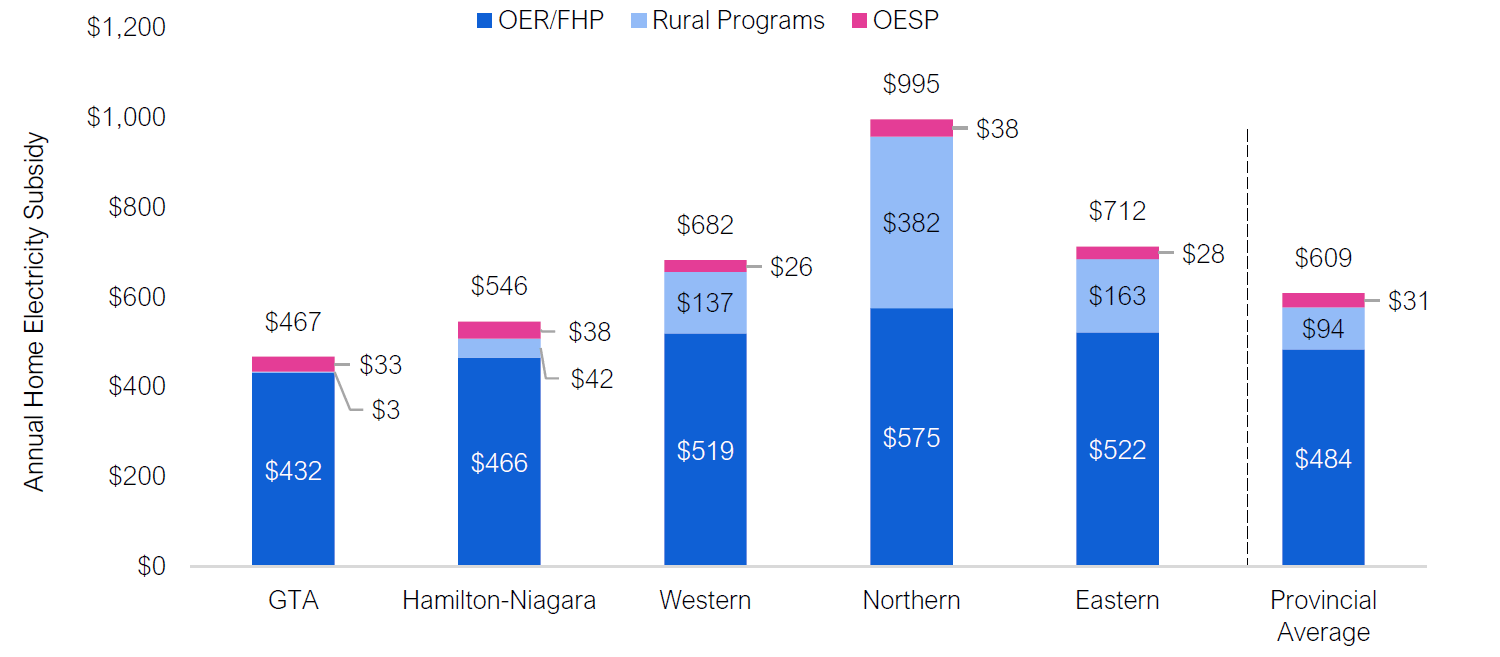
Note: Eastern region is Statistics Canada’s economic regions of Ottawa and Kingston-Pembroke; Hamilton-Niagara region is the economic region of Hamilton-Niagara Peninsula; Northern region is the economic regions of Muskoka-Kawarthas, Northeast, and Northwest; Greater Toronto Area region is the economic region of Toronto; and Western region is the economic regions of Kitchener-Waterloo-Barrie, London, Windsor-Sarnia, and Stratford Bruce Peninsula.
Source: FAO.
Without provincial electricity subsidies, the differences in home energy spending across regions in Ontario would be significantly higher. For example, without provincial electricity subsidies, in 2019 households in the Northern region would have had the highest annual home energy spending at $3,240 and would have spent $763, or 31 per cent more on home energy than households in the GTA. However, after accounting for provincial electricity subsidies, households in the Northern region on average spent only $235 or 12 per cent more on home energy than households in the GTA.
Figure 9Impact of provincial electricity subsidies on home energy spending by region, 2019
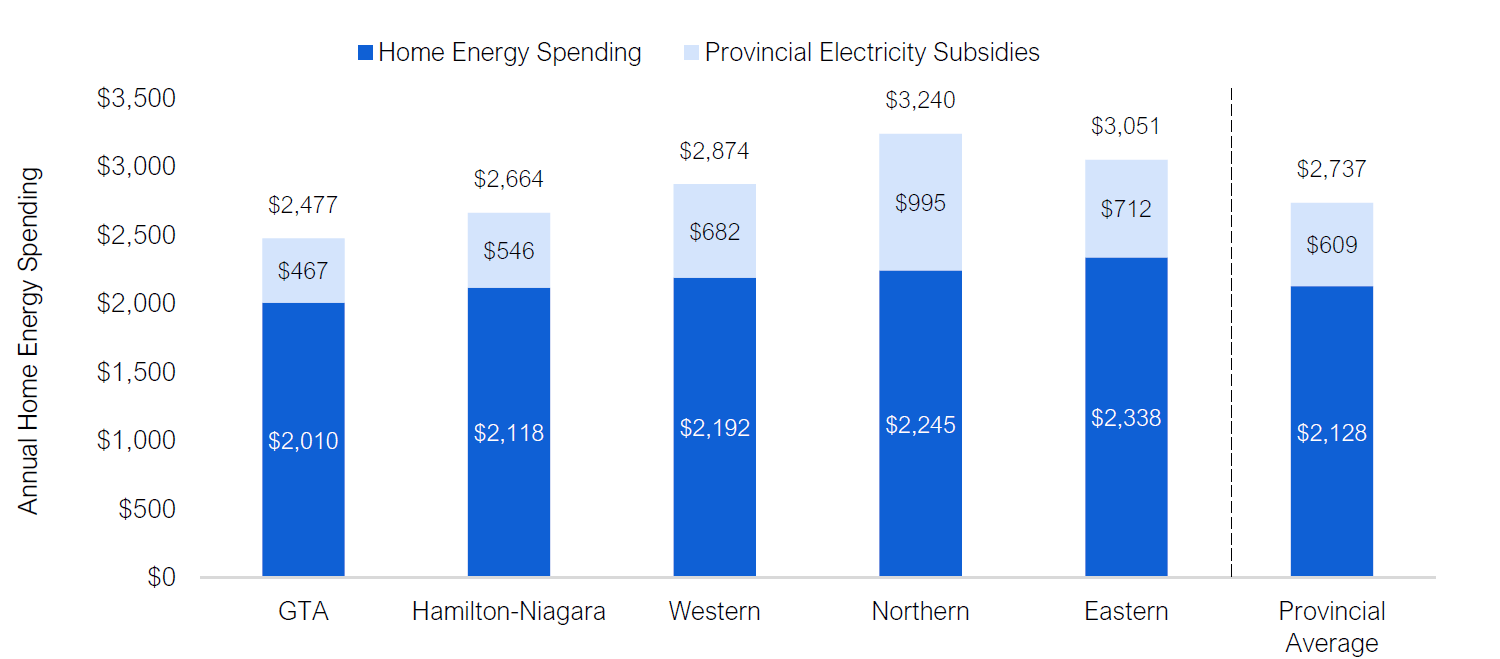
Note: Eastern region is Statistics Canada’s economic regions of Ottawa and Kingston-Pembroke; Hamilton-Niagara region is the economic region of Hamilton-Niagara Peninsula; Northern region is the economic regions of Muskoka-Kawarthas, Northeast, and Northwest; Greater Toronto Area region is the economic region of Toronto; and Western region is the economic regions of Kitchener-Waterloo-Barrie, London, Windsor-Sarnia, and Stratford Bruce Peninsula.
Source: FAO.
Graphic Descriptions
| Income Quintile | Average Home Energy Spending | Share of Before-Tax Income |
|---|---|---|
| Lowest quintile $0 to $36,070 |
$1,050 | 4.6% |
| Second quintile $36,071 to $68,884 |
$1,856 | 3.6% |
| Third quintile $68,885 to $100,052 |
$2,239 | 2.7% |
| Fourth quintile $100,053 to $151,062 |
$2,419 | 2.0% |
| Highest quintile $151,063 and over |
$3,070 | 1.2% |
| Income Quintile | Electricity | Natural Gas | Other Fuels |
|---|---|---|---|
| Lowest quintile $0 to $36,070 |
59%, $616 | 32%, $333 | 10%, $101 |
| Second quintile $36,071 to $68,884 |
57%, $1,049 | 40%, $739 | 4%, $68 |
| Third quintile $68,885 to $100,052 |
56%, $1,251 | 37%, $839 | 7%, $149 |
| Fourth quintile $100,053 to $151,062 |
55%, $1,342 | 41%, $989 | 4%, $88 |
| Highest quintile $151,063 and over |
55%, $1,691 | 37%, $1,151 | 7%, $228 |
| Provincial Average | 56%, $1,190 | 38%, $811 | 6%, $127 |
| Income Quintile | OER/FHP | Rural Programs | OESP | Total |
|---|---|---|---|---|
| Lowest quintile $0 to $36,070 |
$324 | $94 | $154 | $571 |
| Second quintile $36,071 to $68,884 |
$429 | $104 | $3 | $537 |
| Third quintile $68,885 to $100,052 |
$500 | $105 | $0 | $605 |
| Fourth quintile $100,053 to $151,062 |
$528 | $97 | $0 | $625 |
| Highest quintile $151,063 and over |
$637 | $68 | $0 | $706 |
| Average | $484 | $94 | $31 | $609 |
| Income Quintile | Share of Electricity Costs |
|---|---|
| Lowest quintile $0 to $36,070 |
48% |
| Second quintile $36,071 to $68,884 |
34% |
| Third quintile $68,885 to $100,052 |
33% |
| Fourth quintile $100,053 to $151,062 |
32% |
| Highest quintile $151,063 and over |
29% |
| Provincial Average | 34% |
| Region | Average Home Energy Spending |
|---|---|
| Northern Ontario | $2,245 |
| Eastern Ontario | $2,338 |
| Western Ontario | $2,192 |
| Greater Toronto Area | $2,010 |
| Hamilton-Niagara Peninsula | $2,118 |
| Energy Source | Large Urban Centres | All Rural Areas |
|---|---|---|
| Electricity | $1,111 | $1,899 |
| Natural gas | $835 | $367 |
| Other fuel | $56 | $932 |
| Total | $2,002 | $3,198 |
| Region | Electricity | Natural Gas | Other Fuels |
|---|---|---|---|
| GTA | $1,095 | $884 | $31 |
| Hamilton-Niagara | $1,143 | $839 | $136 |
| Western | $1,295 | $713 | $184 |
| Northern | $1,286 | $698 | $261 |
| Eastern | $1,299 | $787 | $252 |
| Provincial Average | $1,190 | $811 | $127 |
| Region | OER/FHP | Rural Programs | OESP | Total |
|---|---|---|---|---|
| GTA | $432 | $3 | $33 | $467 |
| Hamilton-Niagara | $466 | $42 | $38 | $546 |
| Western | $519 | $137 | $26 | $682 |
| Northern | $575 | $382 | $38 | $995 |
| Eastern | $522 | $163 | $28 | $712 |
| Provincial Average | $484 | $94 | $31 | $609 |
| Region | Home Energy Spending | Provincial Electricity Subsidies | Total |
|---|---|---|---|
| GTA | $2,010 | $467 | $2,477 |
| Hamilton-Niagara | $2,118 | $546 | $2,664 |
| Western | $2,192 | $682 | $2,874 |
| Northern | $2,245 | $995 | $3,240 |
| Eastern | $2,338 | $712 | $3,051 |
| Provincial Average | $2,128 | $609 | $2,737 |
Footnotes
[1] In 2019, the Province spent $3.5 billion to lower electricity bills for Ontario households through five programs. See Table 1 for more information.
[2] See Figure 5 for a map of the five regions and additional information. The five regions used in the analysis were developed by the FAO in collaboration with Statistics Canada.
[3] Statistics Canada, Households and the Environment: Energy Use.
[4] Independent Electricity System Operator, Ontario Residential End-Use Survey, 2018.
[5] Excludes electricity and other energy subsidies for non-residential ratepayers and energy subsidies that do not directly reduce Ontario households’ on-bill electricity costs, including the Ontario Energy and Property Tax Credit and the Northern Ontario Energy Credit. Also excludes the Low-income Energy Assistance Program (LEAP), which provides emergency financial assistance for households that face having their electricity and natural gas services disconnected.
[6] The charges from carbon pricing are factored into average household spending on home energy; however, the payments to Ontario households from the Government of Canada’s Climate Action Incentive are not included in the calculations of home energy spending. For more information on the impact of carbon pricing on home energy spending in 2019 see FAO, “Home Energy Spending on Ontario, 2019 Update,” 2020.
[7] Note that this is the average combined subsidy across all households. Individual households will not be eligible for every subsidy program.
[8] This means that without provincial electricity subsidies in 2019 the average Ontario household would have paid $1,799 in electricity costs instead of $1,190.
[9] The five regions used in the analysis were developed by the FAO in collaboration with Statistics Canada to achieve sufficient sample sizes while showing geographical variation.
[10] Eastern region is Statistics Canada’s economic regions of Ottawa and Kingston-Pembroke; Hamilton-Niagara region is the economic region of Hamilton-Niagara Peninsula; Northern region is the economic regions of Muskoka-Kawarthas, Northeast, and Northwest; Greater Toronto Area region is the economic region of Toronto; and Western region is the economic regions of Kitchener-Waterloo-Barrie, London, Windsor-Sarnia, and Stratford Bruce Peninsula. Defined by Statistics Canada, Ontario’s economic regions are groupings of census divisions used to create a standard geographical unit for analyzing regional economic activity. For more information, see Statistics Canada’s Standard Geographical Classification – Economic Regions.
[11] Statistics Canada, Table 46-10-0028-01, Living area and assessment value per square foot of residential properties by property type and period of construction, provinces of Nova Scotia, Ontario and British Columbia.