


Key Points
- Home energy spending represents what Ontarians pay to heat and cool their homes and power their appliances.
- The average Ontario household spent $2,165 on home energy in 2019. The majority of home energy spending is for electricity ($1,195), followed by natural gas ($842) and other fuels ($128).
- From 2010 to 2016, spending by Ontario households on home energy increased by 16 per cent, from $2,078 in 2010 to $2,408 in 2016. This increase in spending was driven primarily by rapid growth in the cost of electricity.
- From 2016 to 2019, spending by Ontario households on home energy decreased by 10 per cent, from $2,408 in 2016 to $2,165 in 2019. This decrease was the result of the Fair Hydro Plan, an electricity cost subsidy program introduced by the Province in 2017.
- In 2019, the average Ontario household spent 2.6 per cent of their after-tax (i.e., disposable) income on home energy costs.
- From 2010 to 2016, the share of household disposable income spent on home energy costs stayed relatively constant (ranging from 2.9 per cent to 3.1 per cent), as higher home energy costs were offset by higher average household incomes.
- Since 2016, Ontario households have spent a declining share of disposable income on home energy, mainly due to the Fair Hydro Plan’s electricity cost subsidy.
- The average Ontario household spends more on home energy than households in Manitoba, Quebec and British Columbia but less than households in the Atlantic Provinces, Saskatchewan and Alberta.
- Since 2010, Ontario households have experienced the smallest increase in home energy costs by a significant margin, when compared to households in the other provinces. Between 2010 and 2019, average annual home energy spending in Ontario increased by $87 (0.5 per cent average annual growth). Including all households in Canada, average annual home energy spending increased by $216, or 1.2 per cent per year.
Introduction
Home energy spending represents what Ontarians pay to heat and cool their homes and power their appliances. The amount Ontario households spend on home energy depends on the cost of electricity and fuels, and how much energy households consume. Over the past decade, the cost of home energy has been an important subject of debate and the government of Ontario (the Province) has introduced a number of programs to subsidize electricity costs for Ontario households. More recently, the implementation of carbon pricing, first by the Province and subsequently by the federal government, has affected home energy spending by adding a carbon charge to the cost of fuels.
The purpose of this report is to review Ontario spending on home energy in 2019 and how that spending has changed since 2010. The report also looks at home energy spending in Ontario as a share of after-tax household income. Finally, the report compares home energy spending in Ontario with the other provinces.
Home Energy Spending in Ontario, 2010 to 2019
In 2019, the FAO estimates that the average Ontario household spent $2,165 on home energy. The majority of home energy spending is for electricity ($1,195), followed by natural gas ($842) and other fuels ($128).[1] Over the past decade, Ontario households have experienced a rise and fall in home energy costs. From 2010 to 2016, average home energy spending increased by 16 per cent, from $2,078 in 2010 to $2,408 in 2016. However, from 2016 to 2019, home energy spending declined by 10 per cent to $2,165. The rise and decline in home energy spending is due to a combination of varying prices for electricity and fuels, changes in household energy consumption, and provincial programs that subsidize a portion of home electricity costs.
Ontario household average home energy spending by source, 2010 to 2019, ($)
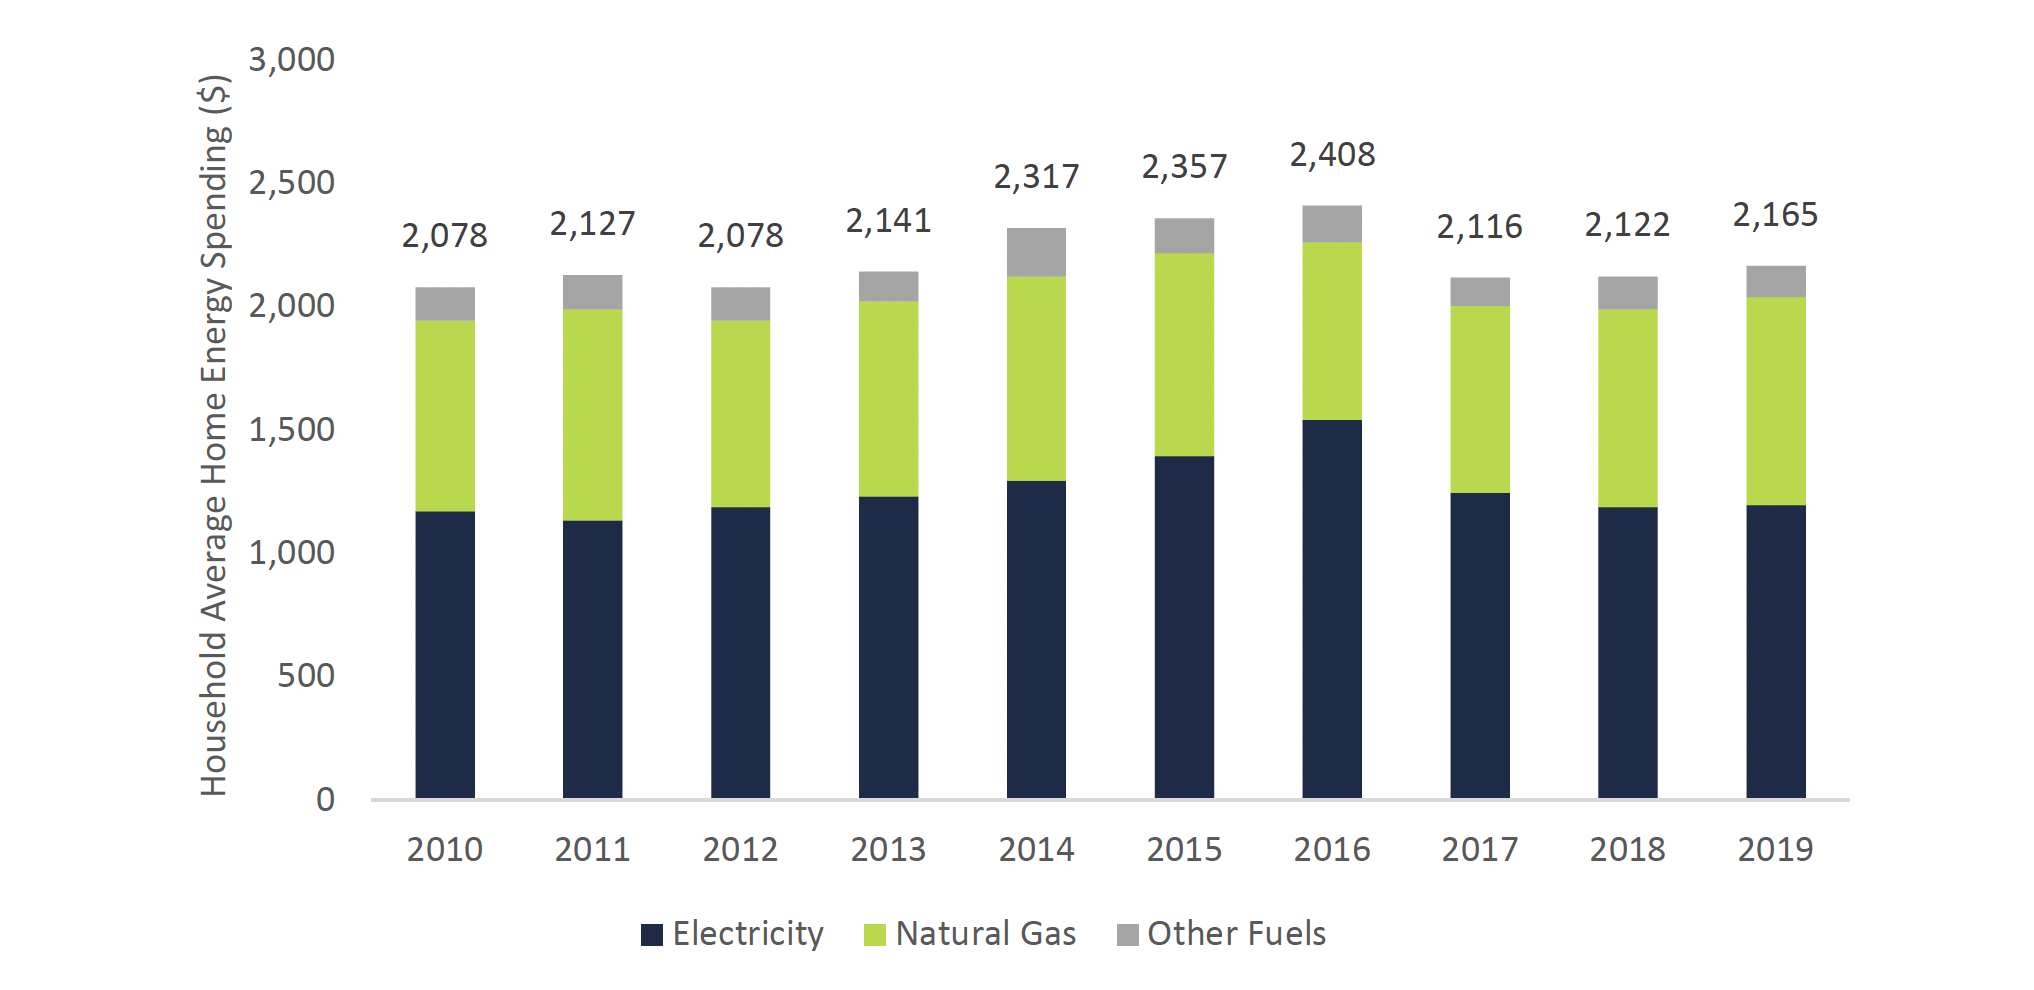
Source: FAO analysis of data from the Ontario Energy Board and Statistics Canada.
Accessible version
This figure is a bar chart showing how much Ontario households spend on home energy costs by source. The sources of energy are electricity, natural gas and other fuels. In 2010, Ontario households paid $1,171 in electricity, $772 in natural gas and $135 in other fuels, for a total of $2,078. Total home energy expense grew to $2,141 by 2013 and $2,408 by 2016. In 2017, total home energy expenses decreased to $2,116, mainly because electricity expense fell by $296 compared to a year priory. Home energy expenses increased to $2,165 by 2019.
Cost of Electricity Has Driven Changes in Home Energy Spending
Most of the variation in home energy spending from 2010 to 2019 has been due to a rise and fall in the cost of electricity. From 2010 to 2016, average home electricity costs increased by 32 per cent from $1,171 to $1,541 per year. This occurred despite a 10 per cent decline in average household electricity consumption.[2]
The increase in the cost of electricity from 2010 to 2016 was driven primarily by rapid growth in the supply cost of electricity (i.e., the cost of generating electricity) in Ontario.[3] Additionally, the sharp increase from 2015 to 2016 was due to the expiry of the Ontario Clean Energy Benefit. The Ontario Clean Energy Benefit was a provincial electricity cost subsidy program that provided households with a 10 per cent rebate on their after-tax electricity bills from 2011 to 2015.
From 2016 to 2019, average annual home electricity spending declined by 22 per cent, from $1,541 to $1,195. This decline was due to the Fair Hydro Plan, an electricity cost subsidy program implemented by the Province in 2017. The Fair Hydro Plan committed to reduce residential electricity bills by 25 per cent and to hold electricity bill increases to the rate of inflation for four years.[4]
Effect of electricity cost subsidies on household electricity spending, 2010 to 2019, ($)
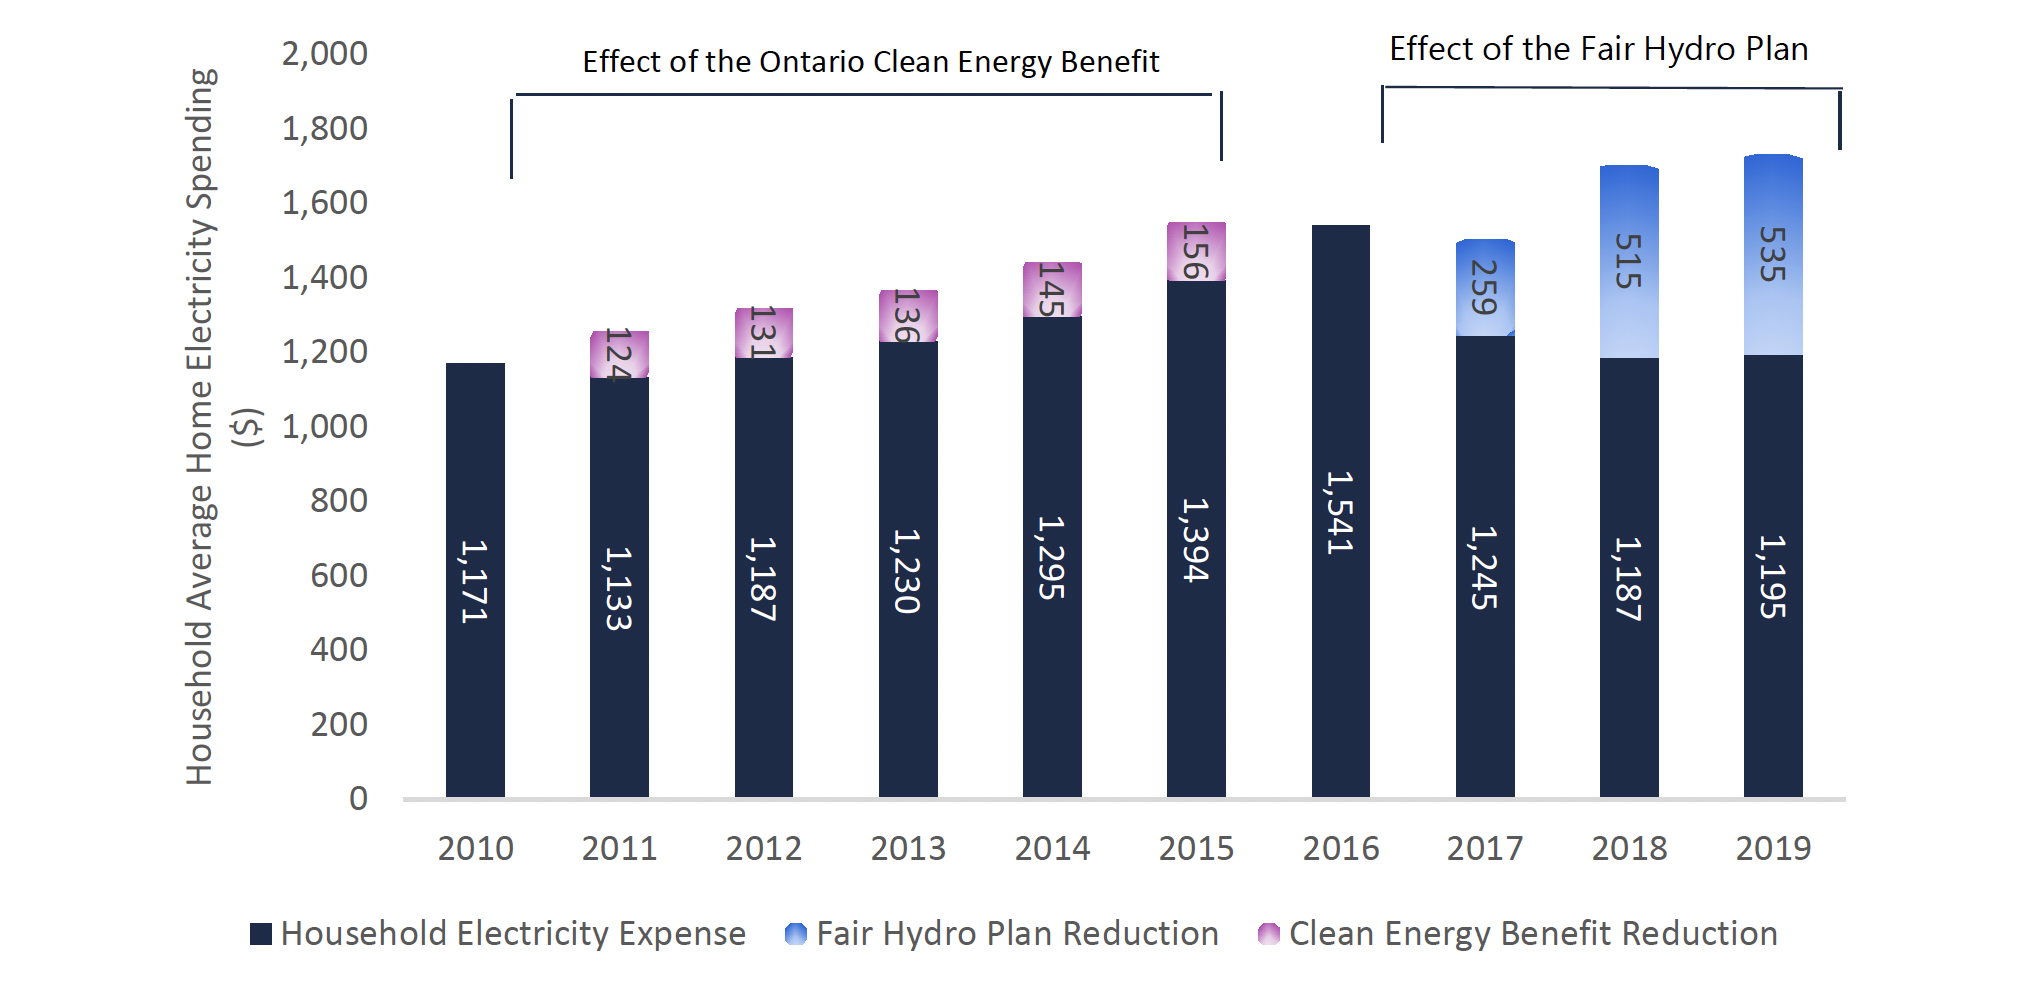
Source: FAO analysis of data from the Ontario Energy Board and Statistics Canada.
Accessible version
This figure is a bar chart that shows the effect of electricity cost subsidies on household electricity spending from 2010 to 2019. The Ontario Clean Energy Benefit Reduction was in place from 2011 to 2015. It saved Ontario households an average of $124 in 2011, increasing to $156 in 2015. The Fair Hydro Plan was introduced in 2017. It saved Ontario households an average of $251 in 2017, increasing to $564 in 2019.
The FAO estimates that the average household in Ontario received a $535 subsidy in 2019 from the Fair Hydro Plan.[5] This household electricity cost subsidy is paid for by the Province and in 2019 cost $3.4 billion.[6] Excluding the subsidies provided by the Ontario Clean Energy Benefit and the Fair Hydro Plan, home electricity spending would have increased by an annual average rate of 4.4 per cent from $1,171 in 2010 to $1,731 in 2019.
Variation in Fuels Expense Driven by Commodity Prices and Carbon Charges
From 2010 to 2019, annual household spending on fuels (e.g., natural gas and oil) fluctuated year to year, averaging $933 over that period. Unlike electricity, this variation was mostly due to changes in commodity (natural gas/oil) prices and household consumption. Interestingly, in 2016, when home energy costs peaked, annual household fuel expense was the lowest of the decade. This was due to a combination of low natural gas prices and warm winter weather.
Average home fuels expense, 2010 to 2019, ($)
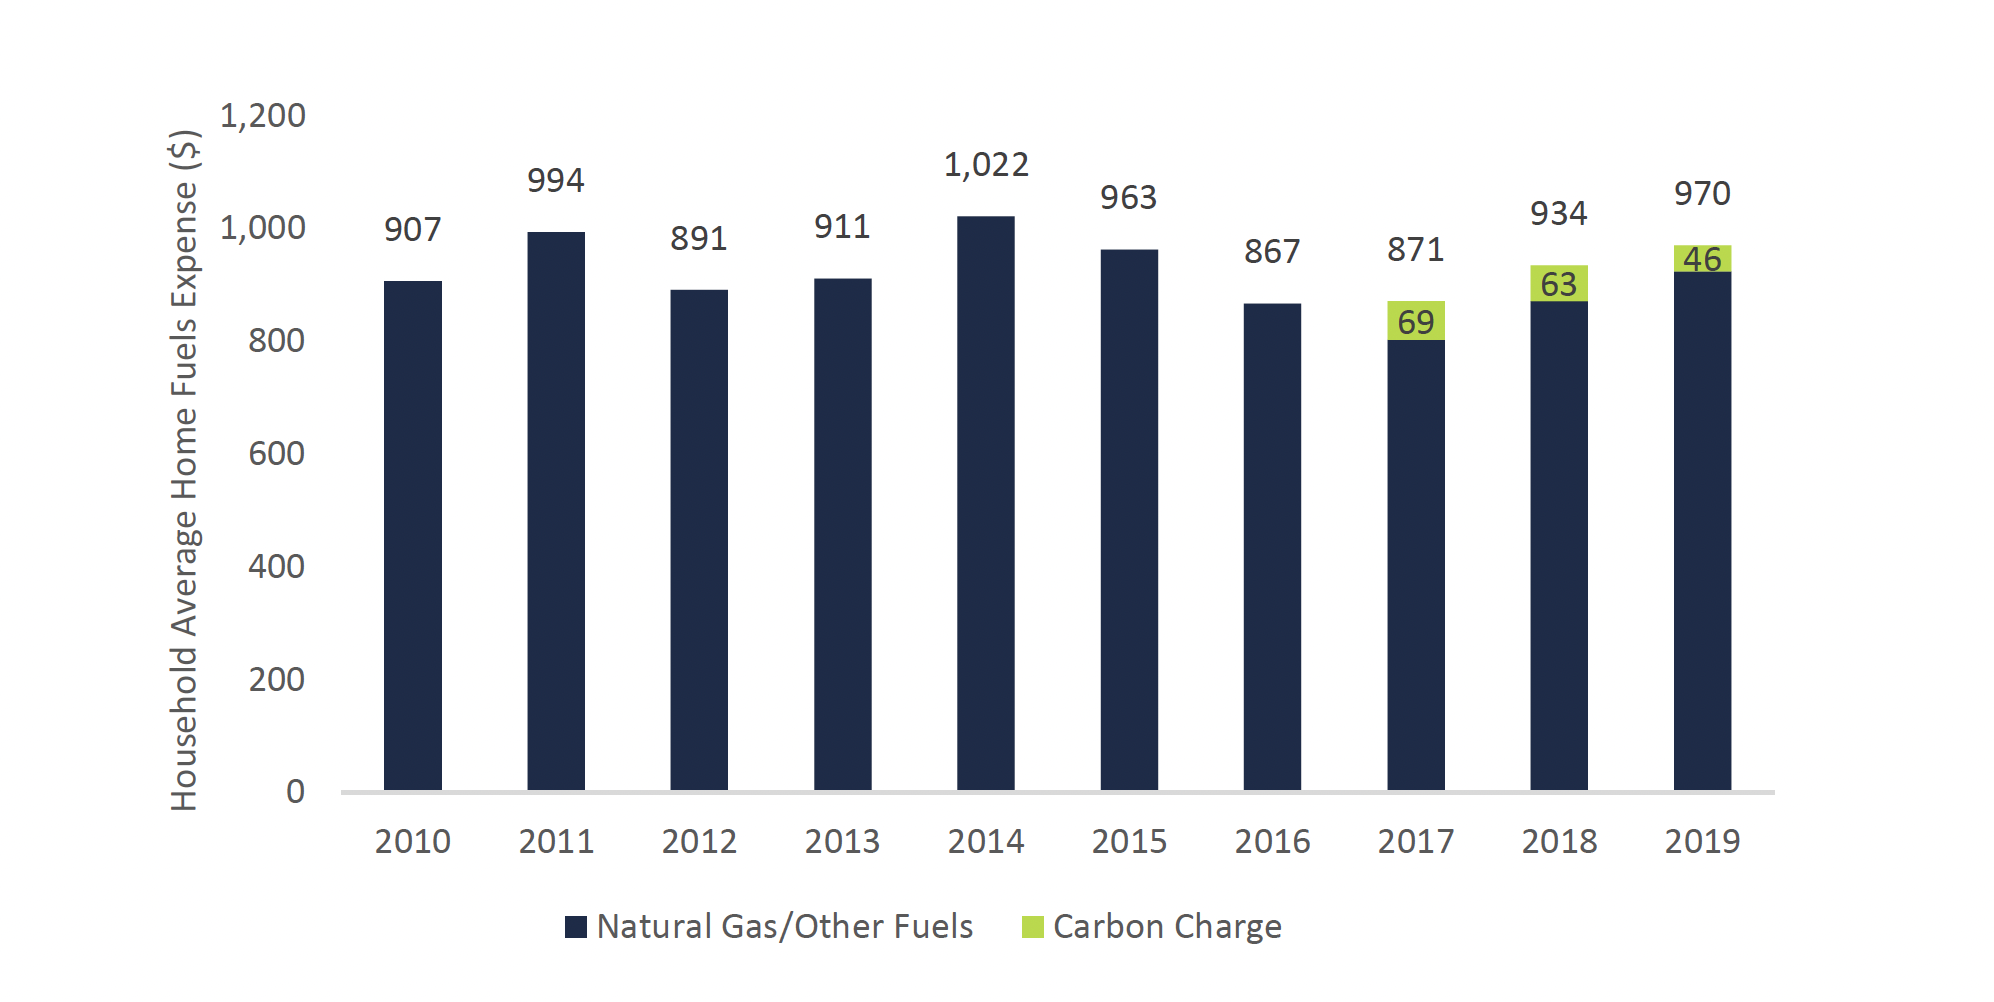
Source: FAO analysis of data from the Ontario Energy Board and Statistics Canada.
Accessible version
The figure is a bar chart showing how much Ontario households spent on home fuels from 2010 to 2019. Households spent an average of $907 on natural gas and other fuels in 2010; $994 in 2011; $891 in 2012; $911 in 2013; $1,022 in 2014; $963 in 2015; $867 in 2016; $871 in 2017, including a $69 carbon charge; $934 in 2018, including a $63 carbon charge; and $970 in 2019, including a $46 carbon charge.
From 2016 to 2019, average annual household fuel spending increased from $867 to $970. This increase was driven by higher consumption and prices for fuels. In addition, part of the increase in fuel prices was due to the implementation of carbon pricing in Ontario.[7] From January 2017 to October 2018, and since April 2019, Ontario households have paid a carbon charge on fuels. In 2017 and 2018, the carbon charge resulted from the Province’s now cancelled cap and trade program, which increased average annual household heating fuel expense by $69 in 2017 and $63 in 2018. On April 1, 2019, the federal government’s carbon tax came into effect, which the FAO estimates increased heating fuel expense by $46 in 2019.[8]
Home Energy Spending as a Share of Disposable Income
In 2019, the average Ontario household spent 2.6 per cent of their after-tax (i.e., disposable) income on home energy costs. From 2010 to 2016, the share of household disposable income spent on home energy costs stayed relatively constant, ranging from 2.9 per cent to 3.1 per cent. Although home energy spending in Ontario peaked in 2016, home energy spending as a share of disposable income remained at 3.0 per cent, the same share as in 2010, due to higher average household incomes.
Since 2016, Ontario households have spent a declining share of disposable income on home energy. The decrease is mainly due to the Fair Hydro Plan’s electricity cost subsidy, which reduced average annual household electricity spending by 22 per cent.
Ontario household home energy spending as a share of disposable income, 2010 to 2019
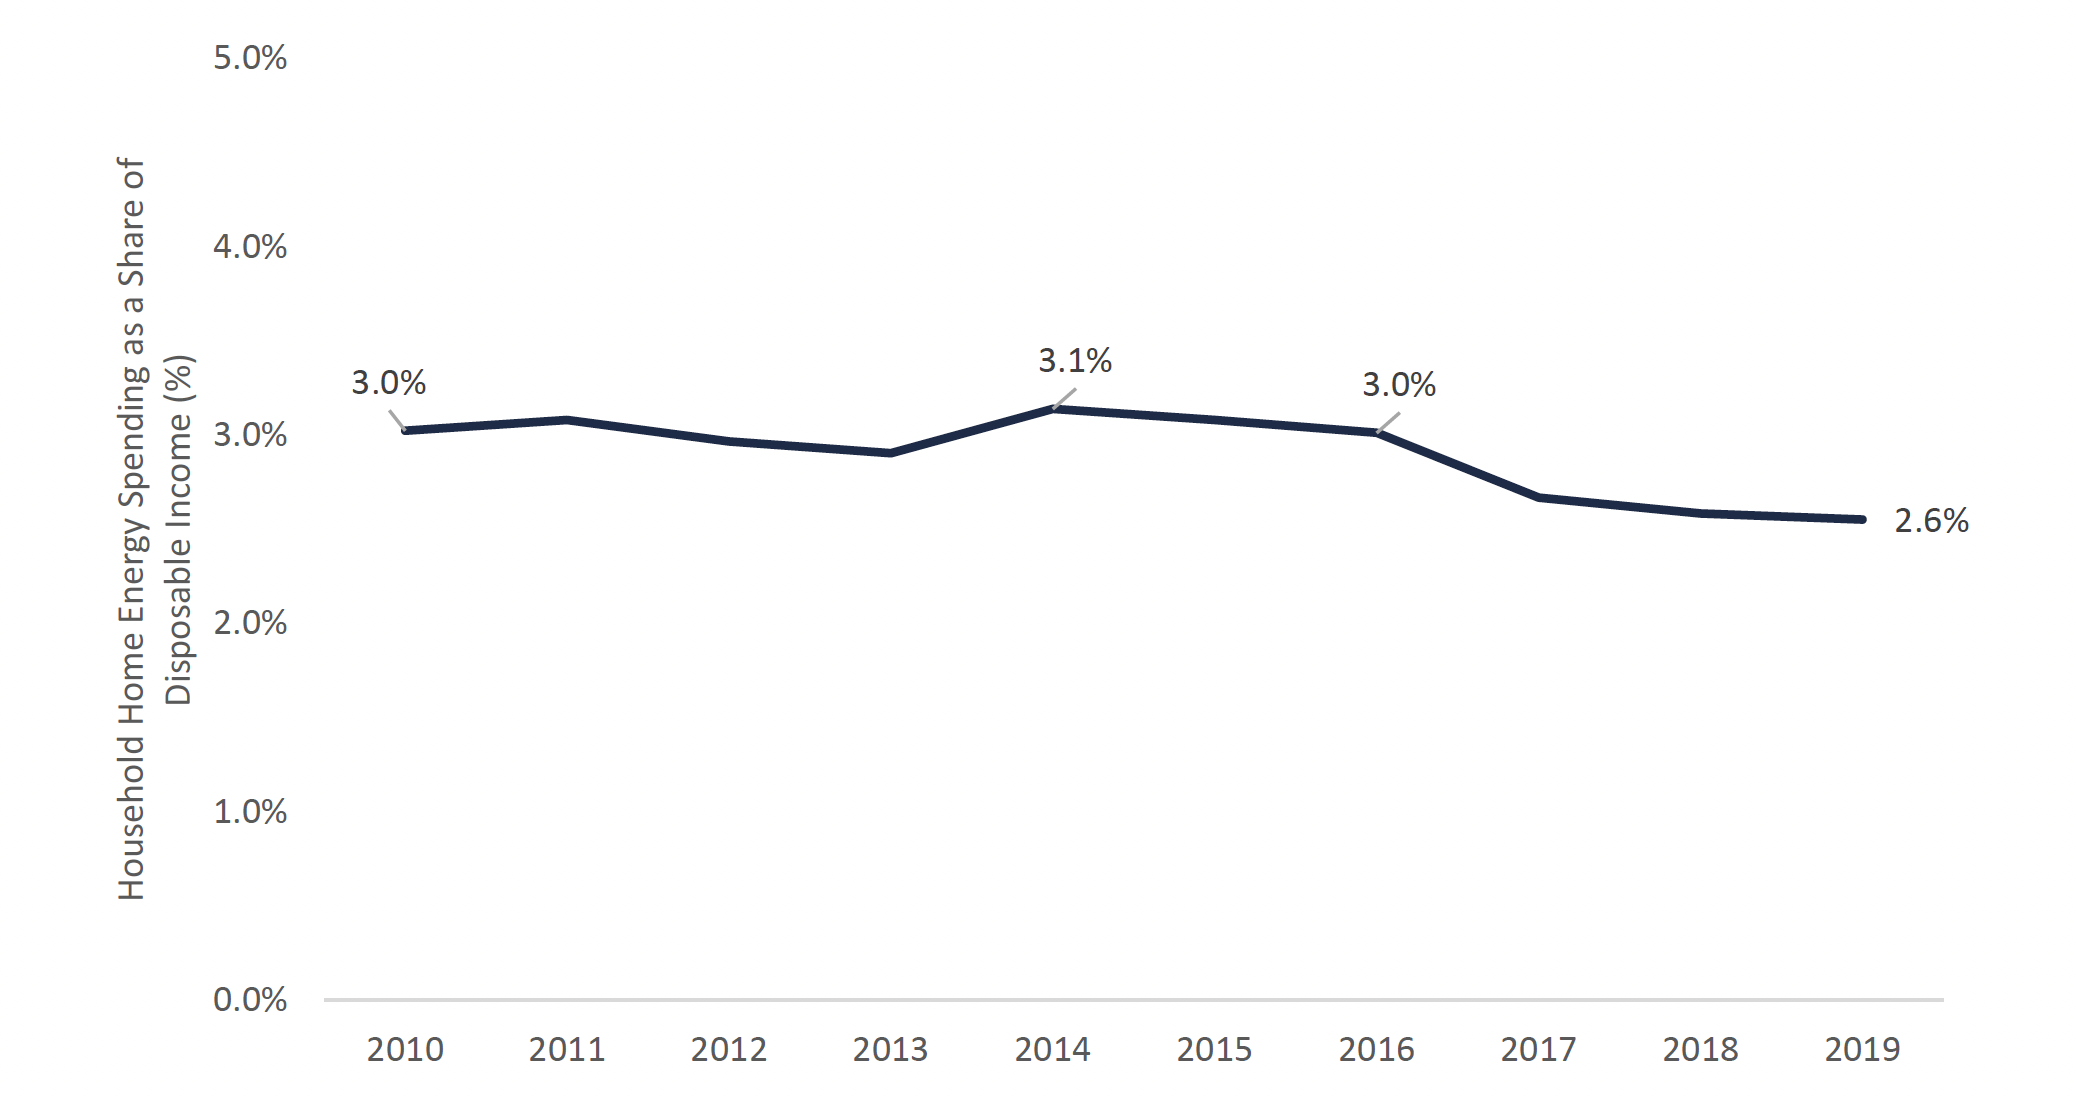
Source: FAO analysis of data from the Ontario Energy Board and Statistics Canada.
Accessible version
The figure is a line chart showing how much Ontario households spend on energy as a share of their disposable income. Ontario households spent 3.0% of their after-tax income on home energy in 2010; 3.1% in 2011; 3.0% in 2012; 2.9% in 2013; 3.1% in 2014; 3.1% in 2015; 3.0% in 2016; 2.7% in 2017; 2.6% in 2018; and 2.6% in 2019.
Comparing Home Energy Spending across Canada
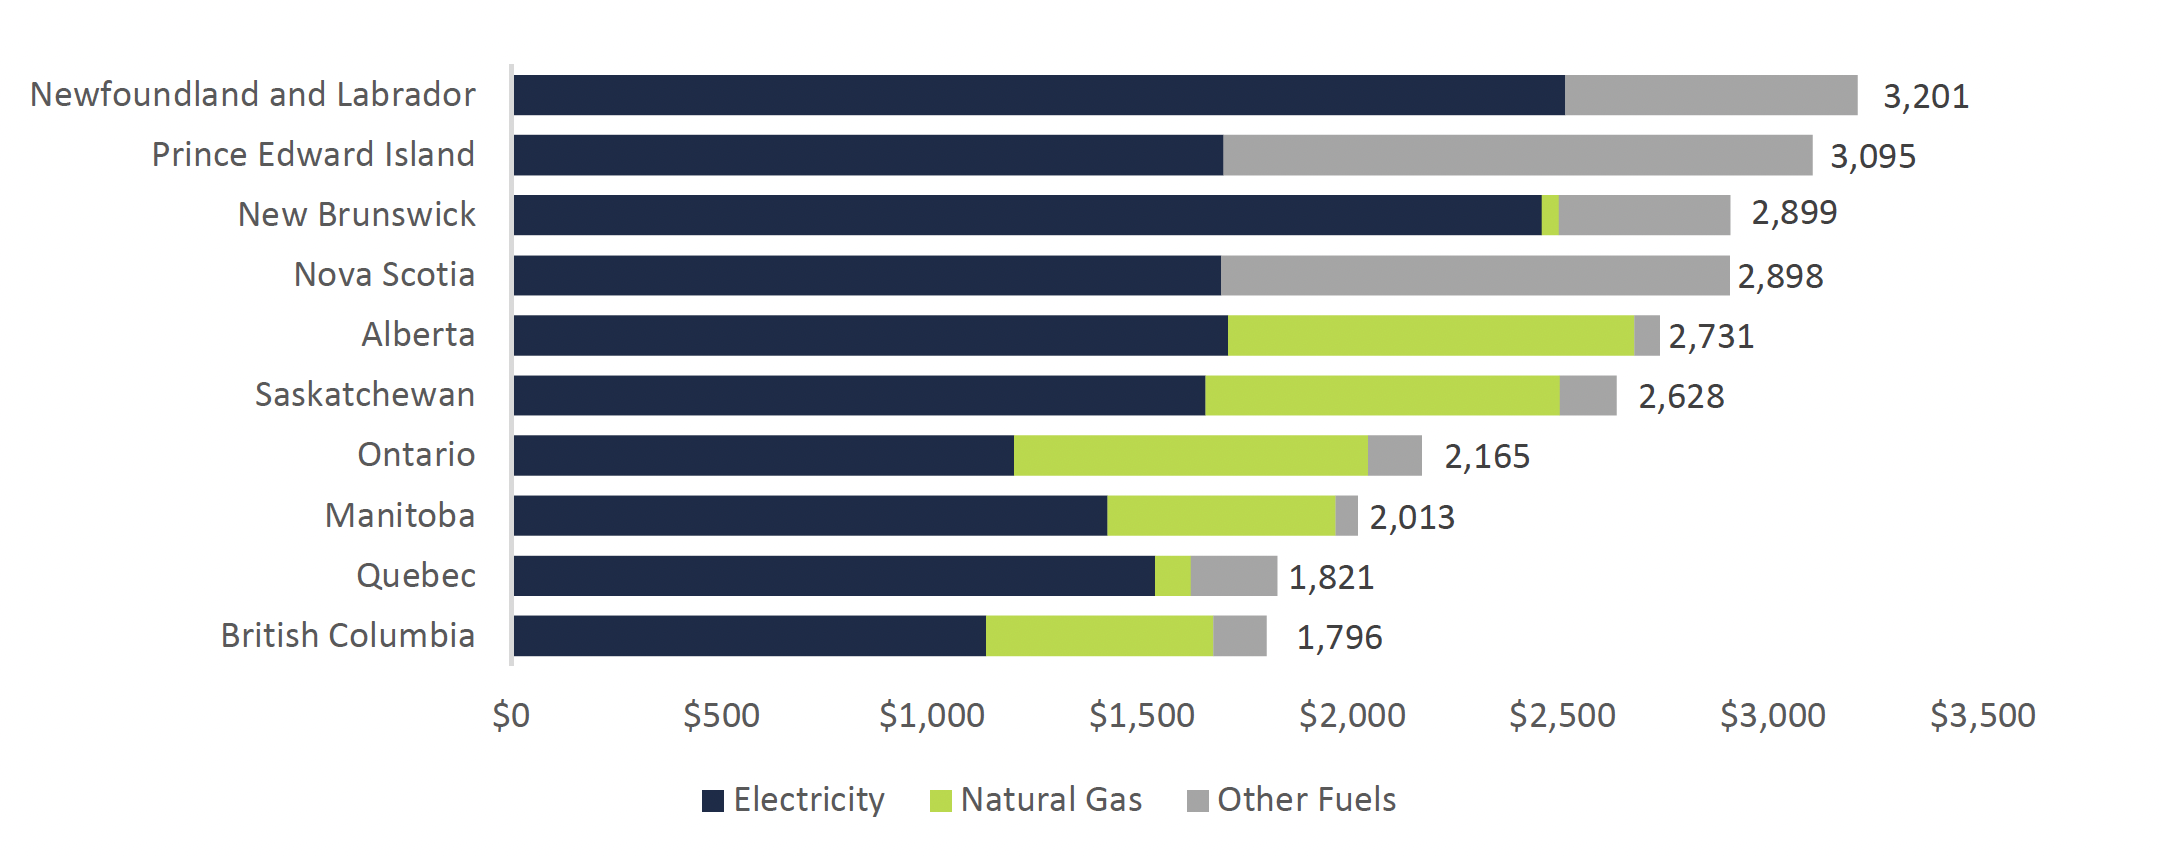
In 2019, the average Ontario household spent more on home energy than households in Manitoba, Quebec and British Columbia but less than households in the Atlantic Provinces, Saskatchewan and Alberta.
Average household home energy spending by province, 2019, ($)
Source: FAO analysis of data from the Ontario Energy Board and Statistics Canada.
Accessible version
The figure is a bar chart showing average household home energy spending by province in 2019. Ontario ranks seven out of ten provinces at $2,165. Going from highest to lowest, the other provinces spent: Newfoundland and Labrador, $3,201; Prince Edward Island, $3,095; New Brunswick, $2,899; Nova Scotia, $2,898; Alberta, $2,731; Saskatchewan, $2,628; Manitoba, $2,013; Quebec, $1,821; British Columbia, $1,796.
On average, households in the Atlantic Provinces spend the most on home energy due to a combination of relatively high electricity prices and their use of electricity and oil for home heating as opposed to more cost-effective natural gas. Households in Saskatchewan and Alberta spend less than households in Atlantic Canada, due to their use of natural gas for home heating, but spend more than households in Ontario, due to both higher electricity costs and energy use. Ontario households have the fourth lowest home energy spending due to a combination of cheaper electricity prices than in Saskatchewan, Alberta and Atlantic Canada and higher use of natural gas for home heating. Finally, British Columbia, Manitoba and Quebec households have the lowest home energy spending in Canada due primarily to their access to an abundance of low-cost hydroelectricity.
Change in Home Energy Spending by Province, 2010 to 2019
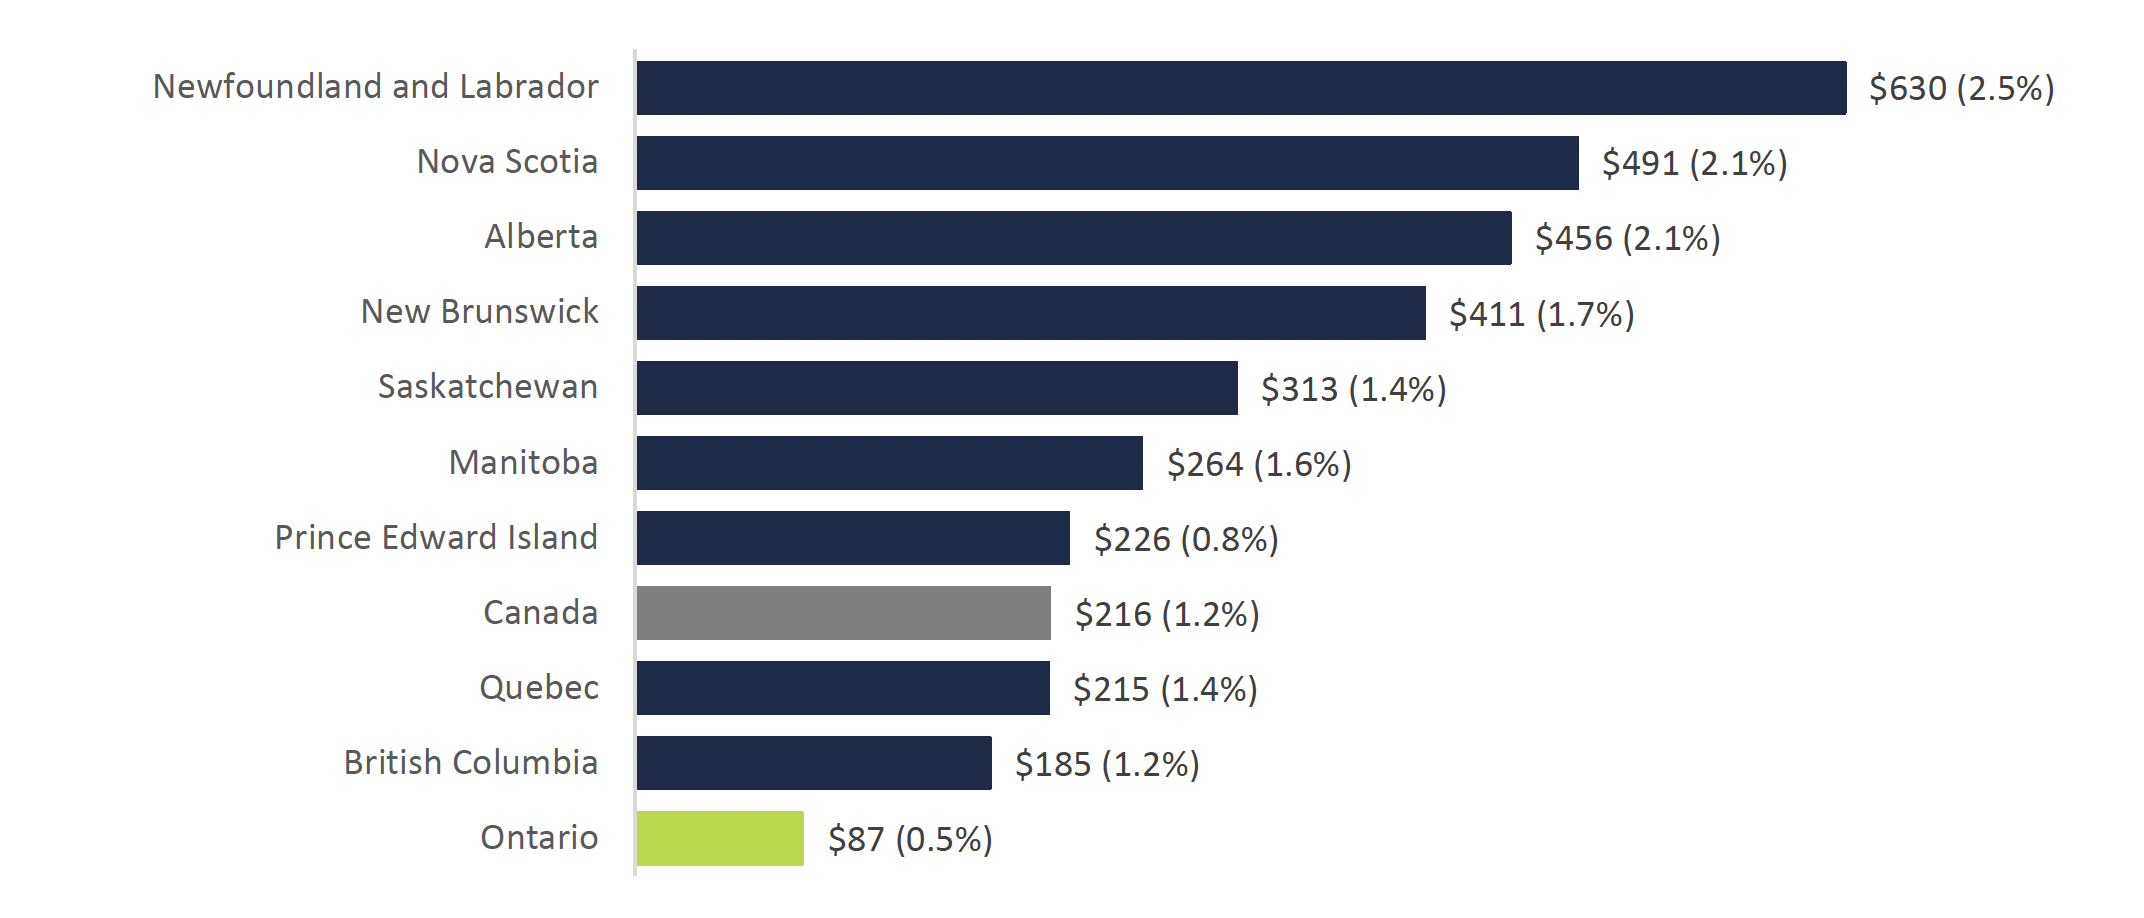
Since 2010, Ontario households have experienced the smallest increase in home energy spending among all the provinces. Between 2010 and 2019, average annual home energy spending in Ontario increased by $87 (0.5 per cent average annual growth).[9] This increase was significantly lower than all other provinces, which ranged from $185 in British Columbia (1.2 per cent average annual growth) to a high of $630 (2.5 per cent average annual growth) in Newfoundland and Labrador.
Including all households in Canada, average annual home energy spending increased by $216, or 1.2 per cent per year. Ontario, Quebec and British Columbia were the only provinces where home energy spending increased less than the Canadian average.
Change in average annual household home energy spending by province, 2010 to 2019, (average annual change)
Note: Canada is a weighted average based on the number of households in each province.
Source: FAO analysis of data from the Ontario Energy Board and Statistics Canada.
Accessible version
The figure is a bar chart showing the change in home energy spending by province from 2010 to 2019. Home energy spending by Ontario households increased by $87, 0.5% average annual growth, from 2010 to 2019. This is the lowest of all the provinces and less than half the Canadian average. Going from highest to lowest, the other province spent: Newfoundland and Labrador $630, 2.5% growth; Nova Scotia $491, 2.1%; Alberta $456, 2.1%; New Brunswick $411, 1.7%; Saskatchewan $313, 1.4%; Manitoba $264, 1.6%; Prince Edward Island $226, 0.8%; Canada average $216, 1.2%; Quebec $215, 1.4%; British Columbia $185, 1.2%.
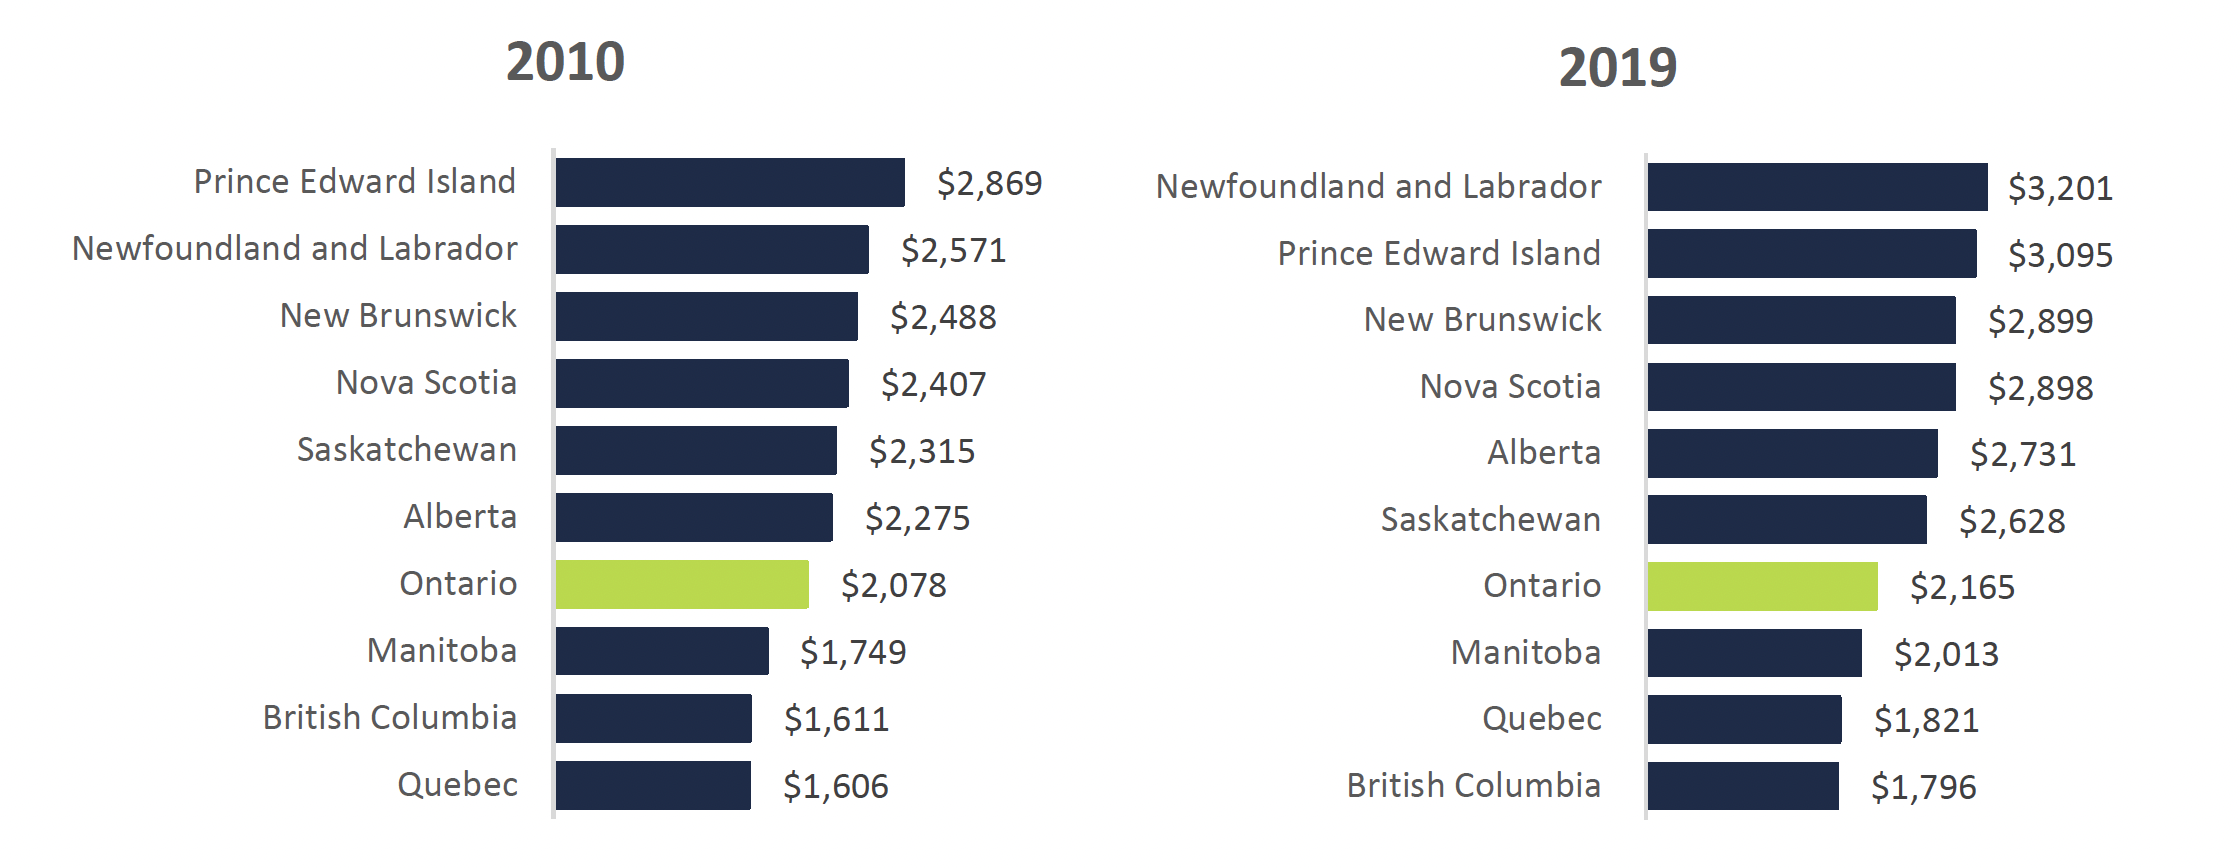
The following charts show average household home energy spending by province in 2010 and 2019.
Average household home energy spending by province, 2010 and 2019
Source: FAO analysis of data from the Ontario Energy Board and Statistics Canada.
Accessible version
The figure is two bar charts. One shows average household energy spending by province in 2010. The other shows average household spending by province in 2019. In 2010, Ontario ranked seventh out of ten provinces with average home energy spending of $2,078. In 2019, Ontario remained seventh out of ten provinces with average home energy spending of $2,165. In 2010, from highest to lowest, the other provinces spent: Prince Edward Island, $2,869; Newfoundland and Labrador, $2,571; New Brunswick $2,488; Nova Scotia $2,407; Saskatchewan $2,315; Alberta $2,275, Manitoba $1,749, British Columbia $1,611; Quebec $1,606. In 2019, from highest to lowest, the other provinces spent: Newfoundland and Labrador $3,201; Prince Edward Island $3,095; New Brunswick $2,899; Nova Scotia $2,898; Alberta$2,731; Saskatchewan $2,628; Manitoba $2,013; Quebec $1,821; British Columbia $1,796.
Footnotes
[1] Home energy spending excludes spending on transportation fuel.
[2] Average residential electricity use in Ontario declined from 785 kWh per month in 2010 to 708 kWh per month in 2016.
[3] The price most Ontario households pay for the generation portion of their electricity bills increased from $62/MWh in 2010 to $112/MWh in 2016.
[4] For more information on the Fair Hydro Plan, see FAO, “Fair Hydro Plan: An Assessment of the Fiscal Impact of the Province’s Fair Hydro Plan,” 2017. In November of 2019, the Fair Hydro Plan was replaced by the Ontario Electricity Rebate which, as of the writing of this report, also provides a rebate that holds annual residential electricity bill increases to the rate of inflation.
[5] Estimate includes the Ontario Electricity Rebate, which replaced the Fair Hydro Plan in November of 2019.
[6] In addition, the Province spent approximately $0.9 billion in 2019 under the Fair Hydro Plan to support non-residential electricity customers.
[7] Carbon pricing also has a minor impact on the cost of electricity.
[8] In the FAO’s report “Cap and Trade: A Financial Review of the Decision to Cancel the Cap and Trade Program,” 2018, the FAO estimated the cost of the carbon tax to a typical Ontario household would be $258 in 2019, of which $86 was related to home heating fuel consumption. The main difference between the FAO’s previous estimate of $86 and the updated estimate for 2019 of $46 is that the carbon tax came into effect on April 1, 2019, rather than January 1, 2019.
[9] Without the electricity cost subsidies from the Ontario Clean Energy Benefit and the Fair Hydro Plan, average annual Ontario household home energy spending would have increased by $623 (3.0 per cent average annual growth) from 2010 to 2019.