


Historical Trends, Projections and Risks
1. Summary
- This report analyzes Ontario Public Sector employment and compensation.[1] The report provides an overview of public sector employment in Ontario, discusses upcoming collective bargaining negotiations and the application of wage restraint under Bill 124,[2] projects provincial spending on employee compensation over the next five years, and discusses three key risks to this projection: inflation, the court challenge to Bill 124 and staffing shortages.
Number of Ontario Public Sector Employees
- In 2021, there were 6.3 million paid workers in Ontario.[3] Of these employees, the FAO estimates that 4.8 million (75 per cent) worked in the private sector, while 1.6 million (25 per cent) worked in the federal, provincial and municipal public sectors.
- The 1.6 million public sector workers consist of 654,641 workers in the Ontario Public Sector, 520,989 workers in other provincially supported organizations (such as long-term care homes, universities and child care centres), 225,597 municipal government workers, and 160,073 federal government workers in Ontario. Table 1 of this report provides an overview of paid workers in Ontario.
- This report focuses on the 654,641 Ontario Public Sector employees, which represents 10 per cent of total paid workers in Ontario.[4] These consist of 236,584 workers in hospitals, 285,859 workers in school boards, 46,224 workers in colleges, and 85,974 workers in Ontario ministries and agencies.
Trends in Ontario Public Sector Employment Levels
- Over the 10-year period from 2011 to 2021, Ontario Public Sector employment has grown by 66,498 workers, representing average annual growth of 1.1 per cent. This growth rate was less than the average annual growth rate for all public sector workers in Ontario (1.4 per cent) but higher than the growth rate for Ontario private sector workers (0.9 per cent).
- By category, from 2011 to 2019, employment grew in hospitals, school boards, colleges, and Ontario ministries and agencies, with the smallest average annual percentage increase in hospitals (1.2 per cent) and the highest in colleges (3.4 per cent). In 2020, as a result of the COVID-19 pandemic, only employment in hospitals increased (1.7 per cent), while employment in school boards, colleges, and Ontario ministries and agencies all experienced sharp declines. In 2021, employment increased in all Ontario Public Sector categories, with the largest percentage increase in hospitals (4.9 per cent) and the smallest increase in Ontario ministries and agencies (1.3 per cent).
Trends in Wage Levels
- The FAO estimates that the average annual salary in 2021 for an Ontario Public Sector employee was $69,259, which is higher than the average annual salary for employees in other provincially supported organizations ($50,970) but below the average annual salaries for municipal government employees ($70,418) and federal government employees in Ontario ($89,574).
- Over the 10-year period from 2011 to 2021, the average annual salary for Ontario Public Sector employees increased by $10,385 (or 1.6 per cent on average annually). This rate of increase was lower than the rate of inflation, which averaged 1.8 per cent per year over the same period. Wage increases for Ontario Public Sector employees were also lower than wage increases for federal government employees in Ontario (1.8 per cent), employees of other provincially supported organizations (2.7 per cent), and municipal government employees (3.9 per cent).
Ontario Public Sector Collective Bargaining
- The FAO estimates that in 2021, 534,544 Ontario Public Sector workers were part of a labour union (about 82 per cent of all Ontario Public Sector employees).
- In 2020 and 2021, settlements for base salary increases for Ontario Public Sector unionized employees averaged 1.0 per cent, due to the application of provincial wage restraint legislation (Bill 124) that was enacted in 2019. Bill 124 limits base salary increases to one per cent per year, for a period of three years, for Ontario Public Sector employees as well as some employees of other provincially supported organizations.
- The 1.0 per cent rate of increase for Ontario Public Sector employees was less than settlements in the federal government (2.0 per cent), municipal government (1.6 per cent) and the private sector (1.8 per cent).
Upcoming Collective Bargaining Negotiations and the Application of Bill 124
- Combined, in 2021 and 2022, the collective agreements of an estimated 522,147 employees have expired or are expiring. As of the writing of this report, the FAO estimates that new collective agreements for 99,062 of these employees have been signed, while collective agreements for the remaining 423,085 employees are under negotiation (mainly employees of school boards and hospitals).
- The FAO estimates that 375,273 (70 per cent) unionized Ontario Public Sector employees have either completed or are under an existing collective bargaining agreement subject to wage restraint under Bill 124. These consist of 258,379 school board employees, 79,824 hospital employees, 28,371 employees of Ontario ministries and agencies, and 8,699 college employees.
- Consequently, as of the writing of this report, the FAO estimates that 159,271 (30 per cent) unionized Ontario Public Sector employees are currently in the process of negotiating, or will soon be negotiating, collective bargaining agreements that will be subject to three years of wage restraint under Bill 124. These consist of 103,437 hospital employees, 33,822 employees of Ontario ministries and agencies, and 22,012 college employees.
Provincial Spending on Ontario Public Sector Compensation
- In 2021-22, the FAO estimates that the Ontario government spent $48.2 billion on the salaries and wages (excluding pensions and benefits) of Ontario Public Sector employees.[5] This includes $19.1 billion for the wages of school board employees, $18.2 billion for hospital employees, $8.3 billion for the employees of Ontario ministries and agencies, and $2.6 billion for the wages of college employees.
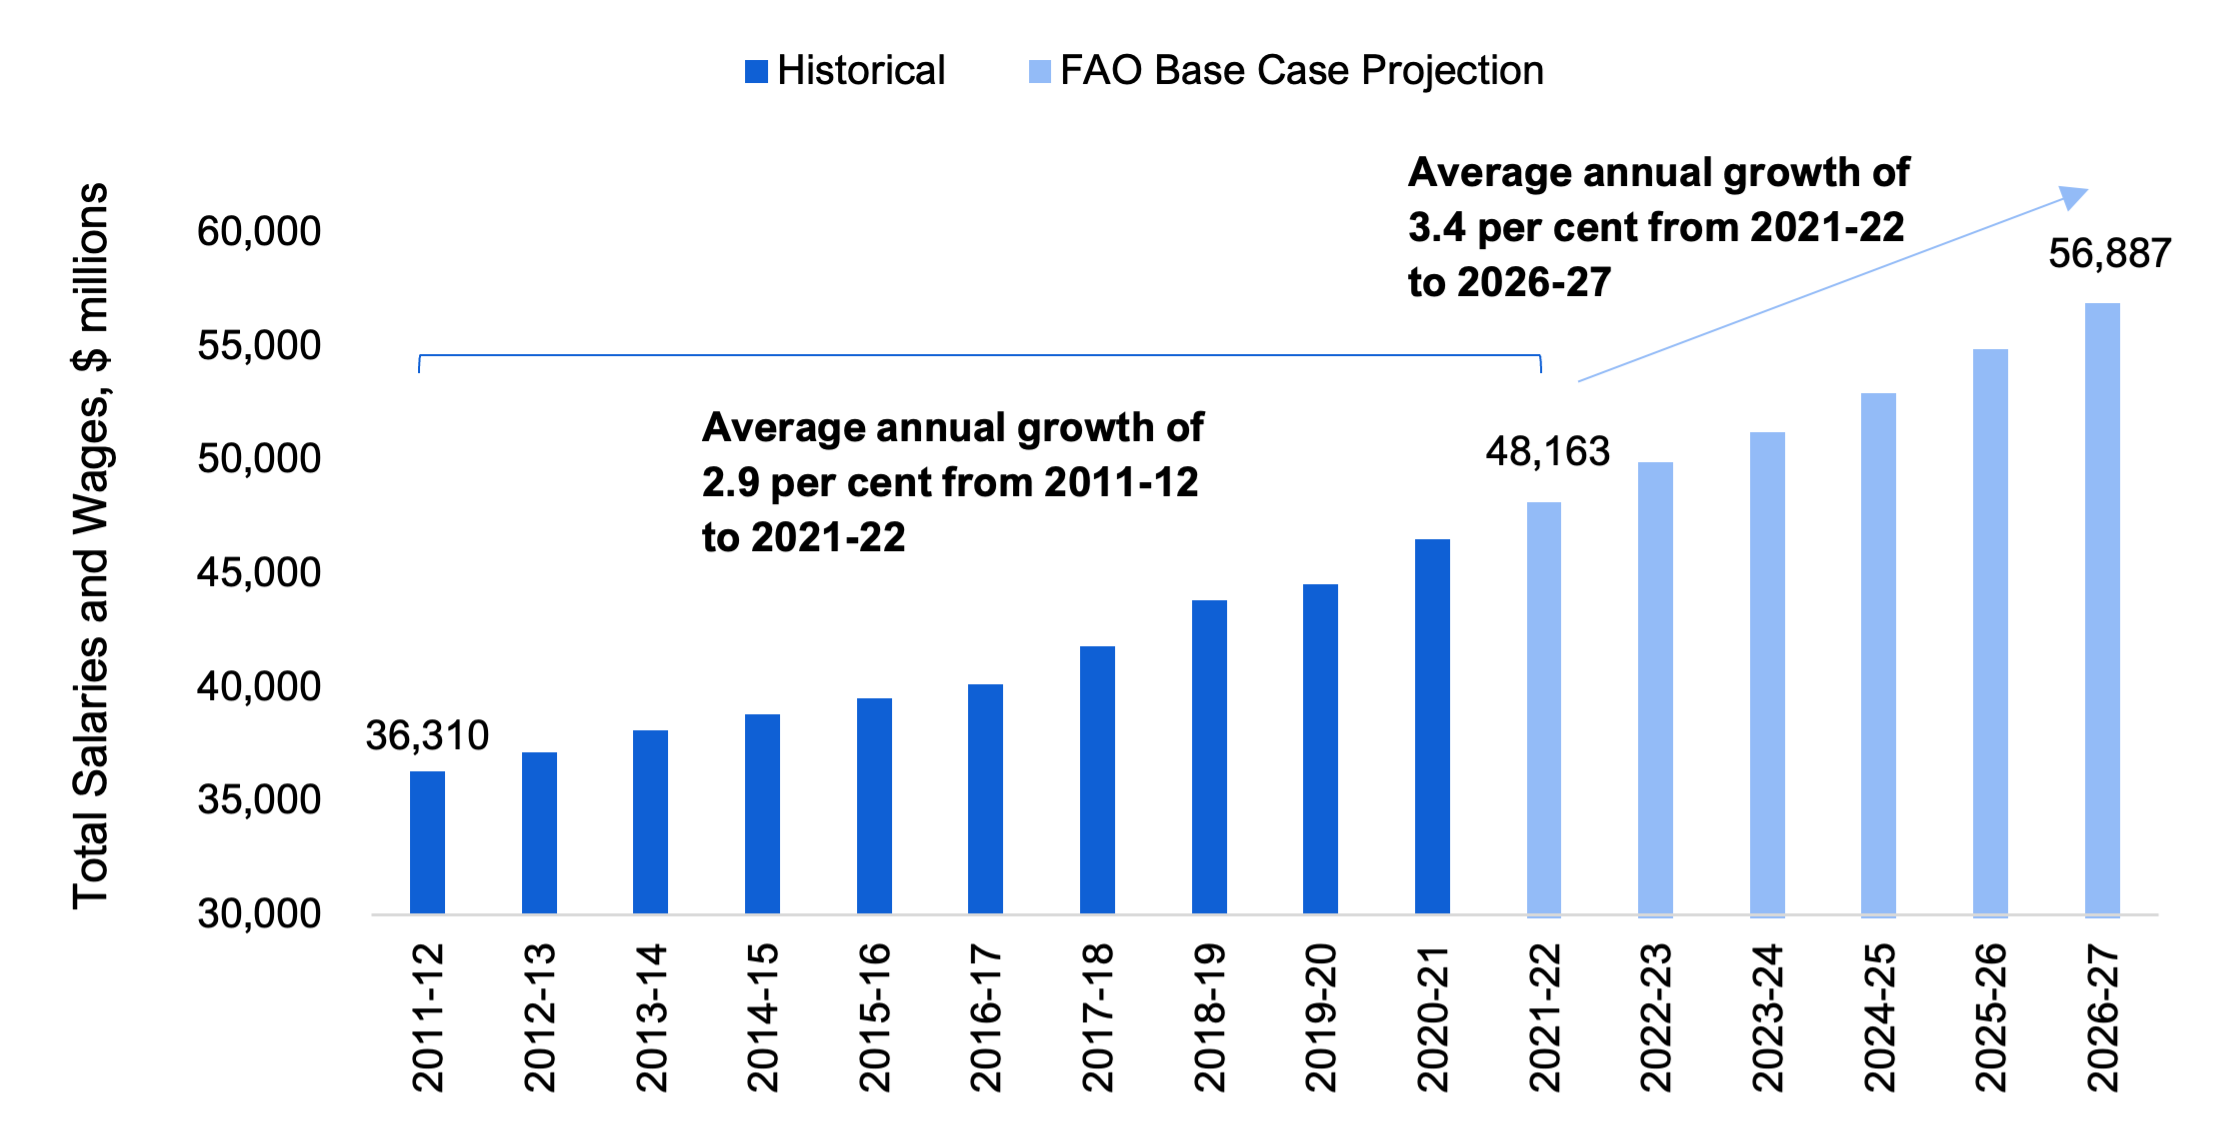
- Ontario’s total salaries and wages spending has grown from an estimated $36.3 billion in 2011-12 to $48.2 billion in 2021-22, representing average annual growth of 2.9 per cent.
- Looking forward, the FAO estimates that the Province’s spending on salaries and wages for Ontario Public Sector employees will reach $56.9 billion by 2026-27, representing an average annual growth rate of 3.4 per cent over the five-year period. This forecast is the FAO’s “base case” projection, which assumes that:
- the Province will add a total of 56,974 Ontario Public Sector workers by 2026-27, representing average annual growth of 1.7 per cent, to support existing government programs and meet new/expanded program commitments;[6] and
- wages will grow at an annual average of 1.7 per cent, consistent with existing collective agreements and, for new collective agreements, either the wage restraint terms under Bill 124, if applicable, or historical long-term average growth in wages.
- Importantly, the FAO costed the impact of Bill 124 and estimated that it will save the Province a cumulative total of $9.7 billion in salaries and wages costs for both unionized and non-unionized Ontario Public Sector employees from the introduction of Bill 124 in 2019 through to 2026-27.
Risks to the FAO’s Base Case Projection
- The FAO’s base case projection for provincial spending on Ontario Public Sector employee salaries and wages reflects the FAO’s assumptions for the growth in the number of employees and wages as noted above and detailed in this report. Importantly, the FAO has identified three notable risks to the FAO’s base case projection: inflation, a court challenge to Bill 124 and staffing shortages.
Risk 1: Inflation Could Lead to Higher Wage Increases
- For the three-year period from 2021-22 to 2023-24, the FAO projects that inflation will average 4.6 per cent per year,[7] compared to a historical average of 1.9 per cent per year. This means that from 2021-22 to 2023-24, under the FAO’s base case projection, average salary growth for Ontario Public Sector employees is projected to significantly lag behind inflation, resulting in a cumulative 11.3 per cent decline in real wages over three years.
- Given the forecast for elevated inflation, there is the potential for above-average wage settlements for upcoming Ontario Public Sector collective agreements. Consequently, the FAO developed a scenario in which, for upcoming collective agreements that are no longer subject to wage restraint under Bill 124, Ontario Public Sector employees receive wage increases that are 1.7 percentage points above historical trends for a three-year period, followed by a return to wage increases consistent with long-term trends. This adjustment is based on the inflation adjustment observed to date for unionized private sector employees in 2022.[8]
- Under this inflation adjustment scenario, the FAO estimates that spending on Ontario Public Sector employee salaries and wages would be $2.4 billion higher in 2026-27, compared to the FAO’s base case projection. Over the entire five-year period to 2026-27, total cumulative spending would be $6.8 billion higher.
Risk 2: Successful Court Challenge to Bill 124 Could Lead to Higher Spending on Salaries and Wages
- In response to the passage of Bill 124, a coalition of over 40 Ontario unions representing approximately 270,000 employees launched a lawsuit to repeal the legislation on the basis that it infringed on their rights to associate and collectively bargain as guaranteed under the Canadian Charter of Rights and Freedoms.
- Given the potential cost to the Province if this lawsuit is successful, the FAO developed a Bill 124 challenge scenario in which Ontario Public Sector unionized employees are compensated for Bill 124 wage growth restrictions that have applied since 2019 and, going forward, wage restraint under Bill 124 would no longer apply.[9]
- Based on the assumptions underlying this scenario, if the lawsuit is successful, the FAO estimates that provincial spending on Ontario Public Sector employee salaries and wages would increase by a cumulative total of $8.4 billion[10] over the five-year period from 2022-23 to 2026-27.[11]
Risk 3: Staffing Shortages Could Lead to Reduced Service Levels and Higher Wage Increases
- Vacancy rates, or the number of vacant jobs as a share of total jobs (occupied and vacant), have risen across most public and private sector job categories. In the Ontario Public Sector, this challenge is most pronounced in the health sector, where the vacancy rate has nearly doubled since 2019.
- High vacancy rates can result in staff shortages and impact public services. For example, the Ontario Nurses’ Association reported that over the August long weekend, about 25 hospitals in Ontario were forced to scale back sections of their facilities due to staff shortages.[12]
- In addition to the immediate challenges caused by high job vacancy rates, the FAO estimates that the Province will need to increase Ontario Public Sector staffing levels by an estimated 56,974 employees by 2026-27 to maintain existing programs and meet expansion commitments in hospitals.[13] Furthermore, outside of the Ontario Public Sector, the Province has made significant program expansion commitments in long-term care, home care and child care[14] that will require an estimated 81,695 additional employees to be hired by other provincially supported organizations by 2026-27.
- The Province has implemented a number of measures to fill vacant positions and meet new staffing needs, including investing in skills development programs, seeking foreign-trained workers and recognizing foreign credentials, increasing wages, and temporarily filling vacant positions through employment agencies (see section 6 for more details).
- However, the Province may still need to increase wages beyond the assumptions in the FAO’s base case projection to ensure sufficient staffing to maintain existing public services and meet program expansion commitments.
2. Introduction
This report analyzes public sector employment and compensation[15] in Ontario. The report provides an overview of public sector employment in Ontario, projects provincial spending on employee compensation over the next five years, and discusses three key risks to this projection: inflation, the court challenge to Bill 124[16] and staffing shortages.
This report is divided into the following sections:
- Section 3 reviews public sector employment in Ontario, including trends in employment levels and wages for hospitals, school boards, colleges, and Ontario ministries and agencies (collectively referred to as the Ontario Public Sector).
- Section 4 reviews the number of unionized Ontario Public Sector employees, wage settlements for recently concluded collective agreements, and the timing for upcoming collective agreement negotiations. This section also identifies how many unionized employees have entered into collective agreements that were under Bill 124 wage restraint and how many unionized employees have yet to enter into collective agreements under Bill 124 wage restraint.
- Section 5 discusses the FAO’s base case projection for spending by the Government of Ontario (the “Province”) on Ontario Public Sector employee compensation, including assumptions for employment increases and wage growth.
- Section 6 reviews three key risks to the FAO’s base case projection: above-average inflation, the court challenge to Bill 124, and rising vacancy rates and staffing shortages.
- Finally, section 7 contains information on the development of this report, including data sources and methodology.
3. Ontario Public Sector Employment
Number of Employees
In 2021, there were 6.3 million paid workers in Ontario.[17] Of these employees, 4.8 million (75 per cent) work in the private sector, while 1.6 million (25 per cent) work in the federal, provincial and municipal public sectors.
Figure 1: Paid workers in Ontario in 2021
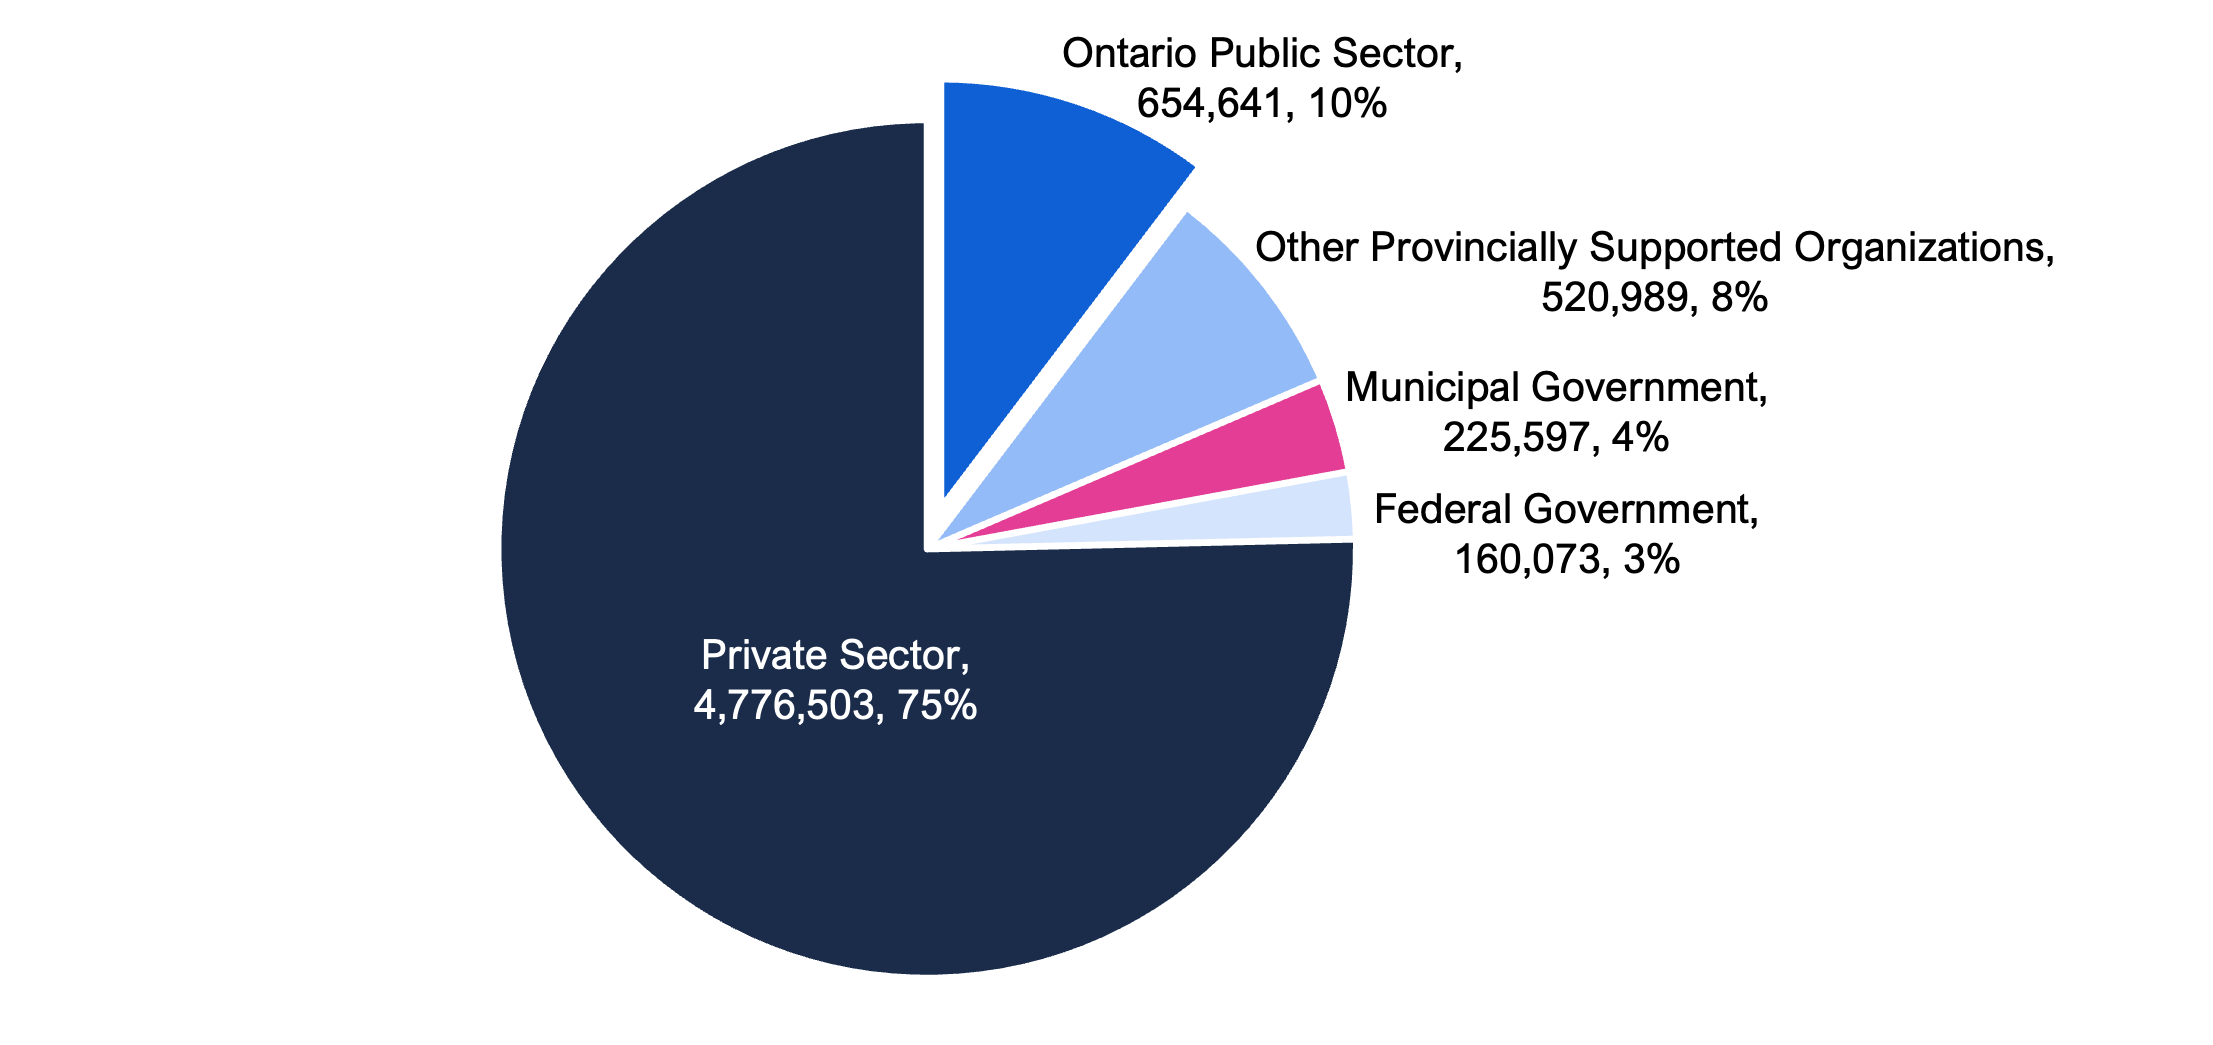
Note: Excludes 1.1 million self-employed Ontarians.
Source: FAO analysis of Statistics Canada’s Survey of Employee, Payroll and Hours (SEPH).
The FAO estimates that there were 654,641 Ontario Public Sector workers in 2021, representing approximately 10 per cent of total paid workers in Ontario. This includes 236,584 workers in hospitals, 285,859 workers in school boards, 46,224 workers in colleges, and 85,974 workers in Ontario ministries and agencies. The FAO refers to these workers as Ontario Public Sector employees, as they are employed either directly by Ontario ministries or agencies, or by entities (hospitals, school boards and colleges) that are financially controlled by the Province.[18]
Outside of the Ontario Public Sector, there are an estimated 520,989 employees in other provincially supported organizations, representing approximately eight per cent of total paid workers in Ontario. This includes employees in Ontario’s universities, nursing and other residential care facilities (including long-term care homes), other health care categories (including doctors’ offices and home care), child care centres and children’s aid societies. These organizations receive significant funding from the Ontario government but are not considered to be financially controlled by the Province.[19]
It is common to combine the Ontario Public Sector and the other provincially supported organizations into a larger group, known as the Ontario Broader Public Sector. Based on the FAO’s analysis and categorization, in 2021, there were 1,175,630 employees in the Ontario Broader Public Sector, representing 19 per cent of total paid workers in Ontario.
The municipal and federal levels of government also employ a significant number of workers in Ontario. In 2021, municipalities in Ontario employed 225,597 workers (four per cent) across a variety of sectors, including transit, waste management, social assistance and public safety. The federal government employed 160,073 workers (three per cent) in Ontario, mostly in defence and protective services, immigration services, and other administration.
Table 1 provides additional information.
| Sector | Total Number of Employees | Portion of Total Ontario Paid Workers (%) |
Average Annual Growth Rate in Employees from 2011 to 2021 (%) |
|
|---|---|---|---|---|
| Hospitals | 236,584 | 3.7 | 1.6 | |
| School Boards | 285,859 | 4.5 | 0.7 | |
| Colleges | 46,224 | 0.7 | 1.6 | |
| Ontario Ministries and Agencies | 85,974 | 1.4 | 0.5 | |
| Ontario Public Sector | 654,641 | 10.3 | 1.1 | |
| Other Health Care (includes doctors’ offices, clinics and home care) | 186,853 | 2.9 | 3.0 | |
| Nursing and Residential Care (includes long-term care homes) | 156,325 | 2.5 | 1.0 | |
| Universities | 126,252 | 2.0 | 2.3 | |
| Child Care Centres | 44,310 | 0.7 | 2.2 | |
| Children’s Aid Societies | 7,249 | 0.1 | * | |
| Other Provincially Supported Organizations | 520,989 | 8.2 | 2.1 | |
| Ontario Broader Public Sector | 1,175,630 | 18.5 | 1.5 | |
| Federal Government (in Ontario) | 160,073 | 2.5 | 1.7 | |
| Municipal Government | 225,597 | 3.6 | 0.5 | |
| Total Public Sector | 1,561,300 | 24.6 | 1.4 | |
| Private Sector | 4,776,503 | 75.4 | 0.9 | |
| Total Paid Workers in Ontario in 2021 | 6,337,803 | 100.0 | 1.0 | |
Trends in Ontario Public Sector Employment Levels
Employment in the Ontario Public Sector was 654,641 in 2021. Since 2011, employment has grown by 66,498, representing average annual growth of 1.1 per cent. This growth rate was less than the average annual growth rate for all public sector workers in Ontario (1.4 per cent) but higher than the growth rate for Ontario private sector workers (0.9 per cent).
The 10-year employment increase of 66,498 includes an employment increase of 71,394 from 2011 to 2019, and an employment decrease of 4,896 from 2019 to 2021. Overall, employment in the Ontario Public Sector was 0.7 per cent lower in 2021 compared to 2019.
Figure 2: Ontario Public Sector employment from 2011 to 2021
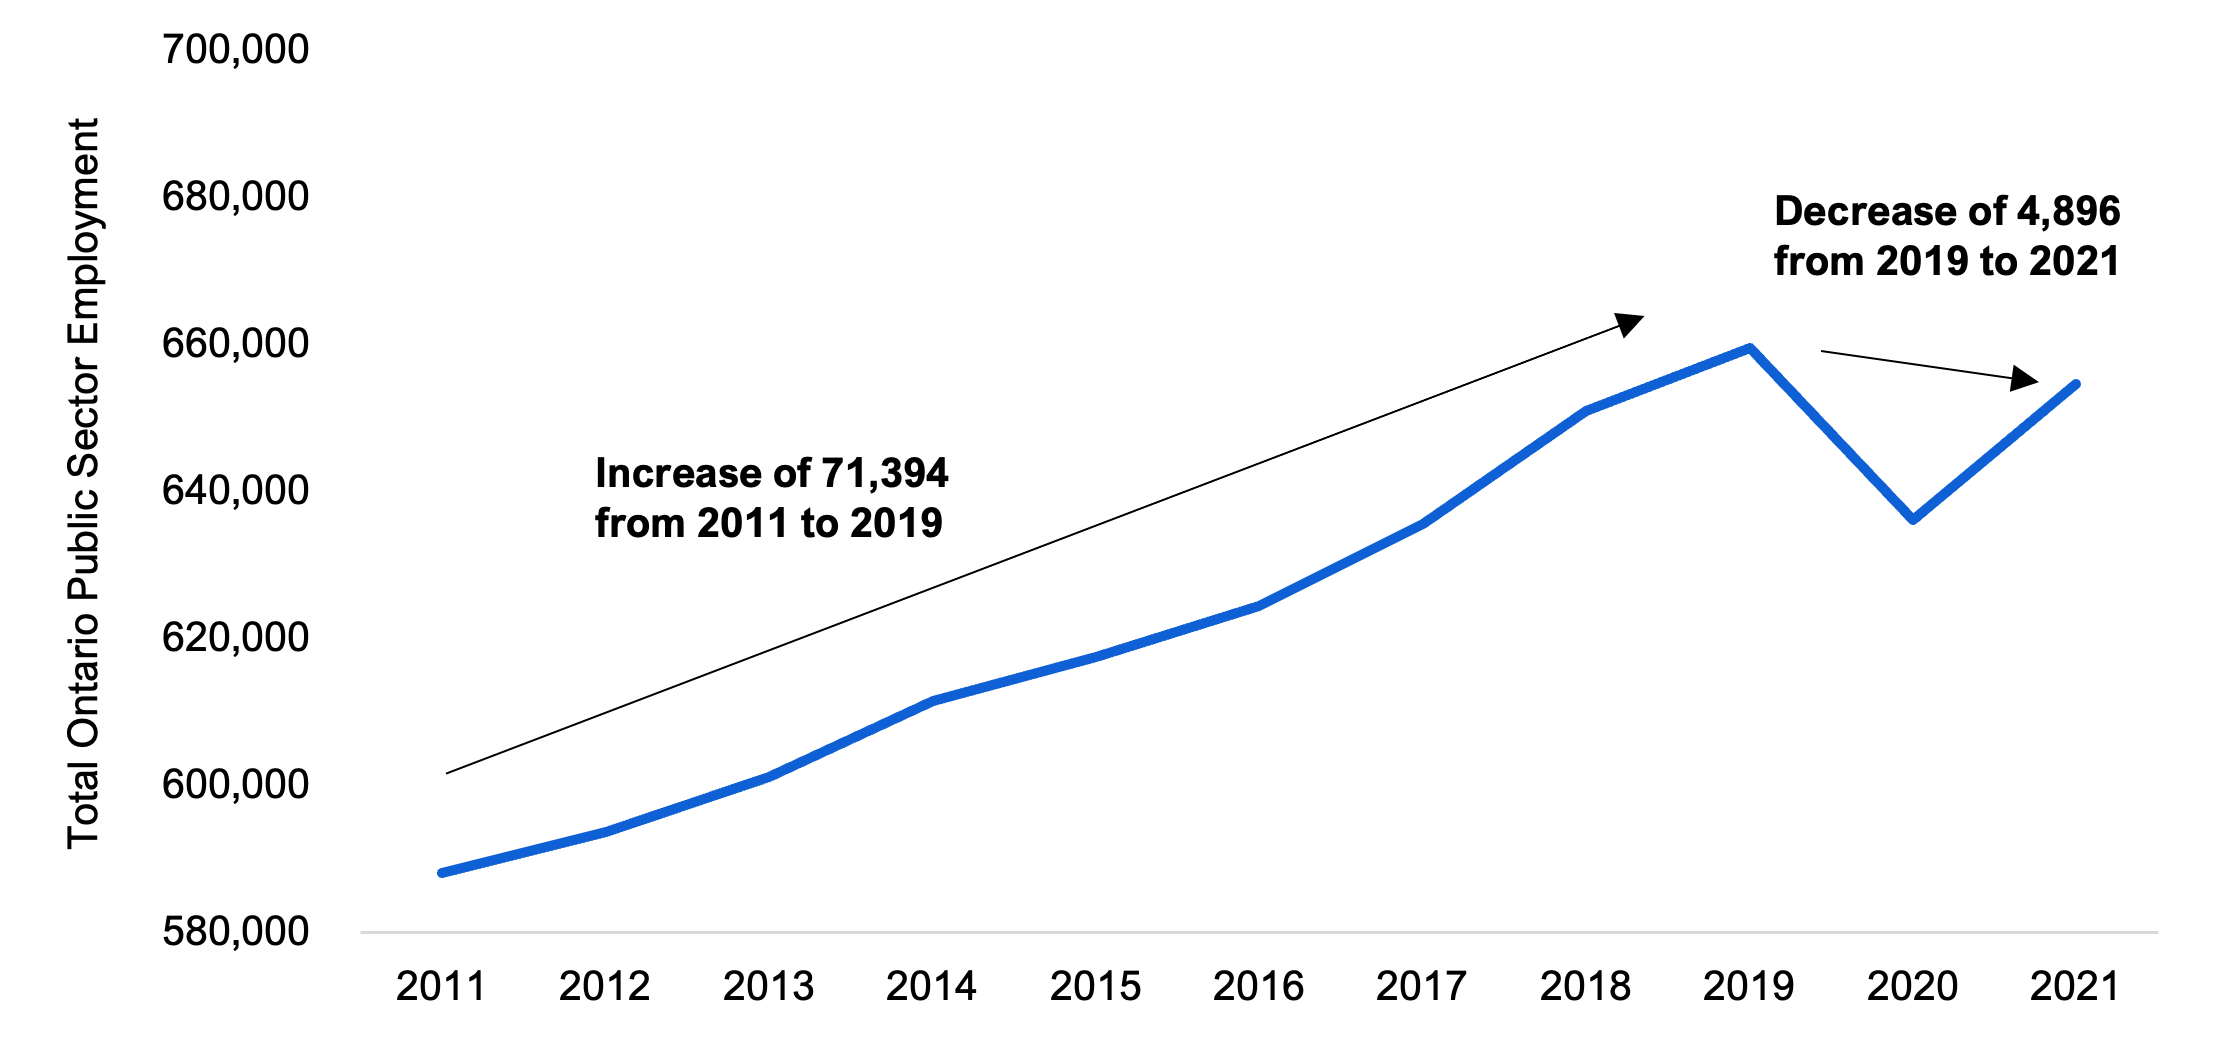
Source: FAO analysis of Statistics Canada’s Survey of Employee, Payroll and Hours (SEPH).
By Ontario Public Sector category, from 2011 to 2019, employment grew in hospitals, school boards, colleges, and Ontario ministries and agencies, with the smallest average annual percentage increase in hospitals at 1.2 per cent. However, in 2020, only employment in hospitals increased, while employment in school boards, colleges, and Ontario ministries and agencies experienced sharp declines. In 2021, employment increased in all Ontario Public Sector categories, with the largest percentage increase in hospitals (4.9 per cent).
Figure 3: Average annual change in Ontario Public Sector employment from 2011 to 2021, per cent
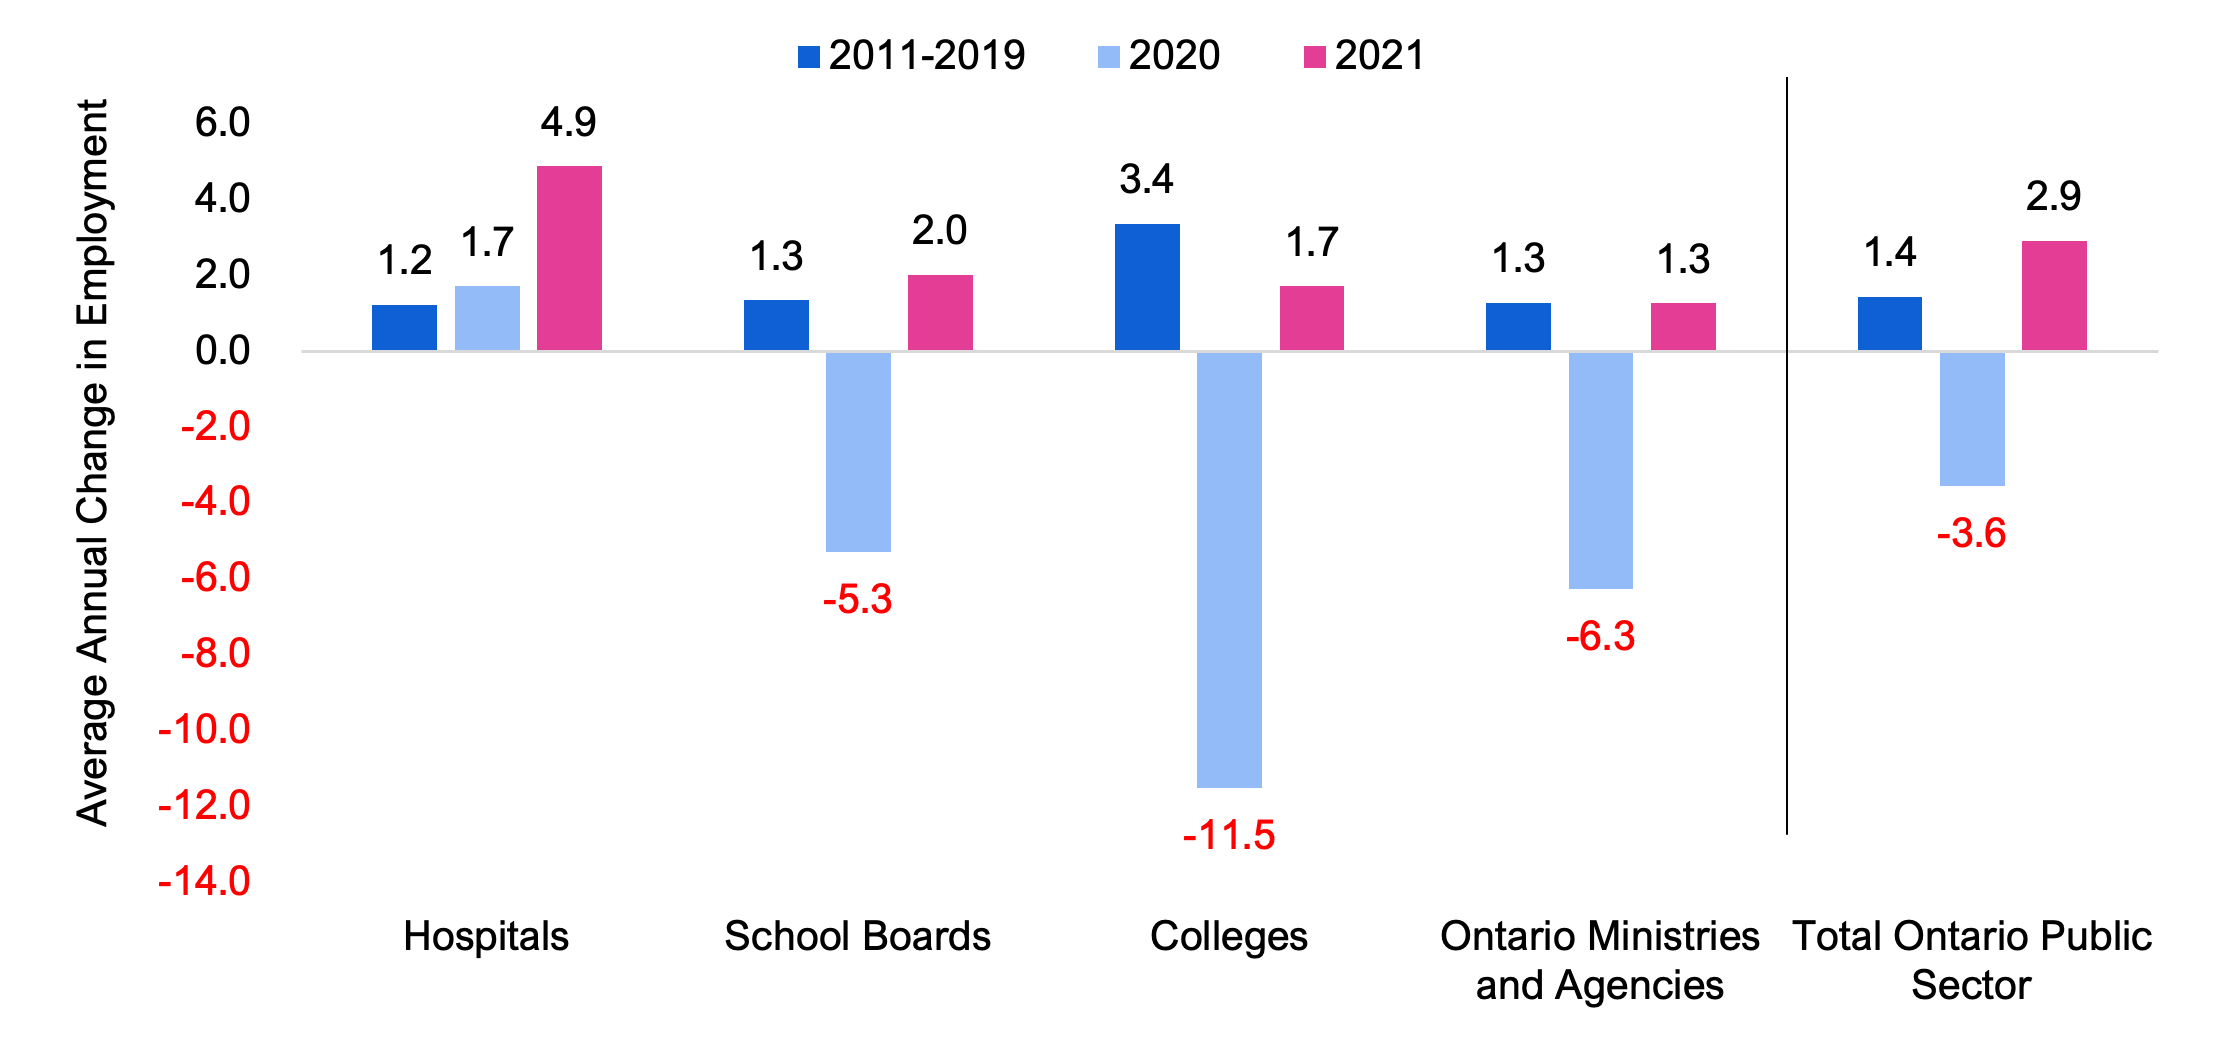
Source: FAO analysis of Statistics Canada’s Survey of Employee, Payroll and Hours (SEPH).
- Employment in hospitals increased over the entire 10-year period to 2021. From 2011 to 2019, employment levels grew at an average annual pace of 1.2 per cent. Annual hospital employment growth picked up to 1.7 per cent in 2020 and then 4.9 per cent in 2021, reflecting the response to the COVID-19 pandemic.
- From 2011 to 2019, employment levels in school boards increased by 1.3 per cent per year, on average. In 2020, school board employment declined by 5.3 per cent followed by a partial recovery of 2.0 per cent in 2021. This largely reflects the impact of the COVID-19 pandemic, which resulted in lower student enrolment and intermittent school closures in the 2020-21 and 2021-22 school years.
- From 2011 to 2019, employment levels in colleges increased by 3.4 per cent per year, highest among all Ontario Public Sector employment categories, driven by strong international student enrolment growth. In 2020, college employment declined by 11.5 per cent, due to the impact of lower student enrolment from the COVID-19 pandemic.[20] College employment experienced a limited recovery in 2021, with growth of 1.7 per cent.
- Employment in Ontario ministries and agencies experienced growth from 2011 to 2019, averaging 1.3 per cent per year. In 2020, employment declined by 6.3 per cent, followed by growth of 1.3 per cent in 2021.
Trends in Wage Levels
The FAO estimates that the average annual salary[21] in 2021 for an Ontario Public Sector employee was $69,259,[22] which is higher than the average annual salary for employees in other provincially supported organizations ($50,970) but below the average annual salaries for municipal government employees ($70,418) and federal government employees in Ontario ($89,574). Private sector employees earned an average of $59,123 in 2021.
In general, comparing average wage levels among different public and private sectors is not an accurate like-for-like comparison, due to compositional differences between employees in each of the categories. For example, the private sector average includes employment categories with skill sets that are not comparable, such as food services, accommodations and retail. A comparable analysis of public and private sector wages, which would take into account differences in education, experience and other compositional factors, is beyond the scope of this report.
Figure 4: Average annual salaries of paid workers in Ontario in 2011 and 2021
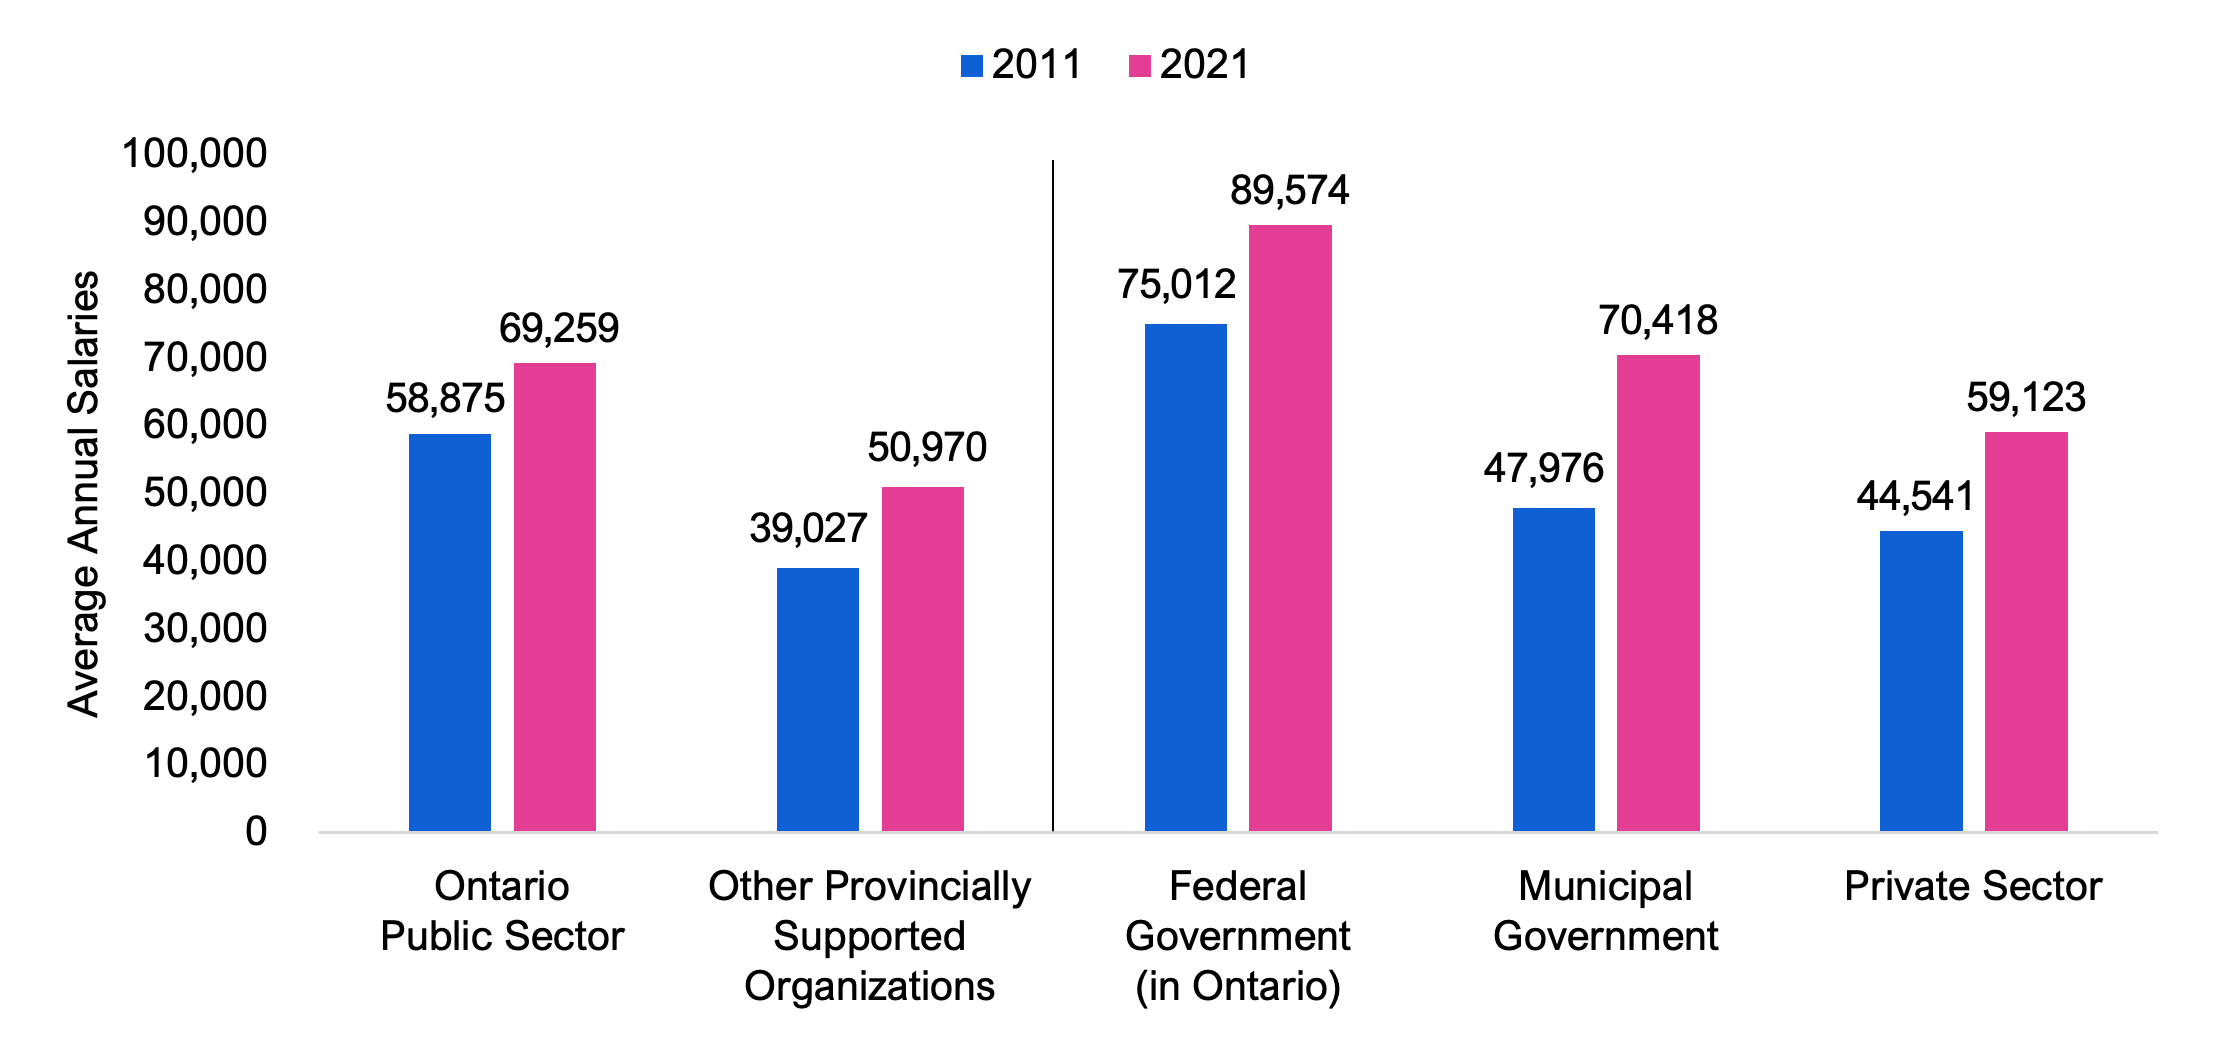
Note: Average annual salary is calculated using average weekly earnings (gross payrolls before deductions) from Statistics Canada Table 14-10-0204-01 and assumes 52 weekly earning periods in a year.
Source: FAO calculations from Statistics Canada’s Survey of Employee, Payroll and Hours (SEPH).
Since 2011, the average annual salary for Ontario Public Sector employees has increased[23] by $10,385 (or 1.6 per cent on average annually), which is the lowest across the sectors and lower than inflation, which averaged 1.8 per cent per year over this period.[24] In the public sector, this is followed by increases of $11,943 for employees of other provincially supported organizations (2.7 per cent annual growth), $14,562 for federal government employees in Ontario (1.8 per cent annual growth), and $22,442 for municipal government employees (3.9 per cent annual growth). In the private sector, the average annual employee salary increased by $14,582 (2.9 per cent annual growth).
4. Ontario Public Sector Collective Bargaining
Number of Unionized Employees
In 2021, an estimated 534,544 Ontario Public Sector workers were part of a labour union (about 82 per cent of all Ontario Public Sector employees).[25]
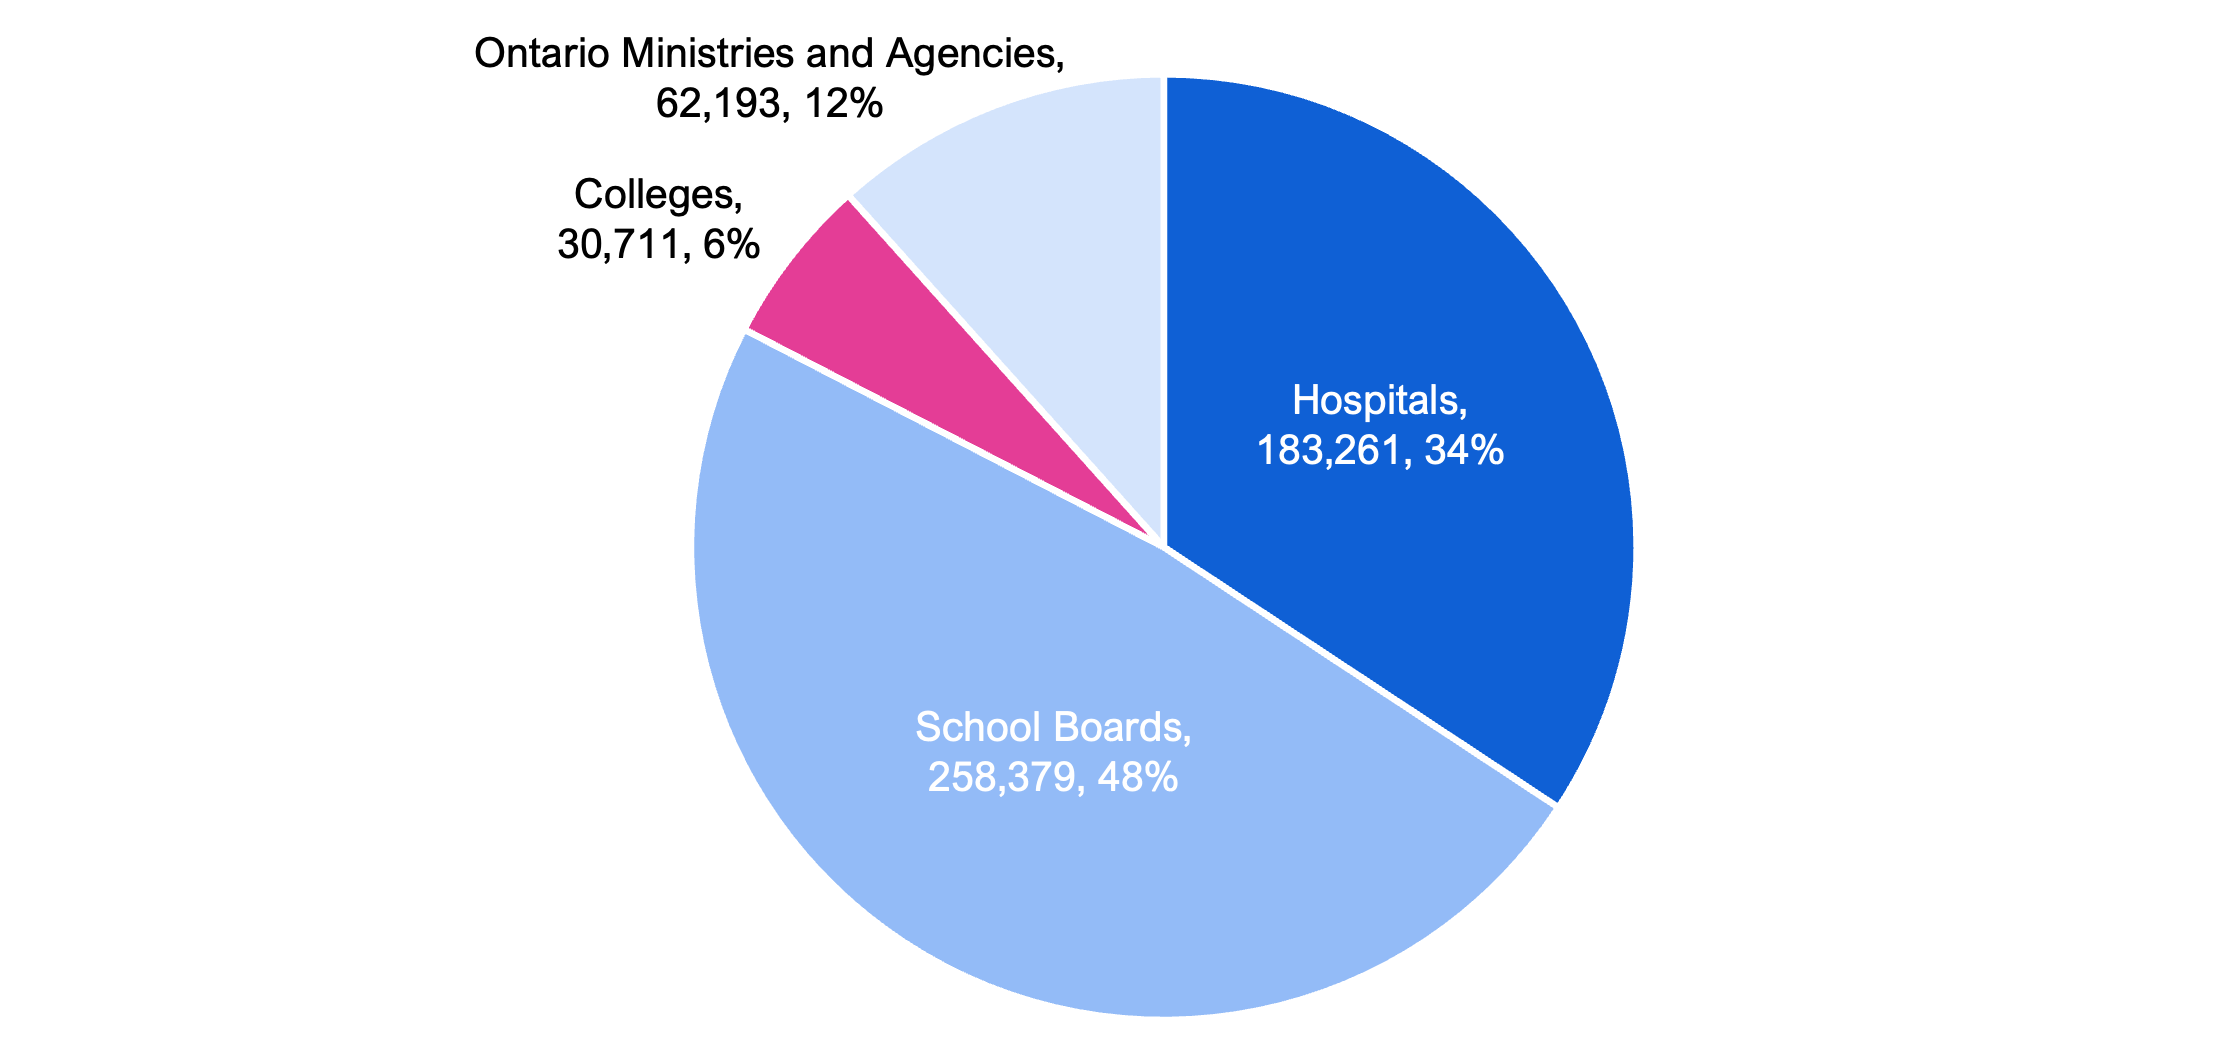
Of these unionized Ontario Public Sector employees, 183,261 (34 per cent of all unionized Ontario Public Sector employees) were employed by hospitals, 258,379 (48 per cent) were employed by school boards, 30,711 (six per cent) were employed by colleges, and 62,193 (12 per cent) were employed by Ontario ministries and agencies.
Figure 5: Number of unionized Ontario Public Sector employees by category and per cent of total, 2021
Source: The FAO calculates the number of “unionized” employees as the number of employees in a bargaining unit at the time of the ratification of an agreement, as reported in the Ministry of Labour, Immigration, Training and Skills Development’s publicly available collective bargaining database. In addition, the FAO has used other publicly available information to adjust for some unionized employees that are employed outside of the Ontario Public Sector.
Recent Wage Settlements for Unionized Employees
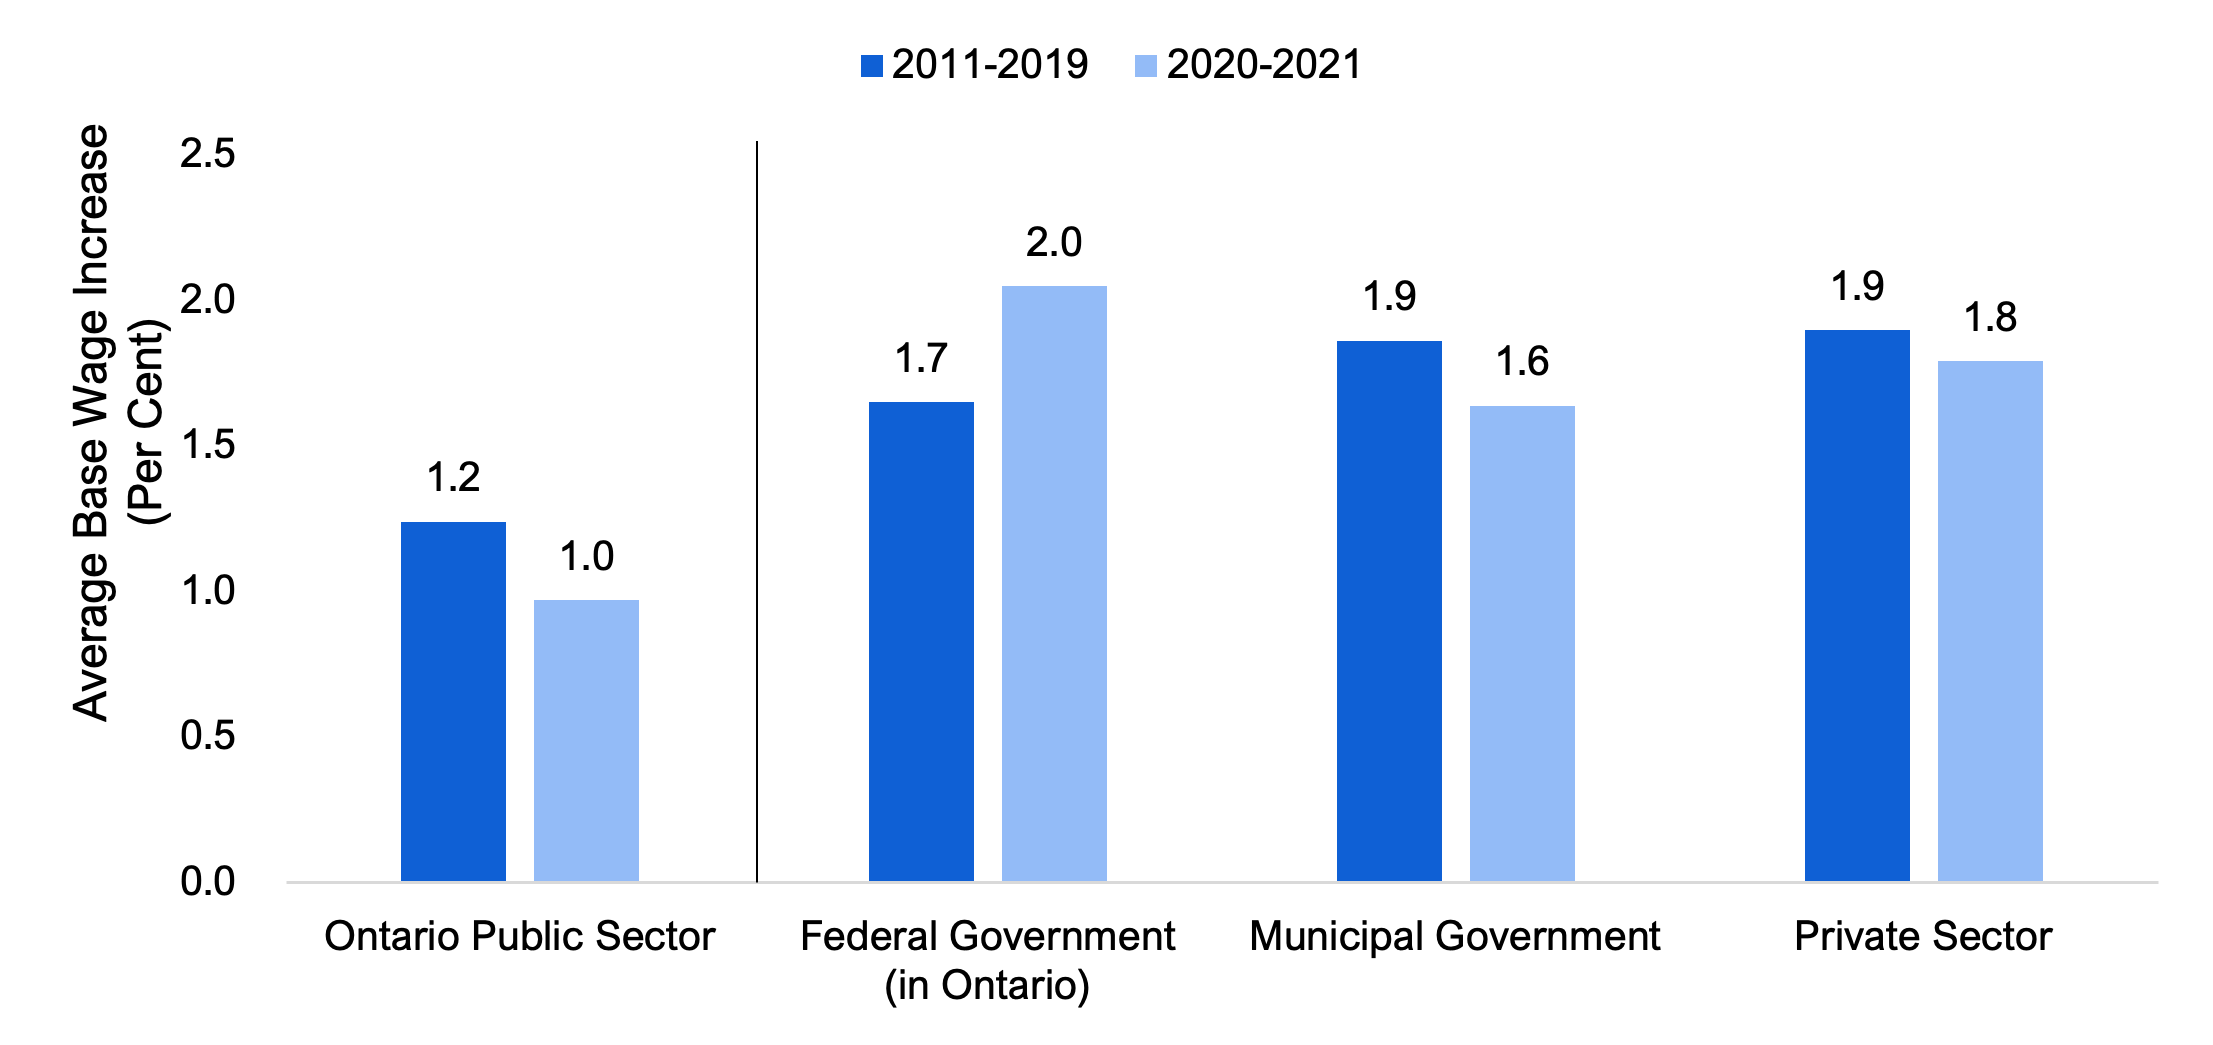
From 2011 to 2019, settlements for base salary increases in collective agreements for Ontario Public Sector unionized employees averaged 1.2 per cent per year.[26] This lagged behind average annual base salary increases in collective agreements for employees in the federal government (1.7 per cent), municipal government (1.9 per cent), and the private sector (1.9 per cent).
In 2020 and 2021, Ontario Public Sector base salary increases for new collective agreements averaged 1.0 per cent, lower than the 1.2 per cent average growth experienced from 2011 to 2019. The 1.0 per cent rate of increase in 2020 and 2021 for new collective agreements for Ontario Public Sector employees continued to lag behind settlements in the federal government (2.0 per cent), municipal government (1.6 per cent) and the private sector (1.8 per cent).
Figure 6: Average annual base wage increases for collective agreement settlements, 2011 to 2021
Source: FAO analysis of Ministry of Labour, Immigration, Training and Skills Development’s Annual Collective Bargaining Review, 2022.
Settlements for base salary increases for Ontario Public Sector unionized employees averaged 1.0 per cent in 2020 and 2021 due to the application of provincial wage restraint legislation (referred to as Bill 124) that was enacted in 2019.[27] Bill 124 limits base salary increases to one per cent per year,[28] for a period of three years, for Ontario Public Sector employees as well as some employees of other provincially supported organizations.[29] Most unionized Ontario Public Sector employees were subject to Bill 124 wage restraint provisions in 2020 and 2021 (see next section for details).
Upcoming Negotiations for Unionized Ontario Public Sector Employees and the Application of Bill 124
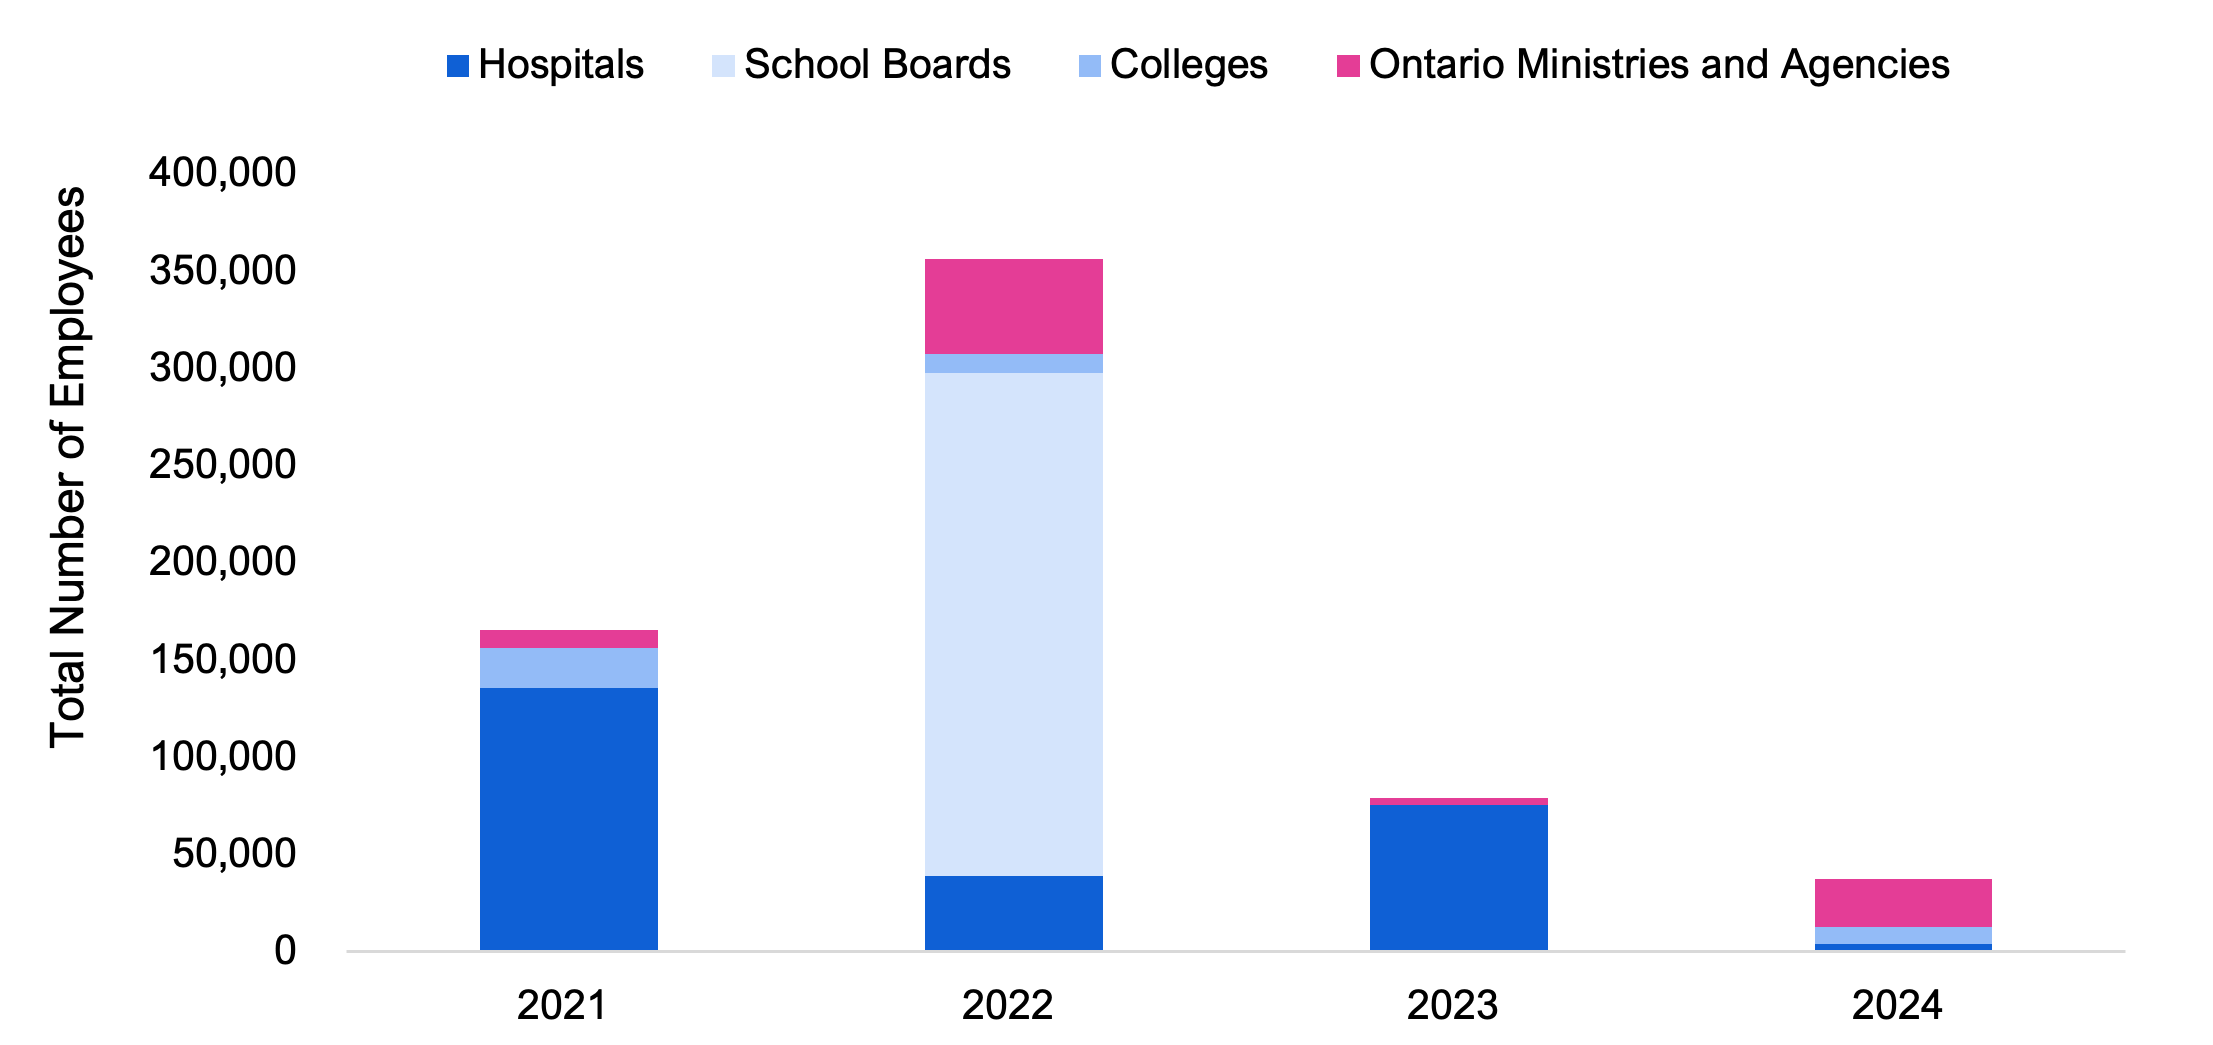
In 2021, the collective agreements for 165,534 Ontario Public Sector employees expired, mostly for hospital workers. In 2022, the number of employees with expiring agreements increases significantly to 356,613 employees. This includes 258,379 school board employees, followed by 39,118 hospital employees, 49,329 employees in Ontario ministries and agencies, and 9,787 college employees.
Combined, in 2021 and 2022, the collective agreements of 522,147 employees have expired or are expiring. As of the writing of this report, the FAO estimates that new collective agreements for 99,062 of these employees have been signed, while collective agreements for the remaining 423,085 employees continue to be under negotiation.
Looking forward, in 2023, collective agreements for 79,092 employees will expire, mainly for hospital employees, and, in 2024, there will be 37,211 employees with expiring collective agreements.[30]
Figure 7: Estimated number of unionized Ontario Public Sector employees with expiring collective agreements, 2021 to 2024
Source: FAO analysis of public collective bargaining information available from the Ministry of Labour, Immigration, Training and Skills Development.
Importantly, the FAO estimates that 375,273 (70 per cent) of unionized Ontario Public Sector employees have either completed or are under an existing collective bargaining agreement subject to wage restraint under Bill 124.[31] This includes 258,379 school board employees, 79,824 hospital employees, 8,699 college employees, and 28,371 employees of Ontario ministries and agencies.
As of the writing of this report, the FAO estimates that 159,271 (30 per cent) of unionized Ontario Public Sector employees are currently in the process of negotiating, or will soon be negotiating, collective bargaining agreements that will be subject to Bill 124 wage restraint, which limits base salary increases to one per cent per year, for a period of three years. This includes 103,437 hospital employees, 33,822 employees of Ontario ministries and agencies, and 22,012 college employees.
| Sector | Employees with Completed or Existing Collective Agreements Subject to Bill 124 | Employees with Upcoming or Under Negotiation Collective Agreements that will be Subject to Bill 124 | Total Unionized Employees | |
|---|---|---|---|---|
| School Boards | 258,379 | 0 | 258,379 | |
| Colleges | 8,699 | 22,012 | 30,711 | |
| Hospitals | 79,824 | 103,437 | 183,261 | |
| Ontario Ministries and Agencies | 28,371 | 33,822 | 62,193 | |
| Total Ontario Public Sector | 375,273 | 159,271 | 534,544 | |
| Per Cent | 70 | 30 | 100 | |
- All 258,379 unionized school board employees have already completed the three-year period of wage restraint under Bill 124, with collective agreements that ended on August 31, 2022.
- An estimated 22,012 unionized college employees have not yet entered into collective agreements that are subject to Bill 124 wage restraint. The collective agreements for these employees expired in 2021 and 2022. New collective agreements for these employees will be subject to the three-year wage restraint application of Bill 124.
- An estimated 103,437 unionized hospital employees have not yet entered into collective agreements subject to Bill 124 wage restraint. The collective agreements for these employees largely expired in 2021 and 2022. This includes 37,962 employees in the Canadian Union of Public Employees (CUPE), 28,173 employees in the Ontario Public Service Employees Union (OPSEU), 17,213 employees in the Service Employees International Union (SEIU), 8,418 employees in Unifor, and 4,376 employees in the Ontario Nurses’ Association (ONA).
- An estimated 33,822 employees in Ontario ministries and agencies have not yet entered into collective agreements subject to Bill 124 wage restraint. This includes 12,599 employees in the Association of Management, Administrative and Professional Crown Employees of Ontario (AMAPCEO), with an agreement that expired on March 31, 2022, and 9,056 employees in the Ontario Provincial Police Association (OPPA), with an agreement that will expire on December 31, 2022.
5. Provincial Spending on Ontario Public Sector Compensation
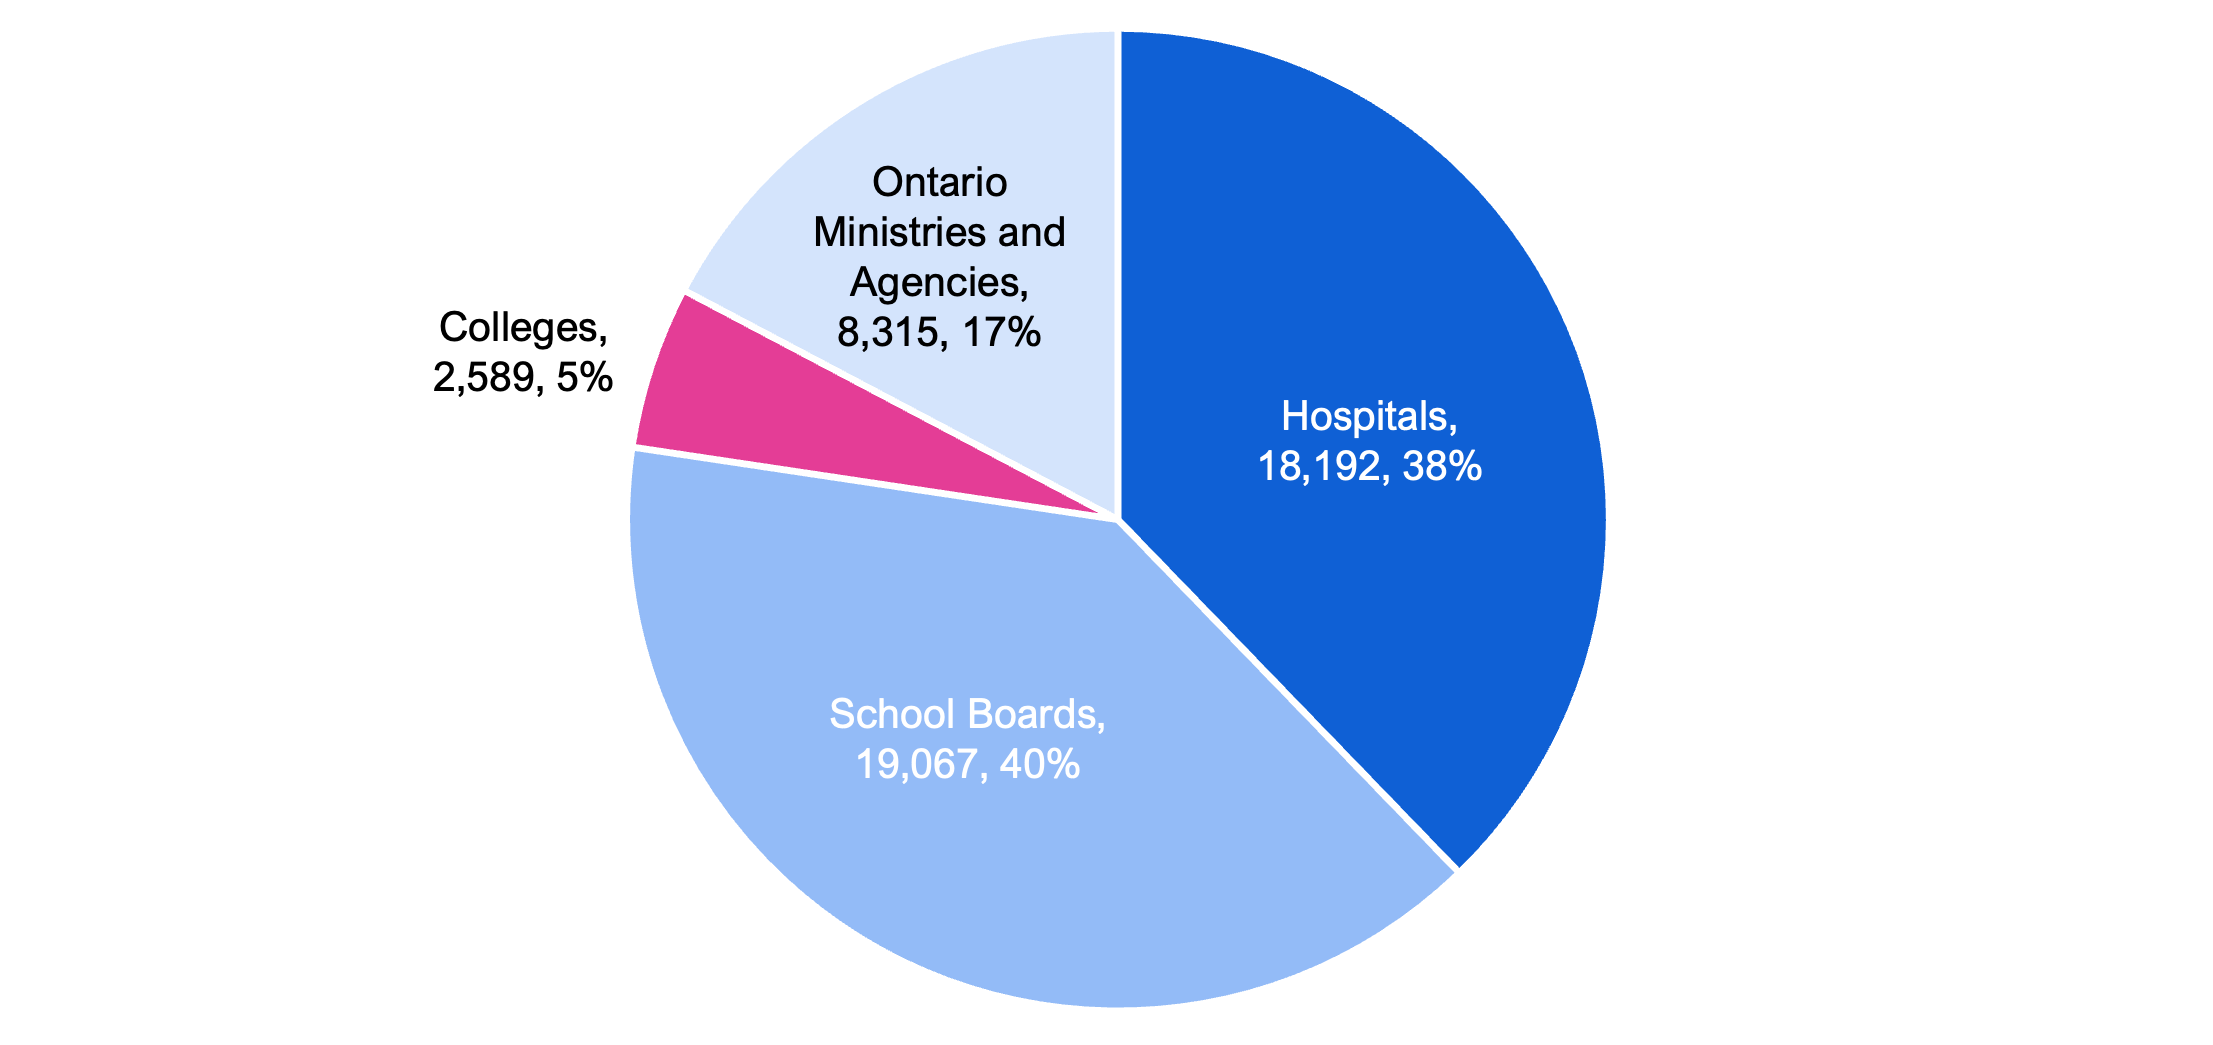
In 2021-22, the FAO estimates that the Ontario government spent $170.7 billion on programs. Of this amount, the FAO estimates that $48.2 billion (28 per cent) was spent on the salaries and wages (excluding pensions and benefits) for Ontario Public Sector employees.[32] This includes $19.1 billion for the wages of school board employees, $18.2 billion for hospital employees, $8.3 billion for the employees of Ontario ministries and agencies, and $2.6 billion for the wages of college employees.
Figure 8: Estimated total salaries and wages spending for Ontario Public Sector employees, 2021-22, $ millions and per cent of total
Source: FAO calculations.
Ontario’s total salaries and wages spending has grown from an estimated $36.3 billion in 2011-12 to $48.2 billion in 2021-22, representing average annual growth of 2.9 per cent.
Figure 9: Estimated provincial spending on Ontario Public Sector employee salaries and wages from 2011-12 to 2026-27, $ millions
Source: FAO calculations based on information from the Public Accounts of Ontario and Statistics Canada’s Survey of Employee, Payroll and Hours (SEPH).
Going forward, the FAO estimates that the Province’s total spending on salaries and wages for Ontario Public Sector employees will reach $56.9 billion by 2026-27, representing an average annual growth rate of 3.4 per cent over the five-year period. This forecast is the FAO’s “base case” projection and represents a status quo outlook for spending on salary and wages for Ontario Public Sector employees, based on the FAO’s review of existing programs; new program commitments; existing collective agreements; the application of Bill 124 to upcoming collective agreements, if applicable, for unionized Ontario Public Sector employees (see section 4); and the FAO’s assumption that wage increases after the application of Bill 124 will return to the long-term historical average.
Importantly, the FAO costed the impact of Bill 124 and estimated that it will save the Province a cumulative total of $9.7 billion in salaries and wages costs for both unionized and non-unionized Ontario Public Sector employees from the introduction of Bill 124 in 2019 through to 2026-27. The FAO’s $9.7 billion savings estimate represents the estimated difference in provincial spending on Ontario Public Sector employee salaries and wages with wage restraint under Bill 124 compared to what spending on Ontario Public Sector employee salaries and wages would have been using the long-term historical average growth rate for Ontario Public Sector employee wages.
Overall, the FAO’s base case to 2026-27 projects average annual employment growth of 1.7 per cent and average annual wage growth of 1.7 per cent. The following sections provide more information.
Ontario Public Sector Employment Projection
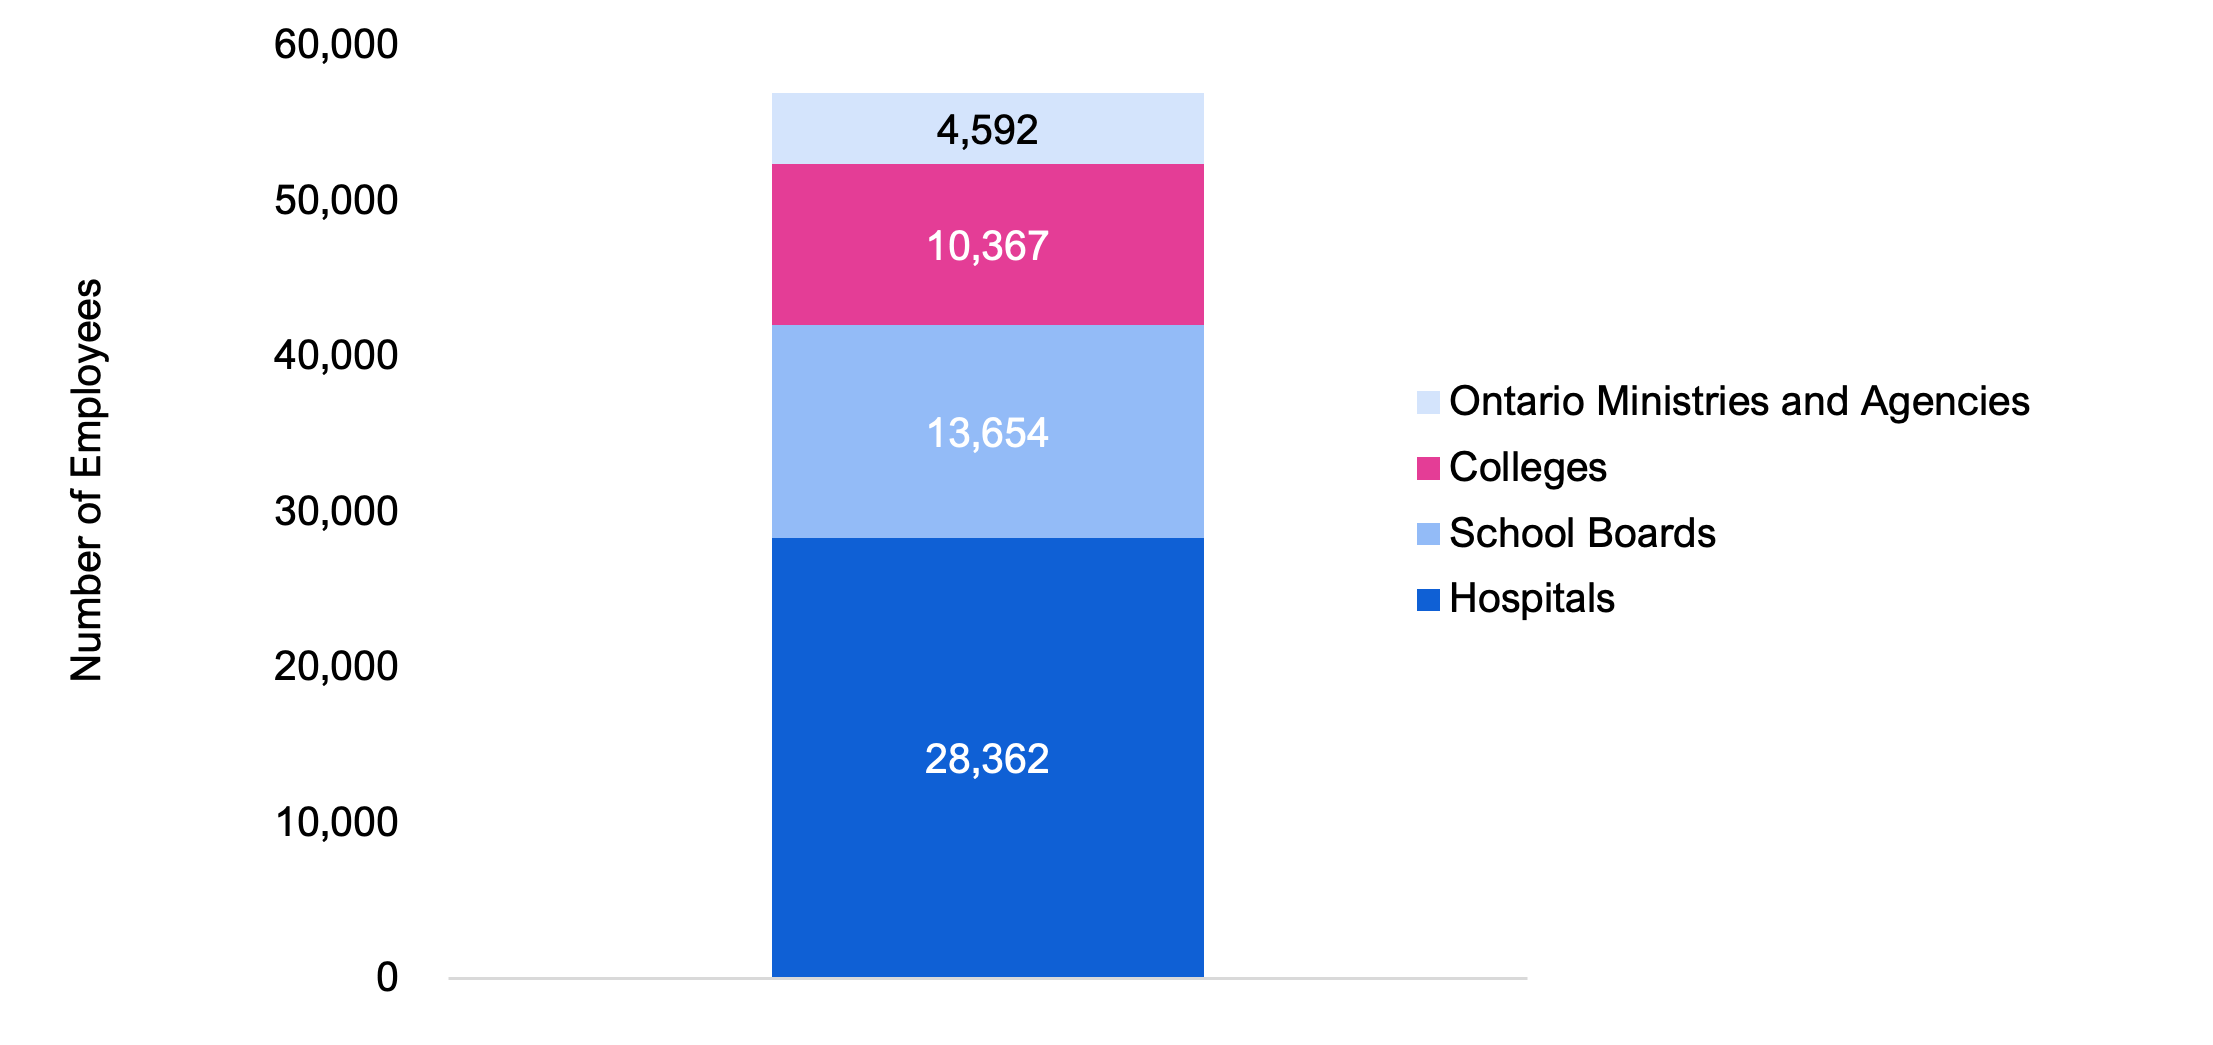
Based on a review of current government policies and commitments, the FAO estimates that the Province will add a total of 56,974 Ontario Public Sector workers from 2021-22 to 2026-27, for an average annual increase of 1.7 per cent. If achieved, the 1.7 per cent annual increase in Ontario Public Sector employees would be higher than the historical average of 1.1 per cent from 2011 to 2021.
- Hospital employment is projected to increase by 28,362, or 2.3 per cent per year, from 2021-22 to 2026-27. The increase is based on:
- the FAO’s review of the Province’s 10-year hospital infrastructure plan, which is expected to add 1,300 new hospital beds by 2026-27, and the estimated staffing levels required to support these new hospital beds; and
- the FAO’s assumption that the employment-to-hospital bed ratio will return to pre-pandemic levels by 2026-27.[33]
- School board employment is estimated to grow by 13,654 over the period (0.9 per cent per year), reflecting projected student enrolment growth and no change to current class size ratios.
- College employment is projected to increase by 10,367 (4.1 per cent per year), driven by an expected recovery in domestic and international student enrolment growth, estimated to average five per cent per year over the next five years.
- Employment in Ontario ministries and agencies is projected to grow by 4,592, in line with the long-term historical annual average for the Ontario Public Sector at 1.1 per cent.
Figure 10: FAO’s projected growth in Ontario Public Sector employment, 2021-22 to 2026-27
Source: FAO calculations.
Ontario Public Sector Wage Growth Projection
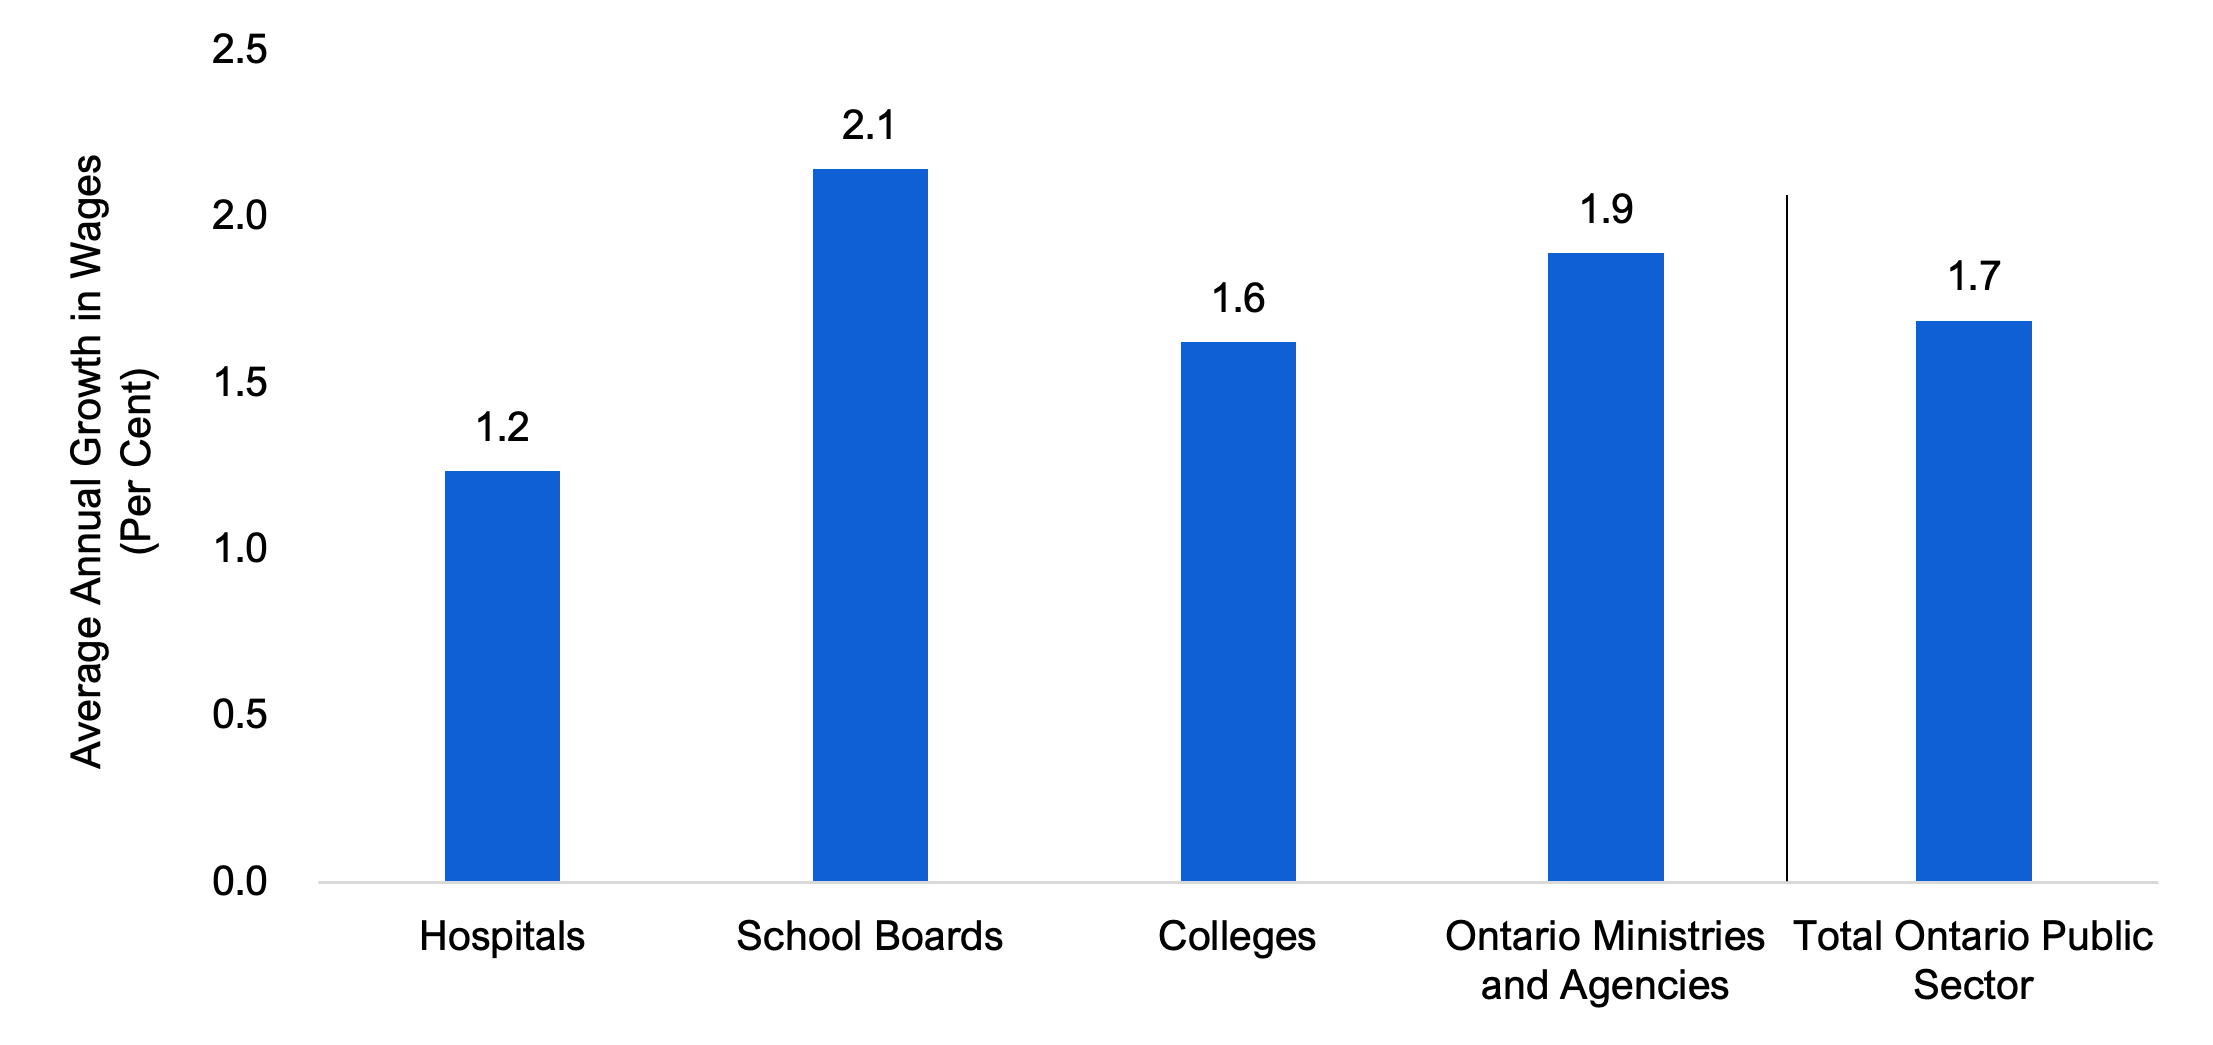
The FAO’s base case projection assumes wage growth that is consistent with existing collective agreements and, for new collective agreements, either the wage restraint terms under Bill 124, if applicable, or historical long-term average growth in wages. Based on these assumptions, over the next five years, the FAO projects that the average salary for Ontario Public Sector workers will grow at an annual average rate of 1.7 per cent.
- The FAO estimates that over half of unionized hospital employees have yet to enter into collective agreements subject to wage restraint under Bill 124, while wages for the remaining employees are assumed to grow at the historical annual growth rate of 2.4 per cent. Given this, the FAO projects that the average salary for hospital workers will grow at 1.2 per cent per year on average from 2021-22 to 2026-27.[34]
- For school board employees, the three-year period of wage restraint under Bill 124 expired on August 31, 2022, at which point the FAO assumes a return to historical average wage growth of 2.2 per cent. Overall, the FAO projects that the average salary for school board workers will grow at 2.1 per cent per year on average from 2021-22 to 2026-27.
- Most unionized college employees have yet to enter into collective agreements subject to wage restraint under Bill 124, with agreements being negotiated this year. Consequently, the FAO projects that the average salary for college workers will grow at 1.6 per cent per year on average from 2021-22 to 2026-27.
- About half of unionized employees in Ontario ministries and agencies will be subjected to three years of wage restraint under Bill 124 during the five-year period. Given this, the FAO projects that the average salary for workers of Ontario ministries and agencies will grow at 1.9 per cent per year on average from 2021-22 to 2026-27.
Figure 11: Projected average annual salary growth for Ontario Public Sector employees, 2021-22 to 2026-27, per cent
Source: FAO estimates.
6. Risks to the FAO’s Base Case Projection
Section 5 explained the FAO’s base case projection, from 2021-22 to 2026-27, for provincial spending on Ontario Public Sector employee salaries and wages, including assumed growth in the number of employees and wages. This section reviews three notable risks to the FAO’s base case projection: inflation, a court challenge to Bill 124 and staffing shortages.
Risk 1: Inflation Could Lead to Higher Wage Increases
For the three-year period from 2021-22 to 2023-24, the FAO projects that inflation (as measured by the Consumer Price Index) will average 4.6 per cent per year, compared to a historical average of 1.9 per cent per year.[35] This includes an expected annual inflation rate of 4.4 per cent in 2021-22, 6.1 per cent in 2022-23 and 3.2 per cent in 2023-24, before returning to 2.0 per cent in 2024-25 and ongoing.
Over the same three-year period, under the FAO’s base case projection, average salaries for Ontario Public Sector employees are expected to grow by 0.9 per cent per year.[36] This means that from 2021-22 to 2023-24, average salary growth for Ontario Public Sector employees is projected to significantly lag behind inflation, resulting in a cumulative 11.3 per cent decline in real wages over three years.
Figure 12: FAO’s inflation forecast and projection for annual growth in Ontario Public Sector employee average salaries, 2021-22 to 2023-24
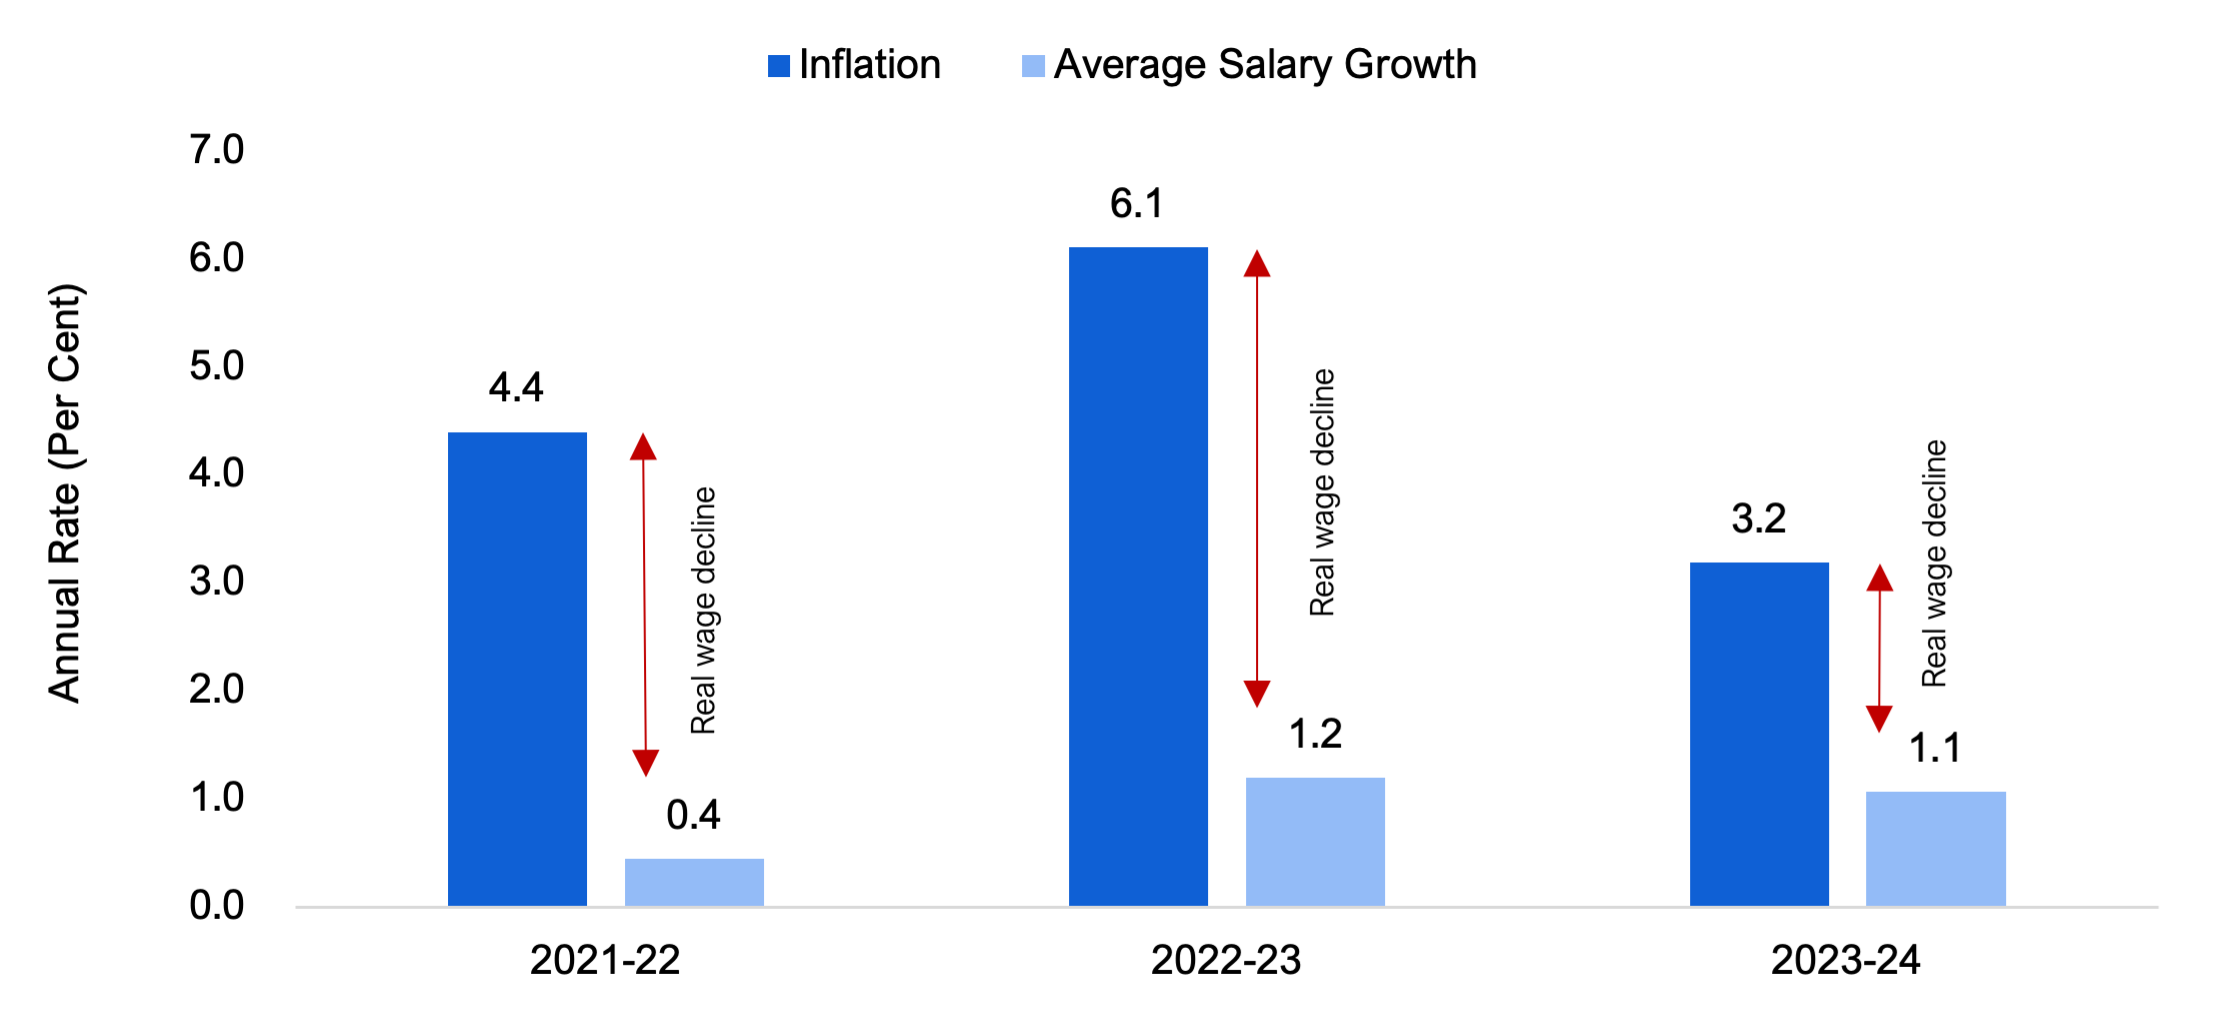
Note: The 2021-22 average salary increase was impacted by COVID-19-related changes to employee composition and working hours.
Source: FAO calculations.
Since elevated inflation from 2021-22 to 2023-24 may lead to above-average wage settlements for upcoming Ontario Public Sector collective agreements, the FAO has developed a scenario in which, for upcoming collective agreements that are no longer subject to wage restraint under Bill 124, Ontario Public Sector employees receive wage increases above historical trends for a three-year period, followed by a return to wage increases consistent with long-term trends.
This above-average wage growth inflation adjustment scenario includes an annual 1.7 percentage points inflation adjustment for three years, based on the inflation adjustment observed to date for unionized private sector employees in 2022. Collective bargaining settlements with private sector unions in 2022 have started to account for higher inflation, with yearly base wage increases averaging 4.4 per cent over three years.[37]
Under this inflation adjustment scenario, the FAO estimates that total salaries and wages spending for Ontario Public Sector employees would grow at an average annual rate of 4.2 per cent to $59.3 billion by 2026-27, which is $2.4 billion higher than in the FAO’s base case projection for that year. Over the entire five-year forecast period, the FAO estimates that total cumulative spending on Ontario Public Sector employee salaries and wages would be $6.8 billion higher under the inflation adjustment scenario compared to the FAO’s base case projection.
Figure 13: FAO’s projected total provincial spending on Ontario Public Sector employee salaries and wages with inflation adjustment scenario, 2021-22 to 2026-27, $ millions
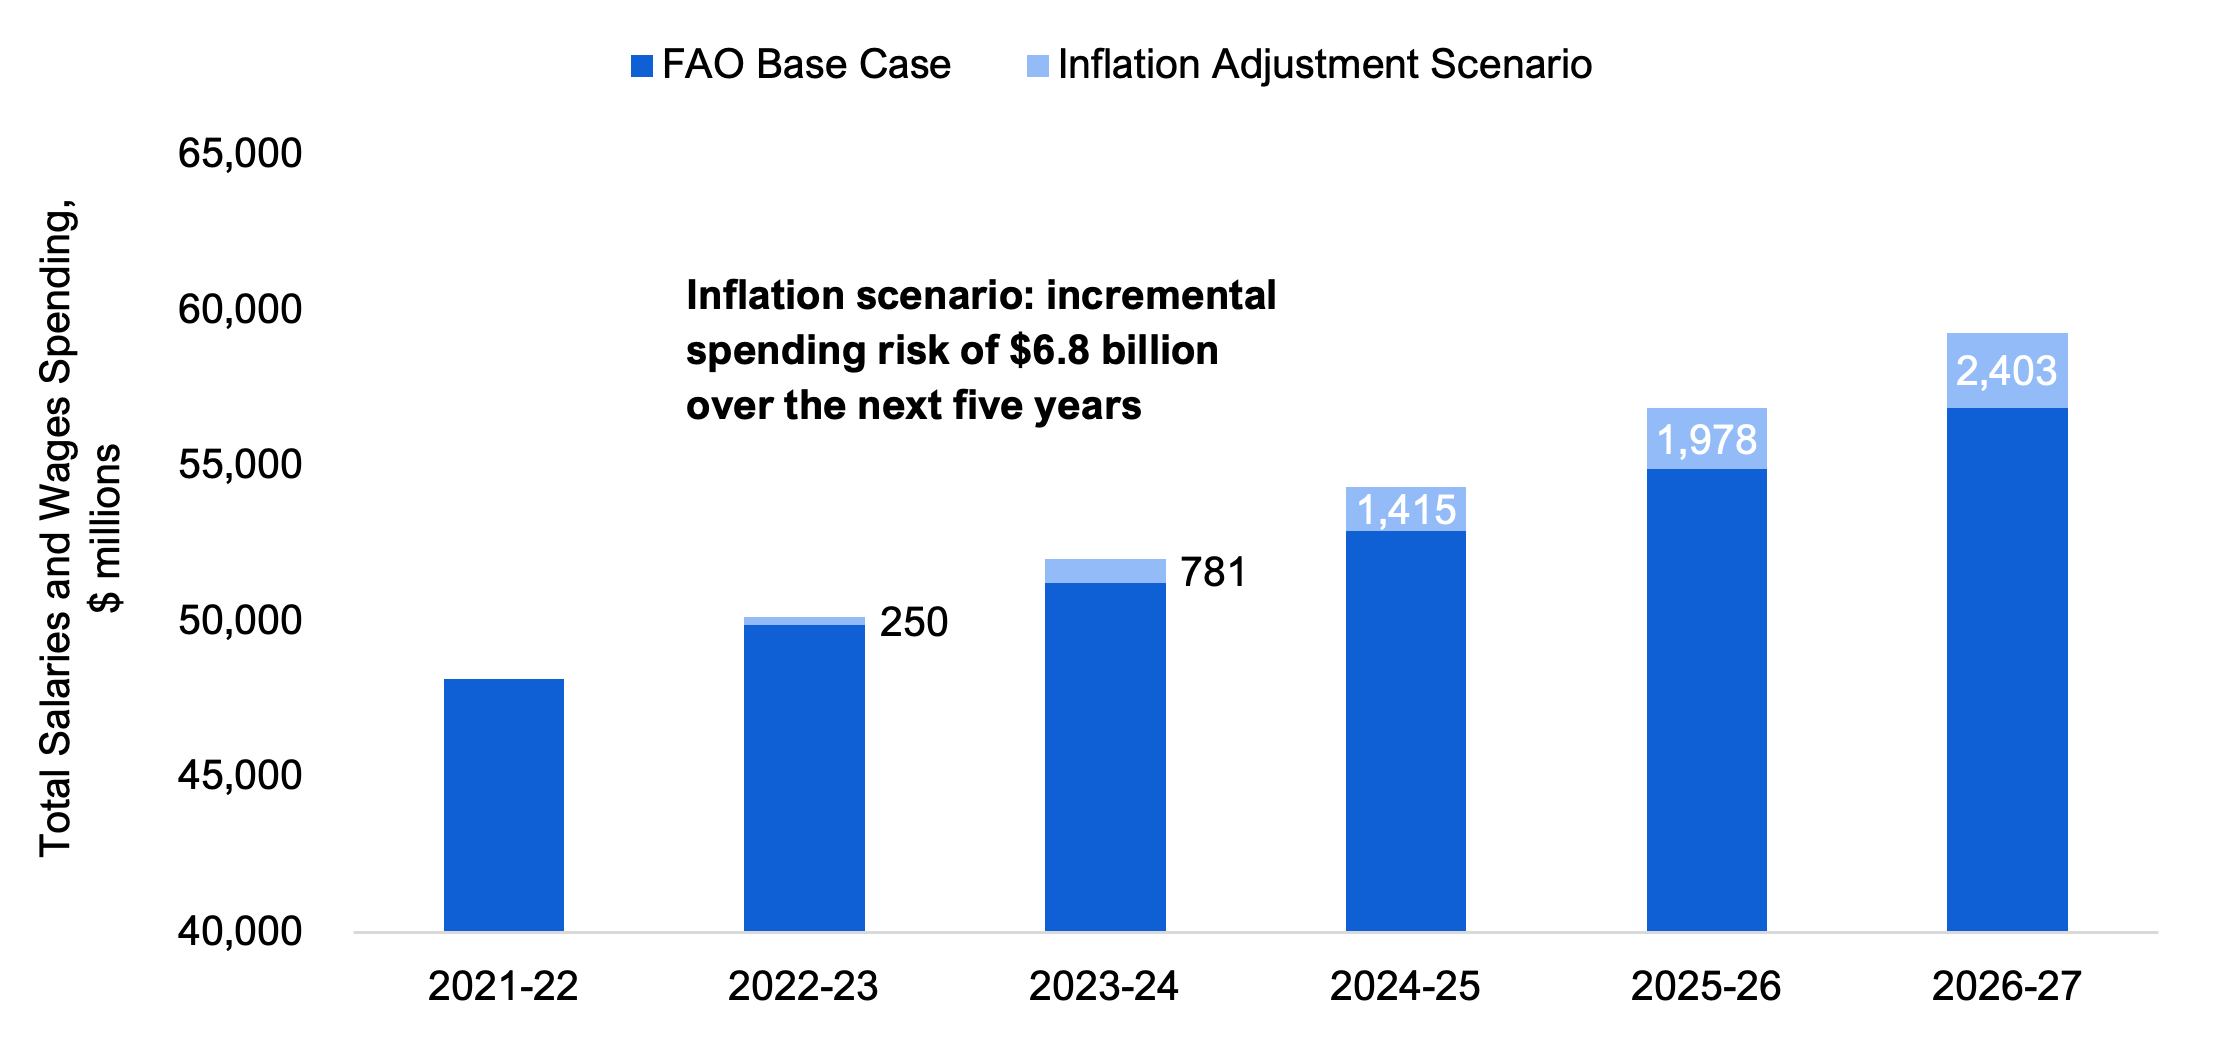
Note: Inflation adjustment scenario assumes that for upcoming collective agreements that are no longer subject to Bill 124 wage restraint terms, Ontario Public Sector employees receive wage increases above historical trends for a three-year period, followed by a return to wage increases consistent with long-term trends. The inflation adjustment is 1.7 percentage points for three years based on the inflation adjustment observed as of September 12, 2022 for unionized private sector employees in 2022.
Source: FAO estimates and public collective bargaining information available from the Ministry of Labour, Immigration, Training and Skills Development as of September 12, 2022.
Risk 2: Successful Court Challenge to Bill 124 Could Lead to Higher Spending on Wages
In response to the passage of Bill 124, a coalition of over 40 Ontario unions representing approximately 270,000 employees launched a lawsuit to repeal the legislation on the basis that it infringed on their rights to associate and collectively bargain as guaranteed under the Canadian Charter of Rights and Freedoms. In this lawsuit, the unions have asked the court to declare the terms of Bill 124 null and void, and that the Province repay workers for lost earnings.[38] As of the writing of this report, hearings have been scheduled for September 2022 and a decision is expected in 2023.[39]
Given the potential cost to the Province if this lawsuit is successful, the FAO developed a Bill 124 challenge scenario in which:
- Ontario Public Sector unionized employees are compensated for Bill 124 wage growth restrictions that have applied since 2019; and
- going forward, wage restraint under Bill 124 would no longer apply to all Ontario Public Sector employees.[40]
Based on the assumptions underlying this scenario, if the legal challenge to Bill 124 is successful, the FAO estimates that provincial spending on Ontario Public Sector employee salaries and wages could increase by a cumulative total of $8.4 billion[41] over the five-year period from 2022-23 to 2026-27, including an estimated $2.1 billion retroactive payment in 2022-23.
Figure 14: FAO’s projected total provincial spending on Ontario Public Sector employee salaries and wages with Bill 124 challenge scenario, 2021-22 to 2026-27, $ millions
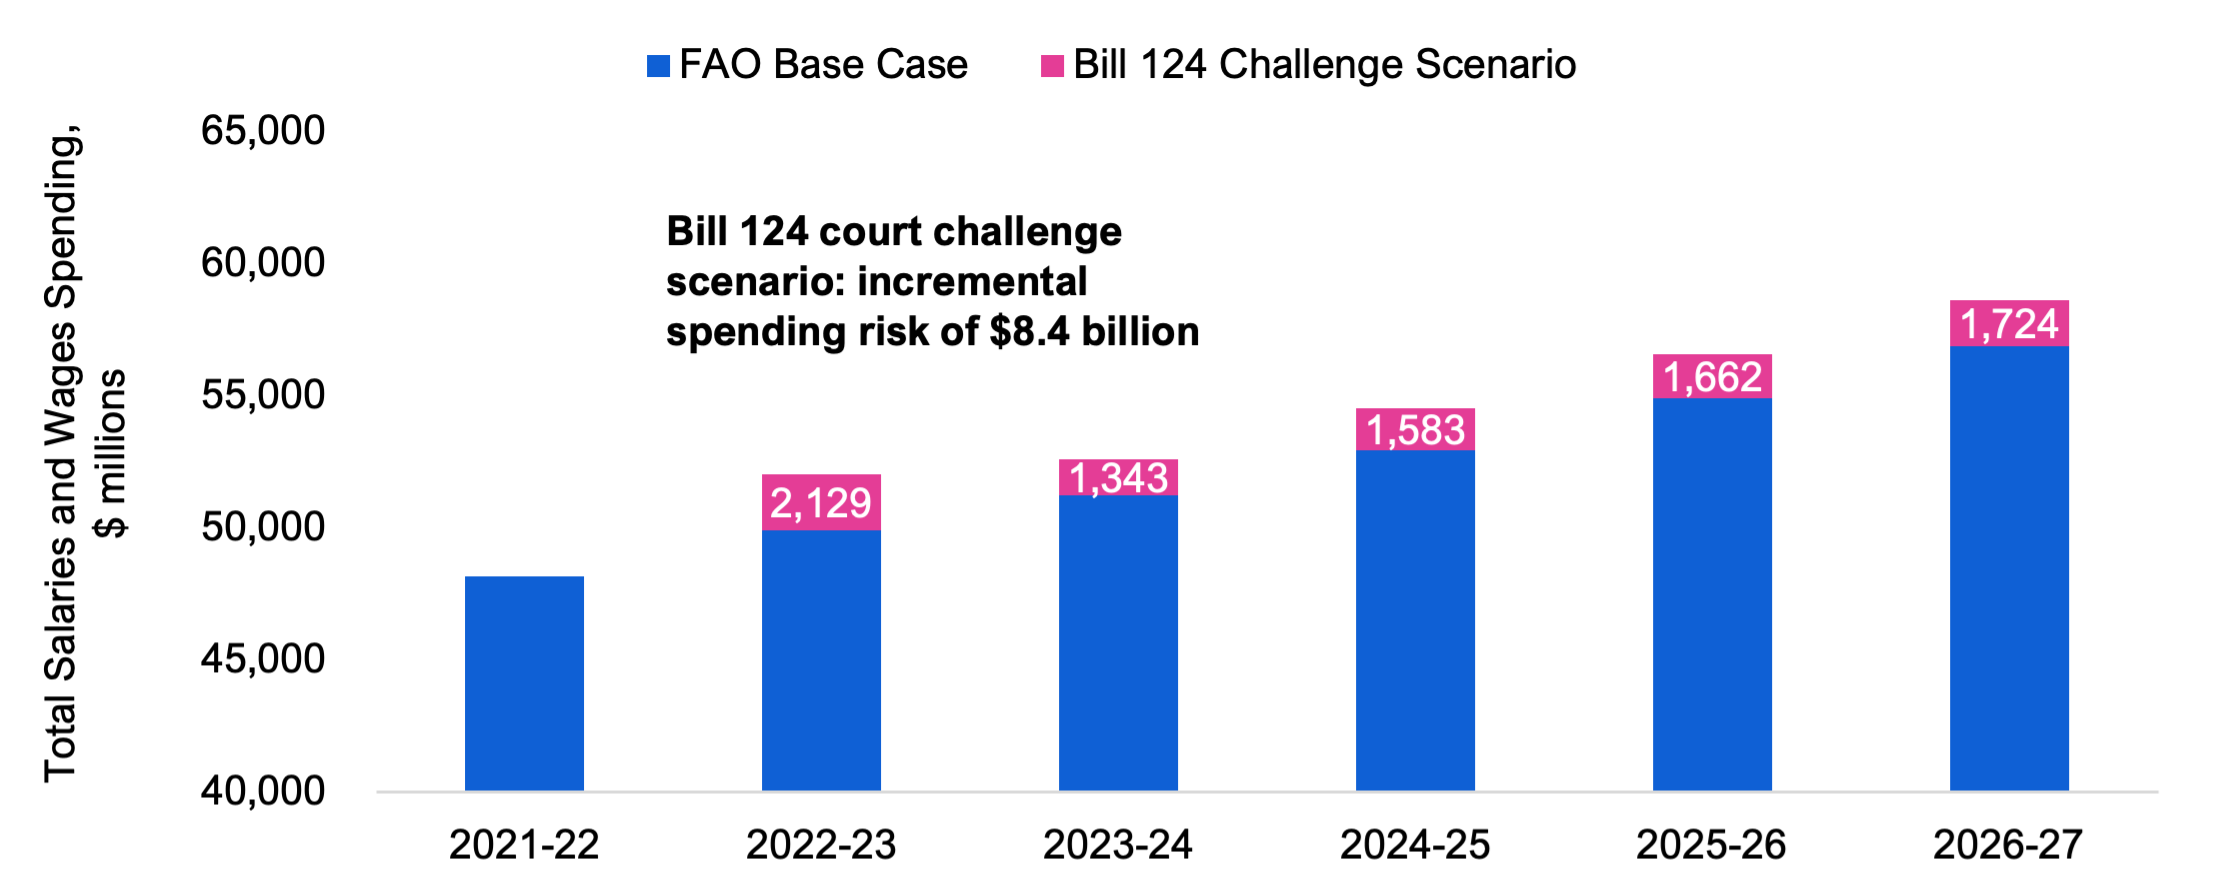
Note: Bill 124 challenge scenario assumes that unionized Ontario Public Sector employees are compensated for Bill 124 wage growth restrictions that have applied since 2019, estimated as the difference between historical average wage growth and the amount received under collective agreements subject to Bill 124 wage restraint. Going forward, this scenario assumes that wage restraint under Bill 124 would no longer apply, and that wage growth would be consistent with the long-term historical average.
Source: FAO estimates.
Risk 3: Staffing Shortages Could Lead to Reduced Service Levels and Higher Wage Increases
Vacancy rates, or the number of vacant jobs as a share of total jobs (occupied and vacant), have risen across most public and private sector job categories, including for positions in the Ontario Public Sector and other provincially supported organizations. This suggests that the Province will have difficulty staffing existing positions and hiring to meet new program commitments.
This challenge is most pronounced in the health sector across all job categories (see Figure 15). For example, in the second quarter of 2022,[42] almost nine out of every 100 jobs were vacant in nursing and residential care, for a total of 16,315 vacancies, which was more than double the 4.0 per cent vacancy rate[43] from 2019. In other health care, which includes home care, clinics and doctors’ offices, there were 11,775 job vacancies in the second quarter of 2022, with a job vacancy rate of 5.5 per cent, double the 2.7 per cent job vacancy rate in 2019. Lastly, there were 16,020 job vacancies in hospitals in the second quarter of 2022. Since 2019, the hospitals job vacancy rate has increased from 3.4 per cent to 5.8 per cent.
Outside of health care, the vacancy rate in social assistance, which includes child care and children’s aid societies, has also increased significantly, from 2.8 per cent in 2019 to 5.8 per cent in 2022, while the vacancy rate for educational services (1.3 per cent in 2019) and public administration (1.5 per cent in 2019) increased to 1.8 per cent and 2.7 per cent in 2022, respectively. Finally, the vacancy rate for all industries increased from 3.3 per cent in 2019 to 5.7 per cent in 2022, indicating that filling job openings is a significant challenge across most industries in Ontario.
Figure 15: Ontario job vacancy rate by category, per cent
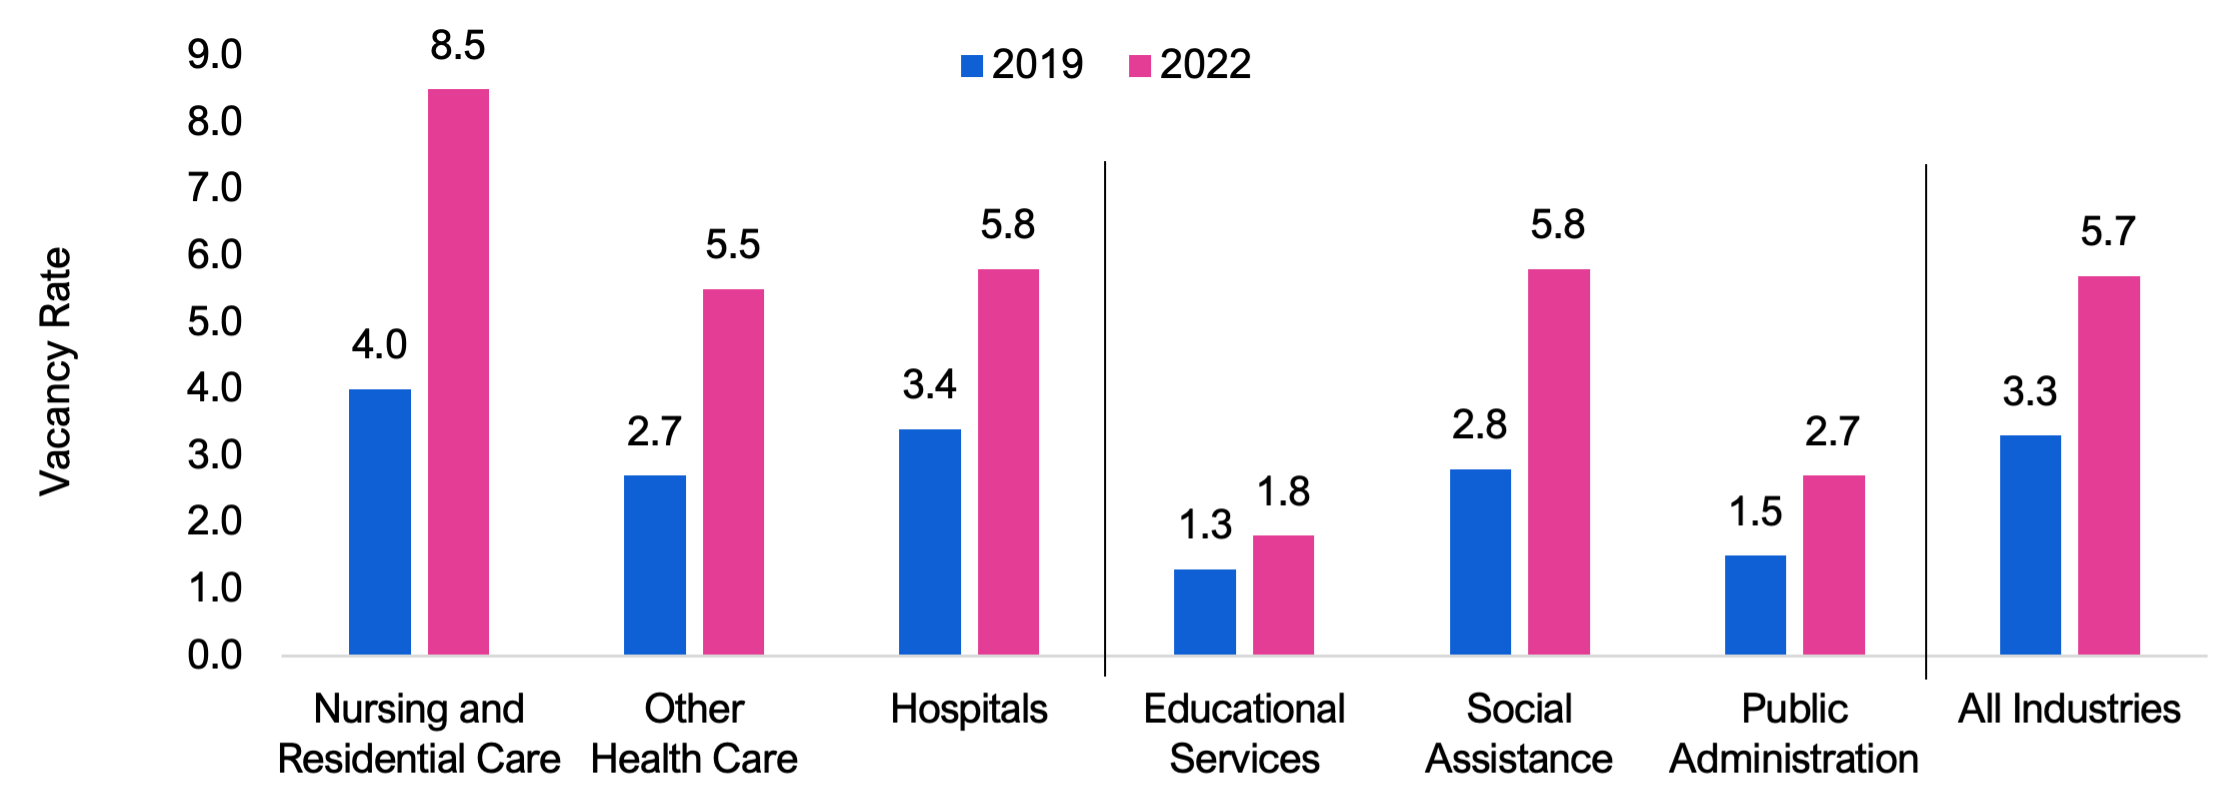
Note: Dates refer to the second quarter of each calendar year. The job vacancy rate is the number of job vacancies expressed as a percentage of total occupied and vacant jobs. Educational services includes schools, colleges and universities. Social assistance includes child care and children’s aid societies.
Source: FAO analysis of Statistics Canada Table 14-10-0326-01.
High vacancy rates can result in staff shortages and impact public services. For example, the Ontario Nurses’ Association reported that “about 25 hospitals in Ontario were forced to scale back sections of their facilities on the [August] long weekend due to staff shortages.”[44] Similarly, teacher shortages have resulted in “some school boards… hiring people who are not certified teachers or who have certification pending to cover emergency vacancies.”[45]
In addition to the immediate challenges caused by high job vacancy rates, the Province will need to increase staffing levels over the next five years to meet new commitments and maintain service levels for existing programs. As noted in section 5, the FAO’s base case projection assumes that the Province increases Ontario Public Sector staffing levels by 56,974 employees by 2026-27. Furthermore, outside of the Ontario Public Sector, the Province has made significant program expansion commitments in long-term care, home care and child care[46] that the FAO estimates will require an estimated 81,695 additional employees to be hired by other provincially supported organizations by 2026-27. Combined, the FAO estimates that an additional 138,669 employees will need to be hired in the Ontario Public Sector and by other provincially supported organizations that deliver provincial programs in long-term care, home care and child care.
Options to fill vacant positions and meet new staffing needs include investing in skills development programs, seeking foreign-trained workers and recognizing foreign credentials, increasing wages, and/or temporarily filling vacant positions through employment agencies. For example, the Province has:
- announced a $5,000 per person retention bonus for Ontario nurses,[47] paid over two installments in 2022, and made permanent a $2 to $3 pandemic hourly wage increase for personal support workers (PSWs);[48]
- directed the College of Nurses of Ontario and the College of Physicians and Surgeons of Ontario to expedite the registration of foreign-trained professionals;[49]
- implemented programs to provide PSWs with $6,000 per year to train as registered practical nurses (RPNs) and RPNs with $10,000 to train to become registered nurses (RNs), and to provide $6,000 per year for internationally trained nurses to gain credentials in Ontario;[50] and
- expanded nursing and medical school spaces.[51]
In addition, hospitals have reportedly expanded the use of employment agencies to fill nursing positions.[52]
Overall, wage growth remains below inflation for employees in the Ontario Public Sector, resulting in real wage declines. As higher wages attract entry into the workforce from other sectors, provinces or countries, or by those recently retired or out of the workforce due to other reasons, the Province may need to increase wages beyond the FAO’s base case assumption, to ensure sufficient staffing to maintain existing public services and meet program expansion commitments.
7. Appendix
Data Sources and Methodology
Public information available from Statistics Canada’s Survey of Employment, Payroll and Hours (SEPH) is the primary source of data for historical employment trends in this report. This data is detailed by North American Industry Classification System (NAICS) code, which the FAO uses to estimate total employees (excluding self-employed individuals) in different job categories of the public sector. The FAO also uses SEPH information for historical wage trends.
Public information available from the Ministry of Labour, Immigration, Training and Skills Development’s (MLITSD) collective bargaining database[53] is the primary source of data for the analysis on collective bargaining and unionized employees in this report. The FAO uses this data to estimate the total number of unionized employees by NAICS code, the number of employees that have/have not yet finalized an agreement under Bill 124, and base wage increases under current collective agreements for unionized employees in the Ontario Public Sector. Wage increases in the MLITSD database exclude bonuses/lump sum payments and may not be representative of total wage increases for individual employees.
The FAO’s projections for provincial spending on Ontario Public Sector employee salaries and wages account for all employees as defined by SEPH, which includes employees under collective agreements and employees that are non-unionized. Projected spending on salaries and wages excludes pensions and benefits, and represents the impact of existing collective agreements, bonuses/lump sum payments and other factors. The FAO’s salaries and wages projection is equivalent to the total amount of consolidated salaries and wages spending that is reported in the Public Accounts of Ontario. To support its spending projection, the FAO used information provided by the Ministries of Health, Education, and Colleges and Universities.
All dollar amounts are in Canadian, current dollars (i.e., not adjusted for inflation) unless otherwise noted.
About this Document
Established by the Financial Accountability Officer Act, 2013, the Financial Accountability Office (FAO) provides independent analysis on the state of the Province’s finances, trends in the provincial economy and related matters important to the Legislative Assembly of Ontario.
Prepared by:
Matthew Stephenson (Manager, Financial Analysis) and Luan Ngo (Director, Financial Analysis) under the direction of Jeffrey Novak (Chief Financial Analyst).
Graphical Descriptions
| Number of Workers | Per Cent of Total Workers | ||
|---|---|---|---|
| Ontario Public Sector | 654,641 | 10 | |
| Other Provincially Supported Organizations | 520,989 | 8 | |
| Municipal Government | 225,597 | 4 | |
| Federal Government | 160,073 | 3 | |
| Private Sector | 4,776,503 | 75 | |
| Year | Total Number of Workers |
|---|---|
| 2011 | 588,144 |
| 2012 | 593,661 |
| 2013 | 601,266 |
| 2014 | 611,567 |
| 2015 | 617,519 |
| 2016 | 624,419 |
| 2017 | 635,644 |
| 2018 | 650,908 |
| 2019 | 659,537 |
| 2020 | 636,117 |
| 2021 | 654,641 |
| 2011-2019 | 2020 | 2021 | ||
|---|---|---|---|---|
| Hospitals | 1.2 | 1.7 | 4.9 | |
| School Boards | 1.3 | -5.3 | 2.0 | |
| Colleges | 3.4 | -11.5 | 1.7 | |
| Ontario Ministries and Agencies | 1.3 | -6.3 | 1.3 | |
| Total Ontario Public Sector | 1.4 | -3.6 | 2.9 | |
| 2011 | 2021 | ||
|---|---|---|---|
| Ontario Public Sector | 58,875 | 69,259 | |
| Other Provincially Supported Organizations | 39,027 | 50,970 | |
| Federal Government (in Ontario) | 75,012 | 89,574 | |
| Municipal Government | 47,976 | 70,418 | |
| Private Sector | 44,541 | 59,123 | |
| Number of Employees | Per Cent of Total Employees | ||
|---|---|---|---|
| Hospitals | 183,261 | 34 | |
| School Boards | 258,379 | 48 | |
| Colleges | 30,711 | 6 | |
| Ontario Ministries and Agencies | 62,193 | 12 | |
| 2011-2019 | 2020-2021 | ||
|---|---|---|---|
| Ontario Public Sector | 1.2 | 1.0 | |
| Federal Government (in Ontario) | 1.7 | 2.0 | |
| Municipal Government | 1.9 | 1.6 | |
| Private Sector | 1.9 | 1.8 | |
| 2021 | 2022 | 2023 | 2024 | ||
|---|---|---|---|---|---|
| Hospitals | 135,517 | 39,118 | 75,492 | 3,941 | |
| School Boards | 0 | 258,379 | 0 | 0 | |
| Colleges | 20,924 | 9,787 | 0 | 8,699 | |
| Ontario Ministries and Agencies | 9,093 | 49,329 | 3,600 | 24,571 | |
| Salaries and Wages | Per Cent of Total | ||
|---|---|---|---|
| Hospitals | 18,192 | 38 | |
| School Boards | 19,067 | 40 | |
| Colleges | 2,589 | 5 | |
| Ontario Ministries and Agencies | 8,315 | 17 | |
| Year | Historical | FAO Base Case Projection |
|---|---|---|
| 2011-12 | 36,310 | |
| 2012-13 | 37,162 | |
| 2013-14 | 38,128 | |
| 2014-15 | 38,844 | |
| 2015-16 | 39,545 | |
| 2016-17 | 40,145 | |
| 2017-18 | 41,828 | |
| 2018-19 | 43,844 | |
| 2019-20 | 44,548 | |
| 2020-21 | 46,522 | |
| 2021-22 | 48,163 | |
| 2022-23 | 49,890 | |
| 2023-24 | 51,248 | |
| 2024-25 | 52,932 | |
| 2025-26 | 54,898 | |
| 2026-27 | 56,887 |
| Number of Employees | ||
|---|---|---|
| Hospitals | 28,362 | |
| School Boards | 13,654 | |
| Colleges | 10,367 | |
| Ontario Ministries and Agencies | 4,592 | |
| Average Annual Salary Growth | ||
|---|---|---|
| Hospitals | 1.2 | |
| School Boards | 2.1 | |
| Colleges | 1.6 | |
| Ontario Ministries and Agencies | 1.9 | |
| Total Ontario Public Sector | 1.7 | |
| Year | Inflation | Average Salary Growth |
|---|---|---|
| 2021-22 | 4.4 | 0.4 |
| 2022-23 | 6.1 | 1.2 |
| 2023-24 | 3.2 | 1.1 |
| Year | FAO Base Case | Inflation Adjustment Scenario | Total |
|---|---|---|---|
| 2021-22 | 48,163 | 0 | 48,163 |
| 2022-23 | 49,890 | 250 | 50,140 |
| 2023-24 | 51,248 | 781 | 52,030 |
| 2024-25 | 52,932 | 1,415 | 54,347 |
| 2025-26 | 54,898 | 1,978 | 56,876 |
| 2026-27 | 56,887 | 2,403 | 59,290 |
| Year | FAO Base Case | Bill 124 Challenge Scenario | Total |
|---|---|---|---|
| 2021-22 | 48,163 | 0 | 48,163 |
| 2022-23 | 49,890 | 2,129 | 52,020 |
| 2023-24 | 51,248 | 1,343 | 52,592 |
| 2024-25 | 52,932 | 1,583 | 54,515 |
| 2025-26 | 54,898 | 1,662 | 56,560 |
| 2026-27 | 56,887 | 1,724 | 58,611 |
| 2019 | 2022 | ||
|---|---|---|---|
| Nursing and Residential Care | 4.0 | 8.5 | |
| Other Health Care | 2.7 | 5.5 | |
| Hospitals | 3.4 | 5.8 | |
| Educational Services | 1.3 | 1.8 | |
| Social Assistance | 2.8 | 5.8 | |
| Public Administration | 1.5 | 2.7 | |
| All Industries | 3.3 | 5.7 | |
Footnotes
[1] In this report “compensation” refers to salaries and wages, and excludes pensions and benefits.
[2] Bill 124 refers to the Protecting a Sustainable Public Sector for Future Generations Act, 2019.
[3] Excludes 1.1 million self-employed Ontarians.
[4] These employees are either directly employed by Ontario ministries or agencies, or by entities (hospitals, school boards and colleges) that are financially controlled by the Province.
[5] The Province also provided funding for employees of other provincially supported organizations and subsidies to private sector organizations that supported employment. For example, in 2016-17, the FAO estimates that the Province provided businesses with approximately $4.9 billion through over 100 business support programs. See FAO, “Business Support Programs: the Effectiveness of Ontario’s Business Support Programs,” 2018.
[6] For example, school board employment is projected to increase based on projected student enrolment growth and no change to current class size ratios in schools, while hospital employment is projected to increase based on the FAO’s review of the Province’s 10-year hospital infrastructure plan, which is expected to add 1,300 new hospital beds by 2026-27, and the estimated staffing levels required to support these new hospital beds.
[7] This includes an expected annual inflation rate of 4.4 per cent in 2021-22, 6.1 per cent in 2022-23 and 3.2 per cent in 2023-24, before returning to 2.0 per cent in 2024-25 and ongoing.
[8] Based on FAO analysis of public collective bargaining information available from the Ministry of Labour, Immigration, Training and Skills Development as of September 12, 2022.
[9] For the retroactive compensation, the FAO assumes that unionized Ontario Public Sector employees would receive the difference between historical average wage growth and the amount received under collective agreements subject to Bill 124 wage restraint. Going forward, the FAO assumes long-term historical average wage growth for all Ontario Public Sector employees.
[10] The savings to the Province from Bill 124 of $9.7 billion (as noted above) is greater than the potential $8.4 billion cost if the Bill 124 legal challenge is successful as the FAO assumes that non-unionized employees would not receive compensation for wage growth restrictions that have applied since 2019.
[11] In 2026-27, spending would be $1.7 billion higher, compared to the FAO’s base case projection.
[12] CBC News, “Sylvia Jones surfaces as pressure mounts amid staffing 'crisis' in Ontario hospitals,” August 2, 2022.
[13] The FAO estimates that the Province’s 10-year hospital infrastructure plan outlined in the 2022 Ontario Budget will add 1,300 new hospital beds by 2026-27.
[14] For long-term care, the Province has committed to build 30,000 new long-term care beds by 2028, and increase the average hours of daily direct care provided to residents from 2.75 hours per day to 4.0 hours per day by 2024-25 (See FAO, “Ministry of Long-Term Care: Spending Plan Review,” 2021). For home care, the Province has committed to invest an additional $1.0 billion over three years to expand home care (Government of Ontario, Ontario Investing $1 Billion More to Expand Home Care, April 25, 2022). For child care, as part of the commitment to provide $10-a-day child care, the Province has committed to add 71,000 net new child care spaces by 2026 (Government of Ontario, $13.2 Billion Child Care Deal will Lower Fees for Families, March 28, 2022).
[15] In this report “compensation” refers to salaries and wages, and excludes pensions and benefits.
[16] The Protecting a Sustainable Public Sector for Future Generations Act, 2019.
[17] Excludes 1.1 million self-employed Ontarians.
[18] Generally speaking, if the financial results of a provincial agency or entity are consolidated on a line-by-line basis into the financial statements of the Province as part of the Public Accounts of Ontario, the FAO includes the employees of those agencies or entities as part of the Ontario Public Sector category. For more information on financial consolidation, see Note 1 and Schedule 8 of the 2020-21 Public Accounts of Ontario.
[19] The financial results of these organizations are not consolidated into the financial statements of the Province as part of the Public Accounts of Ontario. For more information on financial consolidation, see Note 1 and Schedule 8 of the 2020-21 Public Accounts of Ontario.
[20] For example, full-time equivalent student enrolment at Ontario colleges declined by 5.9 per cent in 2020-21 versus 2019-20.
[21] Average annual salary is calculated using average weekly earnings (gross payrolls before deductions) from Statistics Canada Table 14-10-0204-01 and assumes 52 weekly earning periods in a year.
[22] Within the Ontario Public Sector, employees in Ontario ministries and agencies earned an estimated $91,113 on average in 2021, followed by school board employees at $67,751, hospital employees at $64,980, and college employees at $59,807.
[23] The calculation of average annual salary increases includes the impact of base salary growth for a position or a class of positions, as well as the annual change in overall employee seniority (retirements vs. new hires).
[24] From 2011 to 2018, wage restraint was a key element in the previous government’s plan to eliminate the deficit. For more information, see FAO, “Assessing Ontario Government Employment and Wage Expense,” 2018.
[25] The FAO calculates the number of “unionized” employees as the number of employees in a bargaining unit at the time of the ratification of an agreement, as reported in the Ministry of Labour, Immigration, Training and Skills Development’s publicly available collective bargaining database. In addition, the FAO has used other publicly available information to adjust for some unionized employees that are employed outside of the Ontario Public Sector.
[26] The 1.2 per cent average annual base salary growth in Ontario Public Sector collective agreements from 2011 to 2019 represents salary increases to a position or a class of positions. It excludes any performance awards (e.g., bonuses or lump sum payments) and does not necessarily reflect the annual salary increase for each unionized employee. In contrast, the 1.6 per cent average annual increase to Ontario Public Sector employees’ average salaries from 2011 to 2021, as reported in section 3, includes the impact of employees graduating through positions, the overall change in employee seniority (retirements vs. new hires), non-unionized employees and performance awards (e.g., bonuses or lump sum payments), and is calculated over a different period.
[27] The Protecting a Sustainable Public Sector for Future Generations Act, 2019.
[28] Annual salary increases for individual employees could be greater than 1.0 per cent under the terms of Bill 124 due to other factors, such as graduating through positions, completing education, or receiving bonuses or lump sum payments.
[29] Section 5 of the Protecting a Sustainable Public Sector for Future Generations Act, 2019 includes a list of employers that are subject to the legislation.
[30] FAO estimates based on public information available from the Ministry of Labour, Immigration, Training and Skills Development.
[31] FAO estimate based on public information available from the Ministry of Labour, Immigration, Training and Skills Development as of September 12, 2022.
[32] The Province also provided funding for employees of other provincially supported organizations and subsidies to private sector organizations that supported employment. For example, in 2016-17, the FAO estimates that the Province provided businesses with approximately $4.9 billion through over 100 business support programs. See FAO, “Business Support Programs: the Effectiveness of Ontario’s Business Support Programs,” 2018.
[33] With the addition of new hospital beds from 2017 to 2021, the number of employees as a share of total hospital beds declined from a historical average of 6.8 employees per hospital bed to a low of 6.0 in 2020 and increased to 6.3 in 2021. The FAO assumes that the employee-to-hospital bed ratio will increase to the 6.8 historical average by 2026-27.
[34] 2021-22 includes temporary retention bonuses for nurses, which lowers the average annual growth rate.
[35] Over the 30-year period from 1992 to 2021.
[36] The change in the 2021-22 average salary was impacted by COVID-19-related changes to employee composition and working hours, which affects the projected average annual growth rate for Ontario Public Sector employee salaries over the three-year period.
[37] Based on FAO analysis of public collective bargaining information available from the Ministry of Labour, Immigration, Training and Skills Development as of September 12, 2022. In contrast, Ontario Public Sector compensation settlements reached in 2022 provide for average annual wage increases of 1.0 per cent for the next three years.
[38] Ontario Superior Court of Justice, Court File No.: CV-20-00637314-0000. https://www.dropbox.com/sh/g8nk3ukoof96qfo/AAAxR-MM5LRnTr41MDL8G78ja?dl=0.
[39] https://osstfupdate.ca/2022/05/10/court-challenge-update-bill-124-protecting-a-sustainable-public-sector-for-future-generations-act/.
[40] For the retroactive compensation, the FAO assumes that unions will receive the difference between historical average wage growth and the amount received under collective agreements subject to Bill 124 wage restraint. Going forward, the FAO assumes long-term historical average wage growth for all Ontario Public Sector employees.
[41] The savings to the Province from Bill 124 of $9.7 billion (as noted in section 5) is greater than the potential $8.4 billion cost if the Bill 124 legal challenge is successful as the FAO assumes that non-unionized employees would not receive compensation for wage growth restrictions that have applied since 2019.
[42] All dates refer to the second quarter of the calendar year.
[43] The job vacancy rate is the number of job vacancies expressed as a percentage of all occupied and vacant jobs.
[44] CBC News, “Sylvia Jones surfaces as pressure mounts amid staffing 'crisis' in Ontario hospitals,” August 2, 2022.
[45] CBC News, “Ontario is facing a teacher shortage. So why is it taking so long to certify new ones?” February 3, 2022.
[46] For long-term care, the Province has committed to build 30,000 new long-term care beds by 2028, and increase the average hours of daily direct care provided to residents from 2.75 hours per day to 4.0 hours per day by 2024-25 (See FAO, “Ministry of Long-Term Care: Spending Plan Review,” 2021). For home care, the Province has committed to invest an additional $1.0 billion over three years to expand home care (Government of Ontario, Ontario Investing $1 Billion More to Expand Home Care, April 25, 2022). For child care, as part of the commitment to provide $10-a-day child care, the Province has committed to add 71,000 net new child care spaces by 2026 (Government of Ontario, $13.2 Billion Child Care Deal will Lower Fees for Families, March 28, 2022).
[47] Government of Ontario, “Ontario Making Historic Investment in Provincial Nursing Workforce,” March 7, 2022.
[48] 2022 Ontario Budget, p. 117.
[49] Government of Ontario, “Ontario Introduces Plan to Stay Open: Health System Stability and Recovery,” August 18, 2022 and Toronto Star, “Ontario health minister urges faster approval of foreign-trained nurses and doctors,” August 4, 2022.
[50] Government of Ontario, “Ontario Expands Career Growth Opportunities for PSWs and Nurses in Long-Term Care,” October 27, 2021.
[51] Ibid., and 2022 Ontario Budget, p. 117.
[52] Toronto Star, “‘It’s going to bankrupt health care’: Spending on temp agency nurses up more than 550% since pre-pandemic at one Toronto hospital network,” August 16, 2022.
[53] As of September 12, 2022. For more information: https://www.lrs.labour.gov.on.ca/en/index.htm.


