

Table of Abbreviations
Abbreviation Long Form
- CIHI
- Canadian Institute for Health Information
- FAO
- Financial Accountability Office
- FES
- Fall Economic Statement (also known as the Ontario Economic Outlook and Fiscal Review)
- MOHLTC
- Ministry of Health and Long-Term Care
- OHIP
- Ontario Health Insurance Plan
- OMA
- Ontario Medical Association
- PSA
- Physician Services Agreement
- TBS
- Treasury Board Secretariat
1 | Essential Points
Context
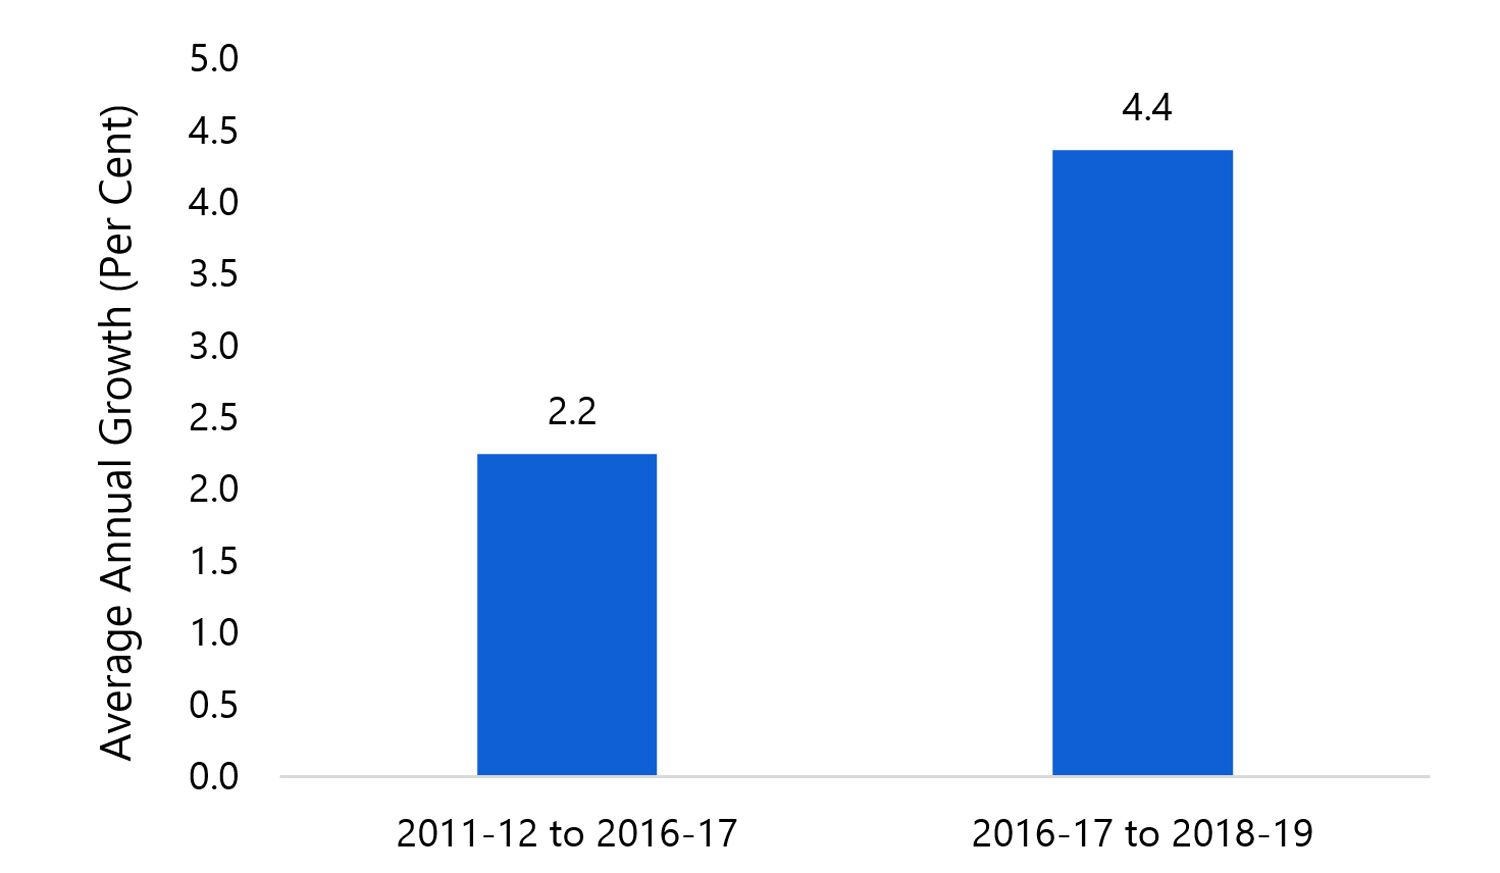
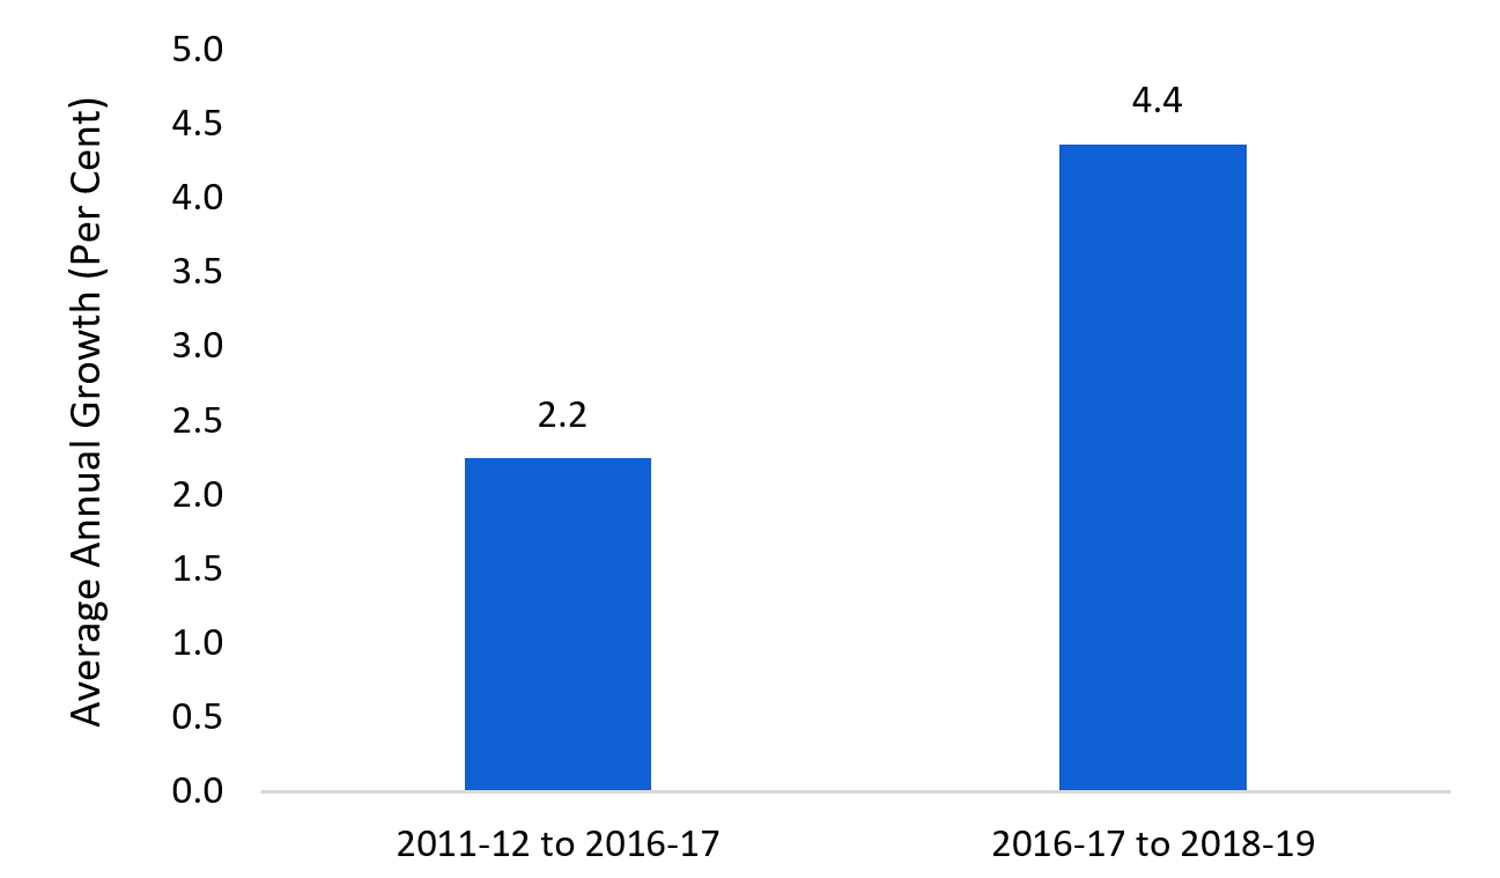
- After five years of fiscal restraint, Ontario’s health spending grew significantly over the past two years. From 2011-12 to 2016-17, health spending grew by an annual average of 2.2 per cent, while between 2016-17 and 2018-19, health spending growth doubled to 4.4 per cent on average. The most significant increases in funding growth rates were for Ontario drug programs, hospitals, long-term care homes and community programs.
Average annual growth in Ontario’s health spending doubled over the past two years
Source: FAO analysis of data from MOHLTC, TBS, the 2018 Fall Economic Statement and the February 19, 2019 Kaplan Board of Arbitration decision on physician compensation.
Accessible version
This chart shows the average annual growth of health spending in Ontario from 2011-12 to 2016-17 and from 2016-17 to 2018-19. Between 2011-12 and 2016-17, health spending grew on average by 2.2 per cent. Between 2016-17 and 2018-19, health spending grew on average by 4.4 per cent.- Despite recent funding increases, Ontario’s health system is facing numerous challenges. Both Health Quality Ontario and the ‘Premier’s Council on Improving Health Care and Ending Hallway Medicine’ have identified hospital capacity issues, wait times and system coordination as key issues facing the Province’s health care system.
The new physician services agreement
- On February 19, 2019, the binding arbitration decision concerning the Province and the Ontario Medical Association (OMA) on a new physician services agreement was announced. The FAO estimates that the arbitration decision will increase physician compensation by a net total of $1.5 billion over the four-year term of the agreement, from 2017-18 to 2020-21. For more details, see chapter 4.
Health sector spending over the medium-term
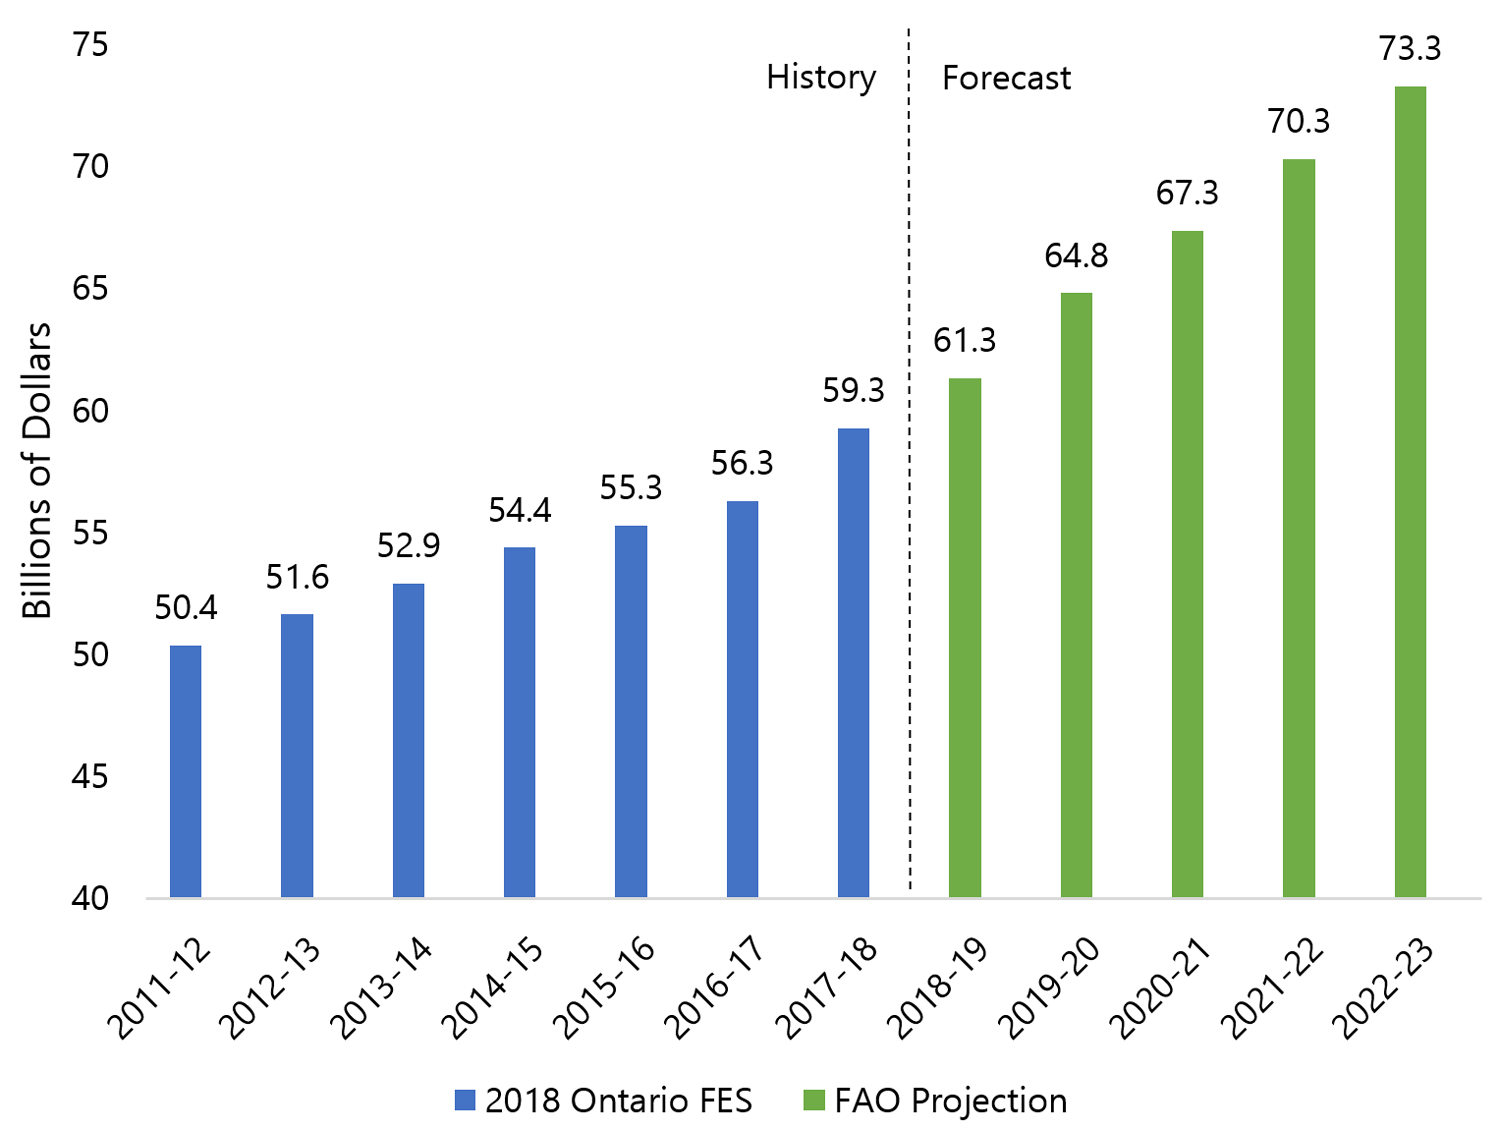
- The FAO updated its status quo medium-term projection for health sector spending, which represents the forecast for Ontario health sector expense without anticipating any new government program decisions.[1] The FAO projects that health sector spending would rise from $61.3 billion in 2018-19 to $73.3 billion in 2022-23, an increase of $12.0 billion. This represents a 4.6 per cent average annual growth rate in health spending from 2018-19 to 2022-23.
FAO status quo health sector spending projection ($ billions)
Source: 2018 Fall Economic Statement and FAO.
Accessible version
This chart shows a history and FAO projection of health sector spending between 2011-12 and 2022-23. Health sector spending grew from $50.4 billion in 2011-12 to $54.4 billion in 2014-15 and continued to grow to $59.3 billion in 2017-18. Health sector spending is expected to be $61.3 billion in 2018-19, $67.3 billion in 2020-21 and $73.3 billion in 2022-23.The FAO’s health spending projection reflects three key factors.
- Core health care cost drivers (population growth, population aging and health sector inflation) are expected to increase to 4.5 per cent annually from 2018-19 to 2022-23, compared to an annual growth rate of 3.8 per cent from 2011-12 to 2018-19. The increase is primarily due to higher inflation over the projection, along with a modestly higher rate of population growth and aging.
- Recent government policy decisions are adding to health care expense over the outlook, including the commitment to add 15,000 long-term care beds over five years, as well as the investment of $1.9 billion in mental health over ten years.
- The FAO estimates that the new physician services agreement will add a net $1.5 billion to health spending from 2017-18 to 2020-21.
Transforming health care and balancing the budget without revenue increases will be a significant challenge
- In the 2018 Fall Economic Statement, the Province committed to “balance the budget on a modest, reasonable and pragmatic timetable” without raising taxes.[2] Health sector expense comprises 41 per cent of total program spending. As such, balancing the budget without raising taxes will require very significant changes to Ontario’s health care system.
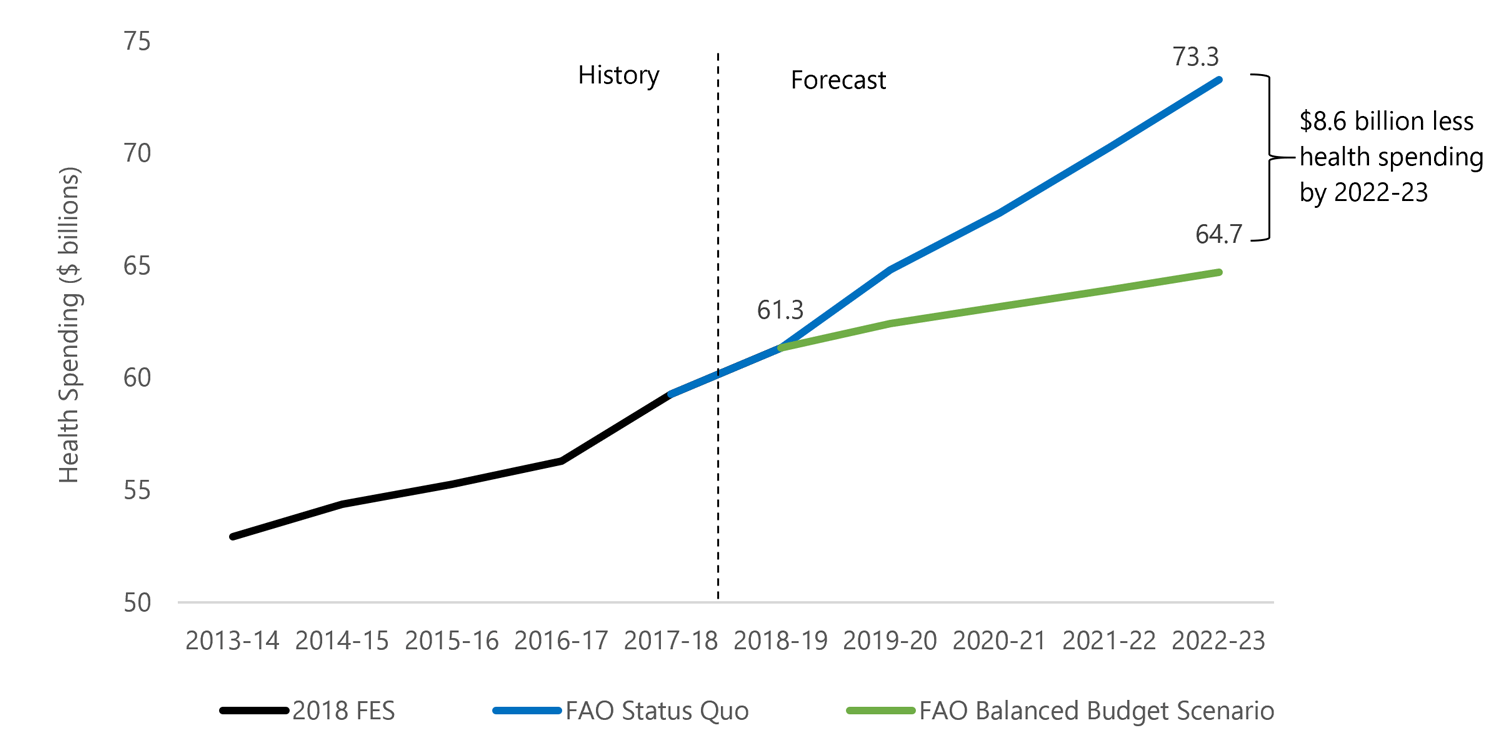
- In the FAO’s most recent budget outlook,[3] a scenario was presented that eliminated Ontario’s deficit over the next four years exclusively through spending restraint. Under this scenario, health spending would need to be $8.6 billion below the FAO’s status quo projection by 2022-23.
Balancing the budget without raising new revenue would require spending $8.6 billion less on health care by 2022-23
Source: 2018 Fall Economic Statement and FAO.
Accessible version
This chart shows a history and FAO projection of Ontario health care spending between 2013-14 and 2022-23. This chart shows that the FAO forecasts health care spending to be $61.3 billion in 2018-19 and $73.3 billion in 2022-23. It highlights that by 2022-23 health care spending would need to grow to only $64.7 billion, a figure which is $8.6 billion lower than what it is projected, to balance the budget by 2022-23.- Restraining health sector spending to this extent without compromising health care access or quality would be a significant challenge. Policy changes of this magnitude could have wide-ranging implications for Ontario’s health care system, and Ontarians would benefit from an informed debate on the Province’s budget objectives and the trade-offs necessary to achieve them.
2 | Introduction and Context
Health spending is 41 per cent of total program spending in 2018-19
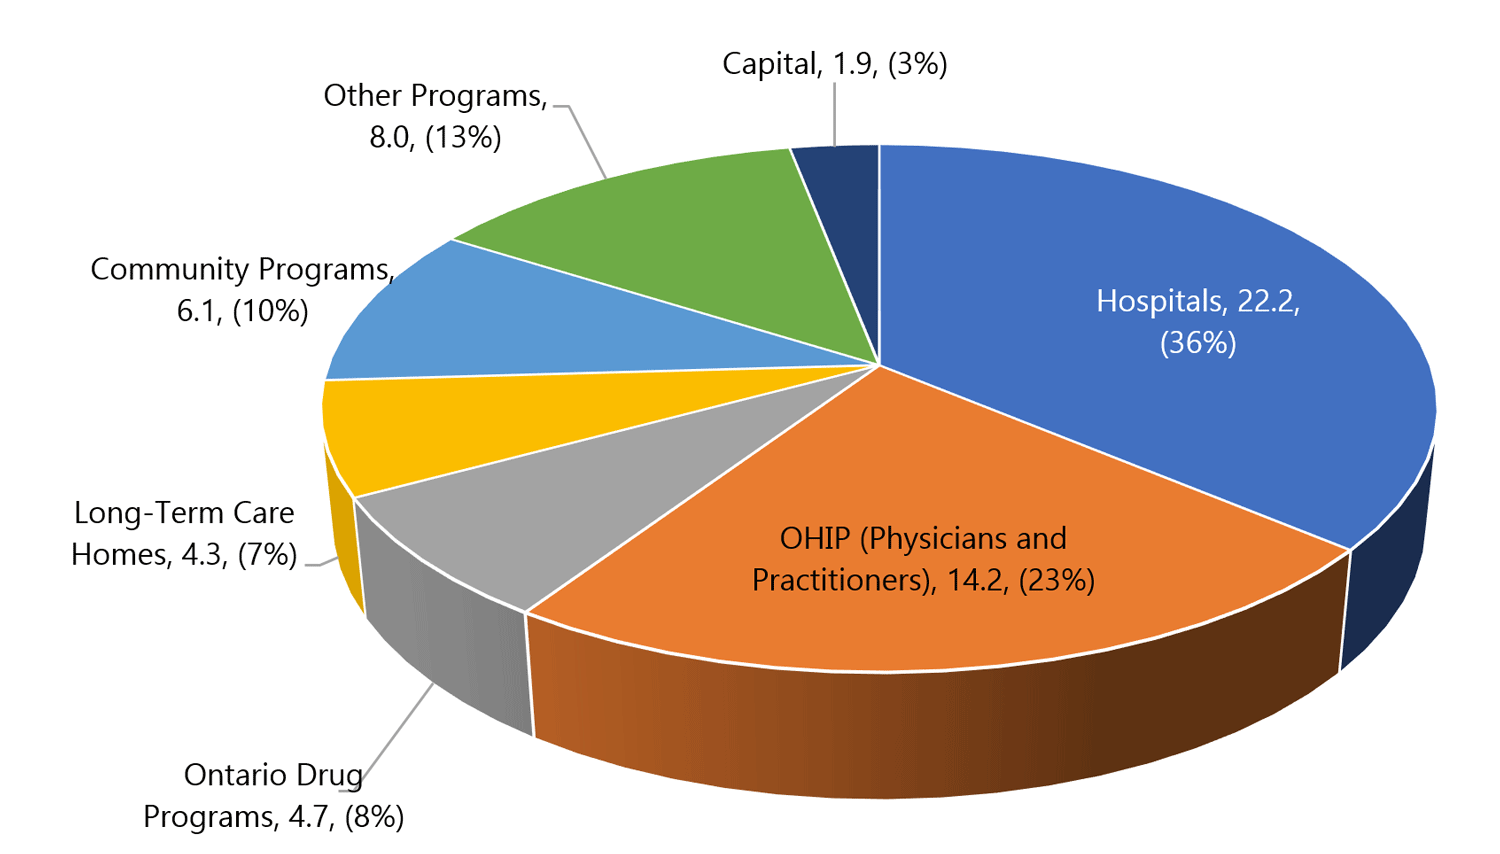
The health sector is the largest expense item in the Ontario Budget. The FAO projects that health sector expense will reach $61.3 billion in 2018-19, which is 41 per cent of total program spending.[4] The Province divides the health sector into seven program areas. The largest program areas are hospitals and the Ontario Health Insurance Plan (OHIP), which account for almost 60 per cent of total health sector spending in 2018-19.
2.1Health sector expense by program area, 2018-19 ($ billions)
Source: FAO analysis of data from MOHLTC, TBS, the 2018 Fall Economic Statement and the February 19, 2019 Kaplan Board of Arbitration decision on physician compensation.
Accessible version
This chart breaks down Ontario’s total health sector expenses by program area in 2018-19. Of total health sector expenses, the Hospitals program area accounts for $22.2 billion or 36 per cent, the OHIP program area accounts for $14.2 billion or 23 per cent, the Community Programs program Area accounts for $6.1 billion or 10 per cent, the Ontario Drug Programs program area accounts for $4.7 billion or 8 per cent, the Long-Term Care Homes Program Area accounts for $4.3 billion or 7 per cent, the Other Programs program area accounts for $8 billion or 13 per cent and capital spending accounts for $1.9 billion or 3 per cent of health sector expenses.After five years of restraint, health spending grew significantly in 2017-18 and 2018-19
Health sector spending grew by 5.3 per cent in 2017-18 and is projected to grow by 3.5 per cent in 2018-19. This represents a significant increase in health sector expense growth when compared with the period of fiscal restraint that occurred between 2011-12 and 2016-17.
2.2Average annual growth in Ontario’s health spending doubled over the past two years
Source: FAO analysis of data from MOHLTC, TBS, the 2018 Fall Economic Statement and the February 19, 2019 Kaplan Board of Arbitration decision on physician compensation.
Accessible version
This chart shows the average annual growth of health spending in Ontario from 2011-12 to 2016-17 and from 2016-17 to 2018-19. Between 2011-12 and 2016-17, health spending grew on average by 2.2 per cent. Between 2016-17 and 2018-19, health spending grew on average by 4.4 per cent.Despite recent funding increases, Ontario’s health system is facing numerous challenges
According to Health Quality Ontario, many aspects of the health of Ontario’s population are improving. “However, while there are bright spots scattered throughout the health system, an aging population and more people with complex health needs means many parts of the system are under increased strain.”[5]
In particular, the waitlist for a long-term care placement in Ontario has increased from 22,601 in 2015 to 32,835 in 2018.[6] The cost of a patient occupying a hospital bed is more than four times the cost of a patient in long-term care, and the growing waitlist has resulted in more patients occupying hospital beds while waiting to go to a long-term care facility.
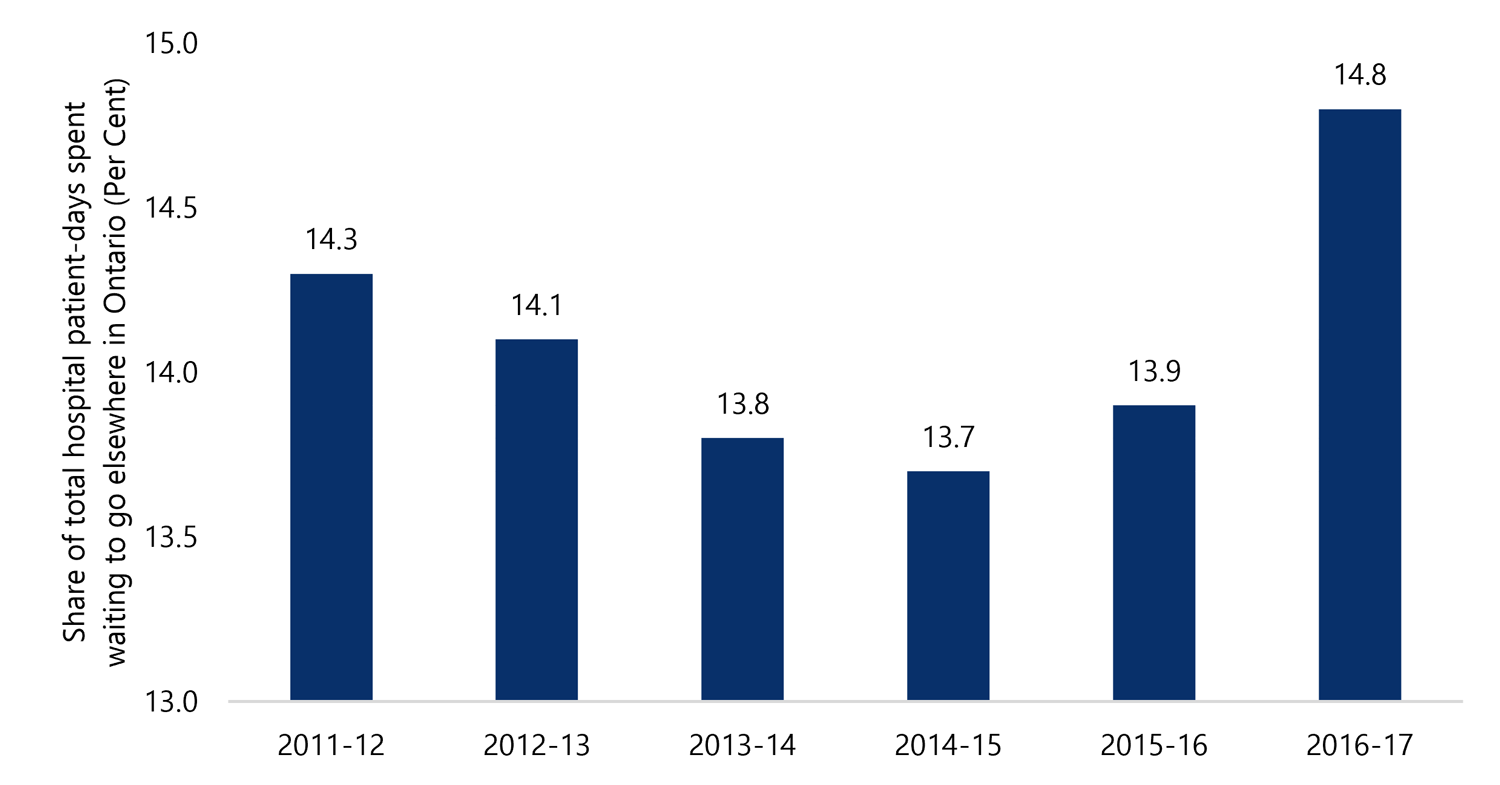
The number of days spent by patients in Ontario hospitals waiting to go elsewhere reached a six-year high of 14.8 per cent in 2016-17. This is “the equivalent of more than 10 large hospitals being occupied every day by patients waiting for care elsewhere.”[7]
2.3Hospital patients are spending more time waiting to go elsewhere
Source: Health Quality Ontario.
Accessible version
This chart shows the share of total hospital patient-days spent waiting to go elsewhere in Ontario between 2011-12 and 2016-17. The share waiting to go elsewhere was 14.3 per cent in 2011-12, 14.1 per cent in 2012-13, 13.8 per cent in 2013-14, 13.7 per cent in 2014-15, 13.9 per cent in 2015-16 and 14.8 per cent in 2016-17.High volumes of visits to emergency departments are also placing strain on hospitals. Emergency department visits have increased 11.3 per cent since 2011-12 and wait times reached a six-year high in 2017-18.[8] Ontario’s growing population, a lack of timely access to primary care and the ongoing opioid crisis are all contributing factors to growing emergency room wait times.[9] As a result of these and other factors, many Ontario hospitals have regularly reported being over 100 per cent capacity.[10]
On October 3, 2018, the Province established the ‘Premier’s Council on Improving Health Care and Ending Hallway Medicine’. This 11-member council has a mandate to “recommend a strategic long-term vision for health care in Ontario.”[11] The council will also develop a capacity plan and an approach to long-term funding. The Province is looking to the council to recommend actions that will ease pressure on the health sector and help to direct the Province’s health sector investments.
On January 31, 2019, the council released an interim report which outlined capacity issues, wait times and system coordination as key issues facing the Province’s health care system. The council plans to provide recommendations and advice to the Province on how to improve the Ontario health sector in future reports.[12]
After four years without a contract, the Province and Ontario’s doctors have reached a new agreement through binding arbitration
On February 19, 2019, the binding arbitration decision concerning the Province and the Ontario Medical Association (OMA) on a new physician services agreement was announced. The new agreement covers a period of four years from April 1, 2017 to March 31, 2021 and includes:
- physician fee rate increases (averaging one per cent each year),
- the reversal of physician fee reductions made in 2013 and 2015,
- a mandate that $480 million in annual savings be identified, and
- no cap in the physician services budget.
The purpose and structure of this report
The Province has not released a projection for health sector spending beyond 2018-19. However, in the 2018 Ontario Economic Outlook and Fiscal Review (also known as the Fall Economic Statement or FES) the Province outlined its commitment to transform the health sector by addressing hospital capacity pressures, wait times for long-term care and access to mental health and addictions services.[13] In addition, the Province has committed to balancing the budget “on a modest, reasonable and pragmatic timetable” and without raising taxes.[14] To support Members of Provincial Parliament and the public in evaluating health sector spending in the upcoming 2019 Ontario Budget, this report provides an updated budgetary assessment of the Province’s health sector.
Chapter 3 analyzes how health sector spending in 2017-18 and 2018-19 is allocated across program areas, and reviews program area growth rates. The chapter also discusses how recent policy changes and developments have impacted health spending in 2017-18 and 2018-19.
Chapter 4 presents the FAO’s estimated cost of the arbitration decision on physician compensation that was announced on February 19, 2019.
Chapter 5 outlines the FAO’s medium-term health spending projection, which does not assume any further policy changes by the Province.[15] It discusses the outlook for the core cost drivers of health spending, including population growth, population aging and price inflation, as well as the budget implications of recent policy changes and developments in the health sector over the outlook. Lastly, based on the government’s commitment to achieve a balanced budget without raising new revenue, the chapter presents a scenario that eliminates Ontario’s current deficit over the next four years exclusively through spending restraint, and explores the potential implications of this scenario on health spending in Ontario.
Appendix B provides more information on the development of this report.
3 | Changes in Health Sector Spending, 2017-18 and 2018-19
This chapter reviews the heath sector funding changes for fiscal years 2017-18 and 2018-19 that have occurred since the FAO last reported on the sector in March 2018 and discusses program area growth rates.
New health sector spending in 2017-18 and 2018-19
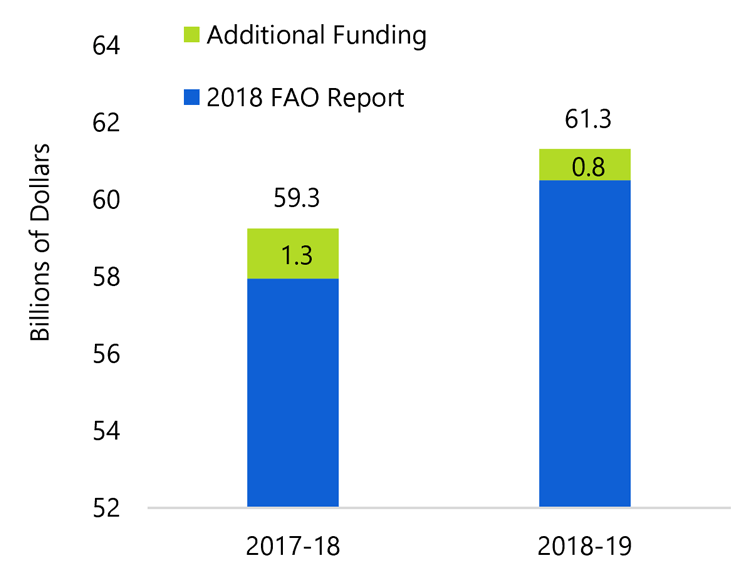
Since the FAO’s last health sector report, total health sector expense increased by a combined $2.1 billion in 2017-18 and 2018-19. Significant funding changes include the following:
3.1Total health sector expense increased strongly in 2017-18 and 2018-19
Source: FAO analysis of data from MOHLTC, TBS and the 2018 FES.
Accessible version
This chart shows total health sector expenses in 2017-18 and 2018-19 broken down by the 2018 FAO health report projections, and additional funding used. In 2017-18, health sector expenses were $59.3 billion, $1.3 billion higher than what the FAO projected in the 2018 health sector report. In 2018-19, health sector expenses are now projected to be $61.3 billion, $0.8 billion higher than what the FAO had forecasted in the 2018 health sector report.- hospitals received over $900 million, largely for base operating funding,
- OHIP spending increased by a net $168 million, which includes the impact of the binding arbitration decision regarding physician compensation announced on February 19, 2019[16], and
- child and youth mental health services was transferred from the Ministry of Children and Youth Services to the Ministry of Health and Long Term-Care, increasing health sector expense by $360 million in 2017-18 and $440 million in 2018-19.
| ($ millions) | 2017-18 | 2018-19 | Total |
|---|---|---|---|
| Hospitals | 353 | 559 | 912 |
| OHIP (Physicians and Practitioners) | 661 | (493) | 168 |
| Ontario Drug Programs | (0) | 122 | 122 |
| Long-Term Care Homes | (10) | 22 | 13 |
| Community Programs | (304) | 154 | (151) |
| Other Programs | 874 | 692 | 1,566 |
| Capital | (266) | (248) | (514) |
| Health Sector | 1,307 | 808 | 2,116 |
Expense growth rates have increased in most program areas
Compared to the previous five years of fiscal restraint, almost all health care program areas have seen increased funding in 2017-18 and 2018-19, which has resulted in higher overall expense growth for the sector. The most significant increases in funding growth rates were for Ontario drug programs, hospitals, long-term care homes and community programs.
3.3Health spending growth has increased in most program areas
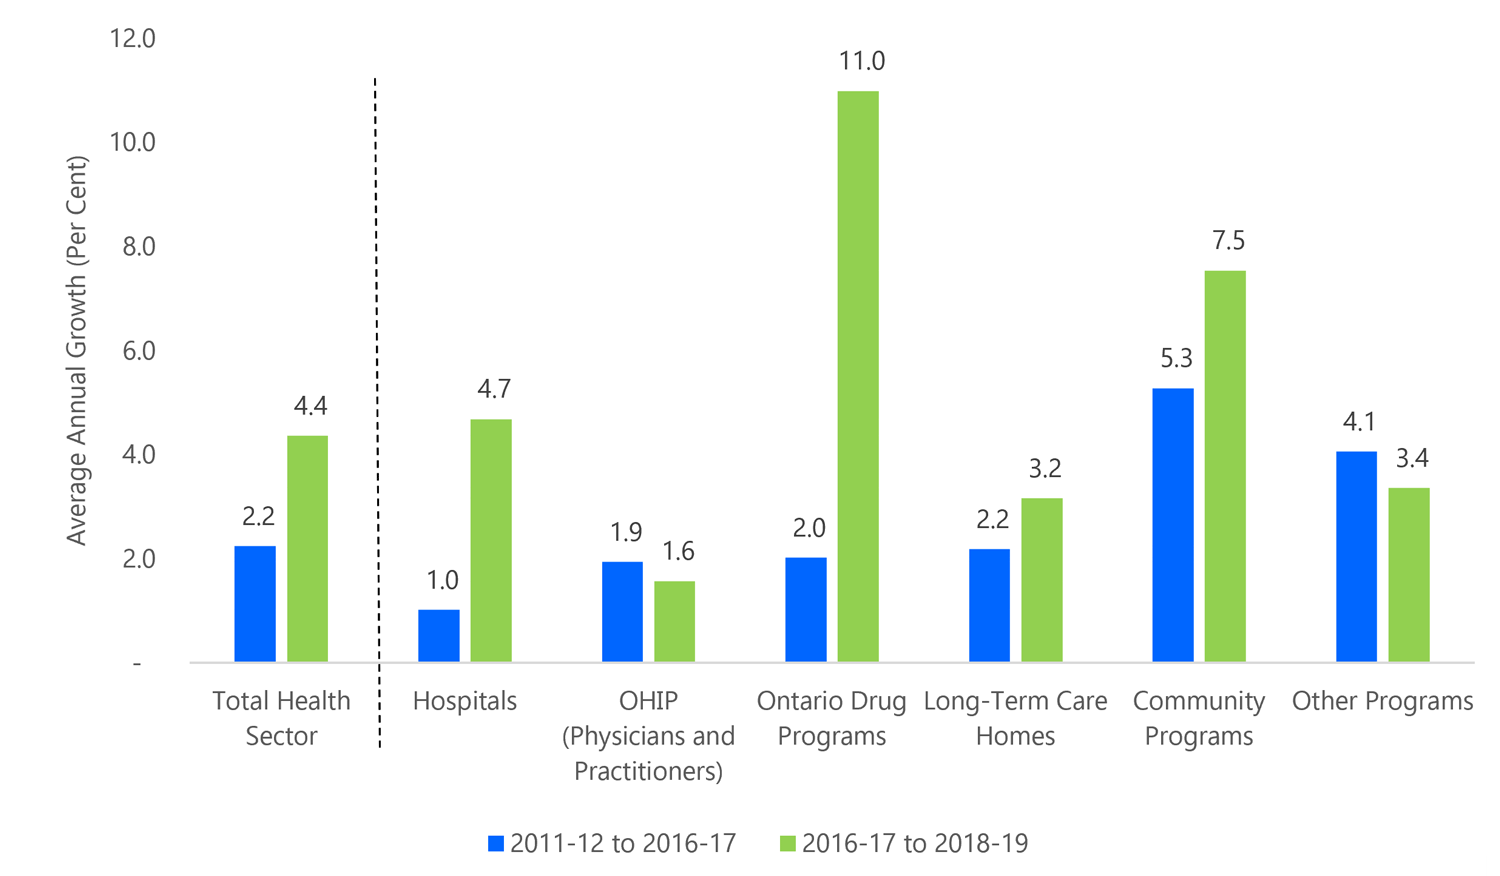
Note: Health capital spending grew by 4.6 per cent from 2011-12 to 2016-17 and by 4.7 per cent from 2016-17 to 2018-19.
Source: FAO analysis of data from MOHLTC, TBS, the 2018 Fall Economic Statement and the February 19, 2019 arbitration decision on physician compensation.
Accessible version
This chart shows the average annual growth of Ontario health sector spending categorized by sector from 2011-12 to 2016-17 and from 2016-17 to 2018-19. Total health sector spending grew on average by 2.2 per cent between 2011-12 and 2016-17 and 4.4 per cent between 2016-17 and 2018-19. Hospital sector spending grew on average by 1 per cent between 2011-12 and 2016-17 and 4.7 per cent between 2016-17 and 2018-19. OHIP sector spending grew on average by 1.9 per cent between 2011-12 and 2016-17 and 1.6 per cent between 2016-17 and 2018-19. The Ontario Drug Programs spending grew on average by 2 per cent between 2011-12 and 2016-17 and 11 per cent between 2016-17 and 2018-19. Long-Term Care Homes sector spending grew on average by 2.2 per cent between 2011-12 and 2016-17 and 3.2 per cent between 2016-17 and 2018-19. Community Program sector spending grew on average by 5.3 per cent between 2011-12 and 2016-17 and 7.5 per cent between 2016-17 and 2018-19. Other Programs grew on average by 4.1 per cent between 2011-12 and 2016-17 and 3.4 per cent between 2016-17 and 2018-19.- For hospitals, average annual expense growth increased from 1.0 per cent during the 2011-12 to 2016-17 period to 4.7 per cent in 2017-18 and 2018-19, primarily due to increases in base operating funding.[17]
- For OHIP, average annual expense growth decreased from 1.9 per cent during the 2011-12 to 2016-17 period to 1.6 per cent in 2017-18 and 2018-19. The 1.6 per cent growth rate reflects the binding arbitration decision regarding physician compensation, including the partial reversal of a provisional expense recorded by the Province in 2017-18 (see chapter 4 for more details).[18]
- For Ontario drug programs, average annual expense growth increased from 2.0 per cent during the 2011-12 to 2016-17 period to 11.0 per cent in 2017-18 and 2018-19, primarily due to the introduction of OHIP+.[19] OHIP+ added an estimated $365 million or 7.5 per cent to Ontario drug programs expenditures in 2018-19.
- For long-term care homes, annual average expense growth increased from 2.2 per cent during the 2011-12 to 2016-17 period to 3.2 per cent in 2017-18 and 2018-19.
- For community programs, annual average spending growth increased from 5.3 per cent during the 2011-12 to 2016-17 period to 7.5 per cent in 2017-18 and 2018-19, primarily due to the Province adding approximately 800 home and community care spaces in 2017-18.
- For other programs, annual average spending growth decreased from 4.1 per cent during the 2011-12 to 2016-17 period to 3.4 per cent in 2017-18 and 2018-19.
Recent policy decisions have modestly affected 2018-19 health spending
The 2018 Fall Economic Statement included three policy decisions which have a modest effect on the 2018-19 health sector expense forecast but will have a larger impact on health sector expense in future years.
Winding down the Self-Directed Personal Support Services Ontario agency
The 2018 FES announced that the Self-Directed Personal Support Services Ontario agency will be wound down.[20] This agency was established as part of “Ontario’s Action Plan for Seniors” to allow eligible home care clients who require 14 hours or more of personal support services per week to select and schedule their own personal support workers within a Provincially allocated budget. The agency would have shifted the provision of some home care services to the Province from private enterprises and not-for-profits that currently provide the services. The agency launched in the spring of 2018 and was not currently providing any services.
Reforming OHIP+ to only cover youth without pre-existing drug plans
On January 1, 2018 the Province launched OHIP+ which expanded the Ontario Drug Benefit Program to cover all Ontarians under the age of 25. The Province announced that beginning in March 2019, OHIP+ would be reformed to only cover children and youth without existing prescription drug benefit plans. The reformed OHIP+ plan would only provide coverage to the approximately 25 per cent[21] of Ontarians under the age of 25 who do not have access to prescription drug coverage. The estimated cost of OHIP+ in the 2018 Ontario Budget was $365 million annually and the Province estimates that OHIP+ reform will provide annual savings of at least $250 million compared to the 2018 budget.[22] As the OHIP+ reform is not taking effect until March 2019, it will only provide significant savings in future years.
Removing Extended Health Benefits
The 2018 Ontario Budget announced a new drug and dental insurance plan to cover all Ontarians without an extended health plan. In addition, the 2018 budget announced the removal of the deductible and co-payments that were being paid by seniors for drugs under the OHIP+ program. Both changes were scheduled to begin in the 2019-20 fiscal year, and combined, would have cost $1.1 billion annually by 2020-21. Although the Province has not formally announced the cancellation of these two programs, the government stated in the 2018 Fall Economic Statement that new programs introduced in the 2018 Ontario Budget have been cancelled, unless noted otherwise.[23] Consequently, the FAO has removed all estimated costs relating to these programs from its health sector expense forecast.
4 | The New Physician Services Agreement
On February 19, 2019, the binding arbitration decision concerning the Province and the Ontario Medical Association (OMA) on a new physician services agreement was announced. This chapter outlines the FAO’s preliminary estimate of the new agreement’s impact on OHIP spending over the four-year term of the agreement.
The FAO estimates that the arbitration decision will increase physician compensation by $83 million in 2017-18, $230 million in 2018-19, $710 million in 2019-20 and $472 million in 2020-21, for a cumulative total of $1.5 billion.[24] Importantly, the Province recorded a provisional expense of $713 million in 2017-18 in anticipation of the arbitration decision, including a potential retroactive compensation component.[25] Based on the FAO’s review of the February 19 decision, retroactive compensation will only total $313 million, resulting in a $400 million negative expense adjustment in 2018-19.[26]
| ($ millions) | 2017-18 | 2018-19 | 2019-20 | 2020-21 | Total |
|---|---|---|---|---|---|
| Impact on physician compensation | 83 | 230 | 710 | 472 | 1,496 |
| Impact on Provincial OHIP expense | 713 | -400 | 710 | 472 | 1,496 |
Background: how physicians are compensated in Ontario
In 2018-19, OHIP spending is projected to reach $14.2 billion, 84 per cent of which the FAO estimates is payments to physicians in Ontario (the “physician services budget”).[27] There are two primary ways Ontario’s physicians are compensated.
- Fee for service payments: where physicians submit claims for payment for each service they provide as listed on the “schedule of benefits”.[28]
- Non-fee for service compensation: where physicians are compensated through other payment arrangements, such as enrollment models where physicians are paid for each patient on their “roster”.[29]
Under the Ontario Health Insurance Plan, the Province pays for insured services on behalf of Ontarians. The terms of the plan, including covered services and payment rates, are set out in the Health Insurance Act and its regulations (including the schedule of benefits). The physician services agreement (PSA) governs the relationship between the Province and the Ontario Medical Association (OMA) which represents Ontario’s doctors. Each PSA includes agreed changes to physician compensation which is then reflected in the schedule of benefits. The last physician services agreement expired on March 31, 2014 and, with the results of binding arbitration announced on February 19, 2019, a new four-year physician services agreement is set to begin with a retroactive start date to April 1, 2017.
Review of the arbitration decision
On February 1, 2019 the Kaplan Board of Arbitration released phase one of its decision which included four main components.
- Global fee increases: Ontario doctors were awarded annual increases to physician fees effective April 1 of each year from 2017 to 2020. Overall, the arbitration panel awarded global fee increases that average 1.0 per cent per year over four years.
- Reversal of physician fee reductions: Under the 2012 Physician Services Agreement, physician payments were reduced by 0.5 per cent on April 1, 2013. After the expiry of the 2012 agreement, and without a new physician services agreement, the Province reduced physician fee for service payments by a combined 3.95 per cent and non-fee for service payments by 2.65 per cent in 2015. The arbitration panel mandated that on April 1, 2019 the fee reductions will be but without retroactive effect.[30]
| Global Fee Increases | |
|---|---|
| April 1, 2017 | 0.75% |
| April 1, 2018 | 1.25% |
| April 1, 2019 | 1.00% |
| April 1, 2020 | 1.00% |
| 2015 fee for service discount reversal | |
| April 1, 2019 | 3.95% |
| 2015 non-fee for service discount reversal | |
| April 1, 2019 | 2.65% |
- A mandate to find $480 million in annual savings: The arbitration panel directed that the OMA and the Province form a bilateral committee to achieve $100 million[31] in savings starting in the 2019-20 fiscal year (annualizing to $120 million), and an additional $360 million in annual savings starting in the 2020-21 fiscal year (for a cumulative total of $480 million in annual savings from the physician services budget). The savings are to be achieved by “eliminating or restricting inappropriate or overused physician services, or physician payments.”[32] If the Province and the OMA cannot agree on how to achieve the required savings, then the arbitration panel will hold additional hearings to identify the savings. As such, the FAO has included the $480 million in total annual savings in its OHIP expense forecast.
- No cap in the physician services budget: The Province proposed that a “hard cap” be placed on the total physician services budget. A hard cap would have limited payments to physicians in any year in which the physician services budget total had been reached. The arbitration panel rejected the request, noting that the Province is responsible for the physician services budget, including what services are insured under the Ontario Health Insurance Plan and the utilization by Ontarians of the insured services. However, the arbitration panel noted that there is “self-evidently a real opportunity to achieve significant changes” that would result in savings to the physician services budget.[33] As a result, the arbitration panel mandated that $480 million in annual savings be identified (see paragraph above for details).
5 | Health Sector Spending over the Medium-Term
This chapter outlines the FAO’s status quo medium-term projection for health sector spending, which represents the forecast for Ontario health sector expense without anticipating any new government program decisions.[34] The FAO projects that health sector spending would rise from $61.3 billion in 2018-19 to $73.3 billion in 2022-23, an increase of $12.0 billion. This represents a 4.6 per cent average annual growth rate in health spending from 2018-19 to 2022-23.
5.1 FAO status quo health sector spending projection ($ billions)
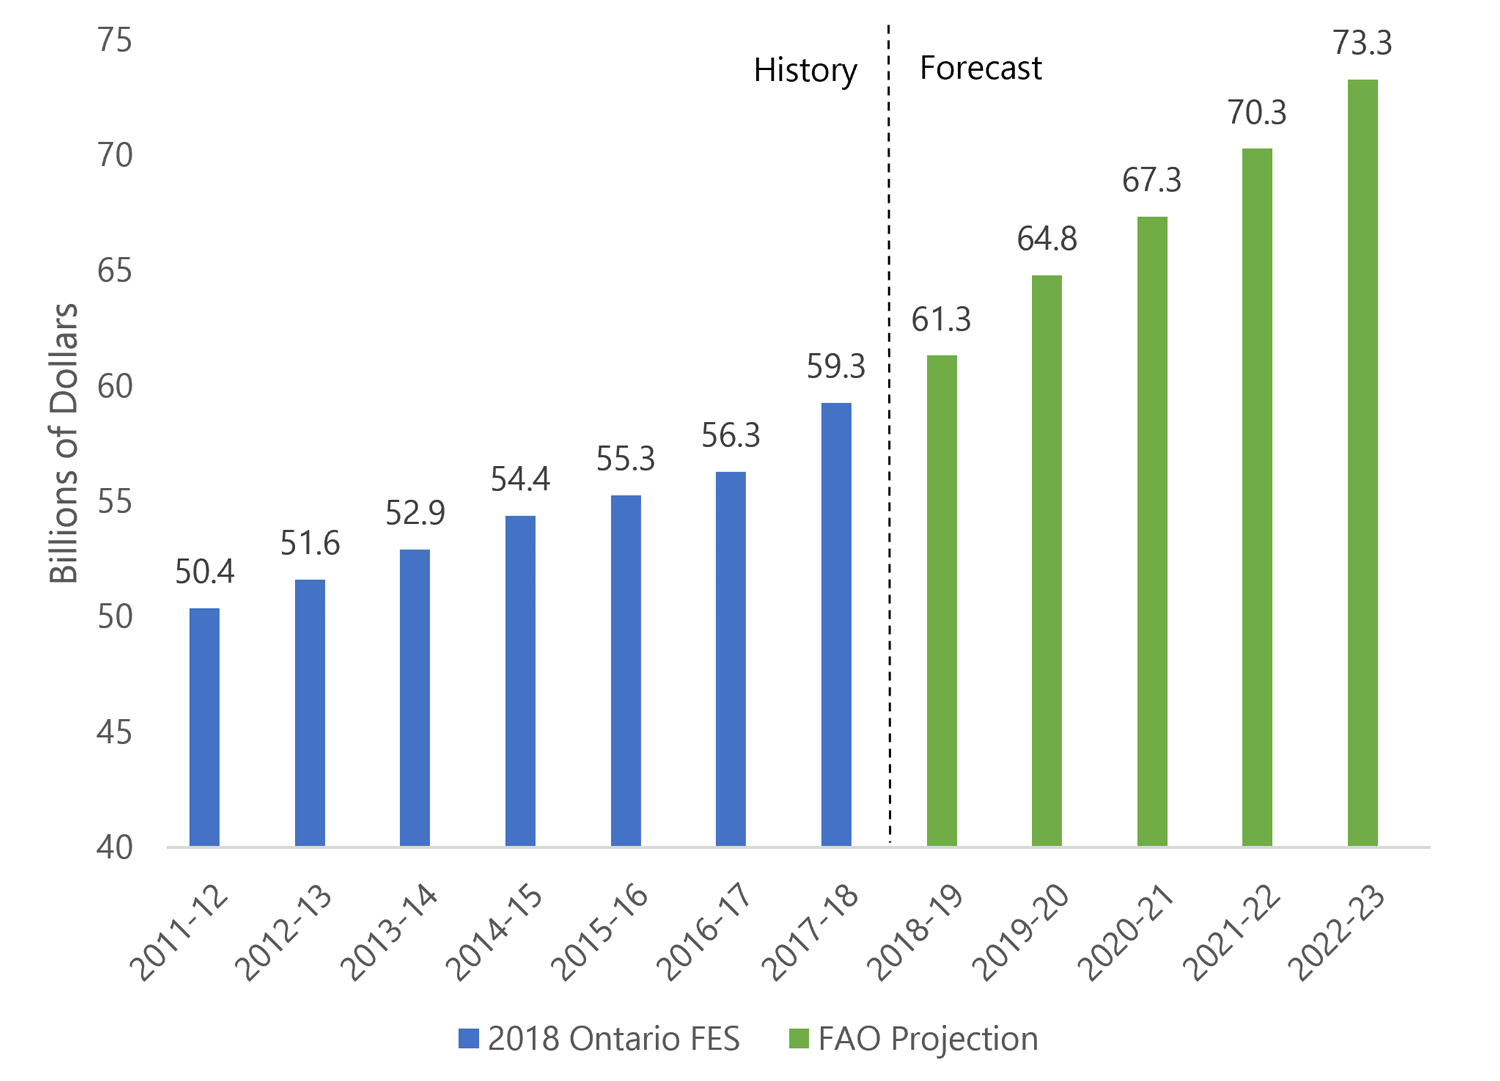
Source: 2018 Fall Economic Statement and FAO.
Accessible version
This chart shows a history and FAO projection of health sector spending between 2011-12 and 2022-23. Health sector spending grew from $50.4 billion in 2011-12 to $54.4 billion in 2014-15 and continued to grow to $59.3 billion in 2017-18. Health sector spending is expected to be $61.3 billion in 2018-19, $67.3 billion in 2020-21 and $73.3 billion in 2022-23.The FAO projection incorporates:
- the FAO’s outlook for health care demand and rising costs (the core health care cost drivers),
- recent government policy decisions affecting health care services and their costs, without anticipating any new government program decisions, and
- the FAO’s estimated cost of the recent arbitration decision for physician compensation.
These three components are discussed in further detail below.
Health care cost drivers are accelerating over the medium term
The FAO expects that health care cost drivers will put increasing upward pressure on annual health sector expense over the projection period. The FAO’s core drivers of health care expense include population growth, population aging and price inflation.
- Population growth: As the population grows, more people require health care services. Ontario experienced rapid population growth in 2017 and 2018.[35]
- Population aging: The average annual public health care expenditure for a 50-year-old in Ontario is $3,100. It is $6,400 for a 65-year-old, and over $22,000 for an 85-year-old. Ontario’s aging population will put increasing pressure on health care spending, as the large baby boom cohort begins to require significantly more health care services.[36]
- Higher prices for health care services: Since health care delivery is more labour intensive than other sectors of the economy, health care prices typically rise at a faster pace than overall consumer prices.[37] The FAO expects that health inflation will average 2.3 per cent from 2019 to 2022.[38]
The FAO estimates that the core cost drivers will accelerate to 4.5 per cent annually from 2018-19 to 2022-23, placing significant upward pressure on health care spending. For comparison, from 2011-12 to 2018-19, core health care cost drivers grew by an annual average of 3.8 per cent. The increase is primarily due to higher inflation over the projection, along with a modestly higher rate of population growth and aging.
5.2 Core health care cost drivers are accelerating
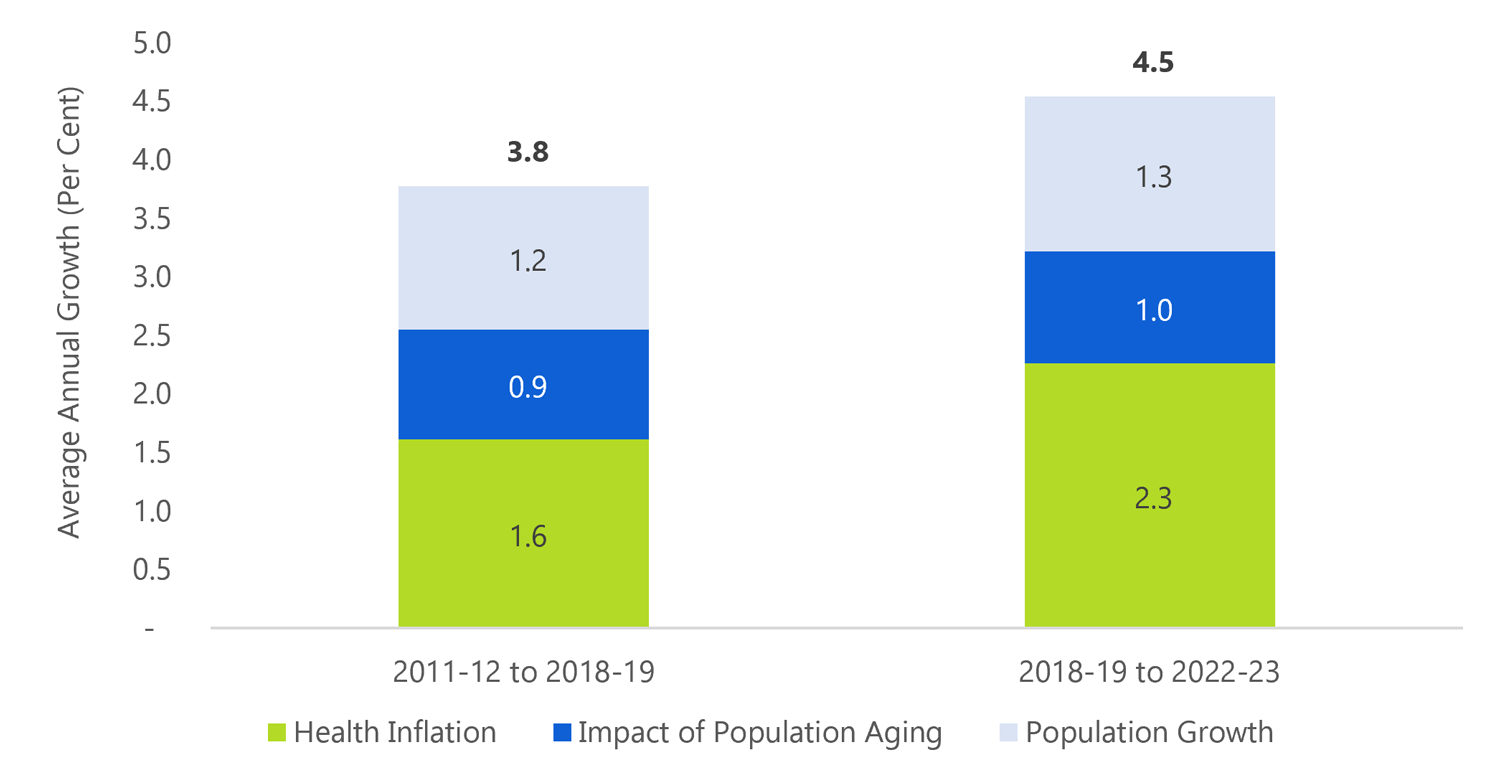
Source: 2018 Fall Economic Statement and FAO.
Accessible version
This chart shows the average annual growth of core health care cost drivers in Ontario from 2011-12 to 2018-19 and from 2018-19 to 2022-23. Between 2011-12 and 2018-19, on average, health inflation grew at 1.6 per cent, the impact of population aging grew at 0.9 per cent and population growth grew at 1.2 per cent. Between 2018-19 and 2022-23, on average, health inflation is expected to grow at 2.3 per cent, the impact of population is expected to grow at 1.0 per cent and the population growth is expected to grow at 1.3 per cent.Policy announcements are targeting priority areas, but at additional cost
Although the Province has not provided a budget projection or outlined its comprehensive strategy to address health sector issues, the Province has provided details on two significant spending commitments.
Immediate addition of 6,000 long-term care beds as part of a commitment to add 15,000 long-term care beds over five years
The immediate addition of 6,000 beds represents an annual spending commitment of over $300 million, and the FAO estimates that by 2022-23, this commitment will require an annual increase in long-term care homes expense of over $700 million.[39]
Investment of $1.9 billion in mental health over ten years
The Province has outlined an investment of $1.9 billion over ten years in mental health services. The investment will match the 10-year investment that the federal government announced in March of 2017.[40]
Ontario’s physicians awarded compensation increases
The FAO estimates that the February 19, 2019 arbitration decision on a new physician services agreement will increase OHIP expense by a net $1.5 billion between 2017-18 and 2020-21. After the expiration of the agreement on March 31, 2021, the FAO assumes that physician fees would increase by 1.0 per cent per year for the remaining two years of the projection, which matches the four-year annual average global fee increase in the new agreement.
FAO status quo forecast by program area
The FAO projects that given existing policies, and without anticipating any new government program decisions, health sector expenditures would increase from $61.3 billion in 2018-19 to $64.8 billion in 2019-20 and would reach $73.3 billion by 2022-23. This represents an annual average growth rate of 4.6 per cent from 2018-19 to 2022-23.
| 2018-19 | 2019-20 | 2020-21 | 2021-22 | 2022-23 | Average Annual Growth Rates | |
|---|---|---|---|---|---|---|
| ($ Billions) | (Per Cent, 2018-19 to 2022-23) | |||||
| Hospitals | 22.2 | 23.2 | 24.3 | 25.5 | 26.7 | 4.8% |
| OHIP | 14.2 | 15.7 | 15.8 | 16.3 | 16.8 | 4.2% |
| Ontario Drug Programs | 4.7 | 4.7 | 5.0 | 5.2 | 5.4 | 3.6% |
| Long-Term Care Homes | 4.3 | 4.8 | 5.1 | 5.5 | 5.9 | 8.2% |
| Community Programs | 6.1 | 6.2 | 6.6 | 7.0 | 7.3 | 4.6% |
| Other Programs | 8.0 | 8.2 | 8.5 | 8.8 | 9.1 | 3.4% |
| Capital | 1.9 | 1.9 | 2.0 | 2.0 | 2.1 | 3.2% |
| Total Health Sector | 61.3 | 64.8 | 67.3 | 70.3 | 73.3 | 4.6% |
The FAO projects that the highest spending growth rate would occur in the long-term care homes program area primarily due to the planned expansion of long-term care home beds. Growth in hospitals and community programs are largely driven by cost drivers (population growth and aging, and inflation). Growth in OHIP spending, at an average of 4.2 per cent per year, reflects the impact of the new physician services agreement and population growth and aging cost drivers. Finally, the relatively low projected spending growth in Ontario drug programs, at 3.6% growth per year on average, reflects announced changes to OHIP+.
Transforming health care and balancing the budget without revenue increases will be a significant challenge
The Province has committed to “balance the budget on a modest, reasonable and pragmatic timetable” without raising taxes.[41] The Province also committed to transform Ontario’s health care system and address hospital capacity issues, wait times for long-term care and access to mental health and addictions services.
In Ontario, health sector expense comprises 41 per cent of total program spending. As such, balancing the budget without raising taxes will require very significant changes to Ontario’s health care system. Health spending in the FAO’s status quo projection grows by 4.6 per cent on average from 2018-19 to 2022-23. This significantly outpaces the FAO’s current projection for revenue growth of 3.5 per cent per year over the outlook[42], placing additional strain on the budget deficit.
To explore the implications of achieving a balanced budget without raising new revenue, the FAO’s 2018 Fall Economic and Budget Outlook presented a scenario that eliminates Ontario’s deficit over the next four years exclusively through spending restraint. The FAO estimated that to balance the budget by 2022-23 through expense restraint alone, the government would need to limit program spending growth to 1.2 per cent per year on average from 2019-20 to 2022-23.
Under this scenario, health spending would need to be $8.6 billion below the FAO’s status quo projection by 2022-23, or roughly $560 less per Ontarian on average. For additional perspective, $8.6 billion is over half of the current OHIP budget ($14.2 billion), and almost as much as the Province currently spends on long-term care homes ($4.3 billion) and Ontario drug programs ($4.7 billion) combined.
5.4 Balancing the budget without raising new revenue would require spending $8.6 billion less on health care by 2022-23
Source: 2018 Fall Economic Statement and FAO.
Accessible version
This chart shows a history and FAO projection of Ontario health care spending between 2013-14 and 2022-23. This chart displays that the FAO forecasts health care spending to be $61.3 billion in 2018-19 and $73.3 billion in 2022-23. It highlights that by 2022-23 health care spending would need to grow to only $64.7 billion, a figure which is $8.6 billion lower than what it is projected, to balance the budget.Restraining health sector spending to this extent without compromising health care access or quality would be a significant challenge. Policy changes of this magnitude could have wide-ranging implications for Ontario’s health care system, and Ontarians would benefit from an informed debate on the Province’s budget objectives and the trade-offs necessary to achieve them.
6 | Appendices
Appendix A: Ontario Health Sector Expense by Program Area
| 2018 Fall Economic Statement | FAO Status Quo Projection | |||||||||||
|---|---|---|---|---|---|---|---|---|---|---|---|---|
| 2011-12 | 2012-13 | 2013-14 | 2014-15 | 2015-16 | 2016-17 | 2017-18 | 2018-19 | 2019-20 | 2020-21 | 2021-22 | 2022-23 | |
| Hospitals | 19.2 | 19.7 | 20.0 | 19.7 | 20.1 | 20.2 | 20.9 | 22.2 | 23.2 | 24.3 | 25.5 | 26.7 |
| Growth | 2.3% | 1.8% | -1.6% | 2.2% | 0.4% | 3.2% | 6.1% | 4.7% | 4.9% | 4.7% | 4.7% | |
| OHIP (Physicians and Practitioners) | 12.5 | 12.8 | 12.9 | 13.4 | 13.5 | 13.8 | 14.9 | 14.2 | 15.7 | 15.8 | 16.3 | 16.8 |
| Growth | 2.3% | 0.9% | 3.5% | 0.8% | 2.3% | 8.2% | -4.7% | 10.3% | 0.8% | 3.1% | 3.0% | |
| Ontario Drug Programs | 3.5 | 3.4 | 3.5 | 3.8 | 3.9 | 3.8 | 4.2 | 4.7 | 4.7 | 5.0 | 5.2 | 5.4 |
| Growth | -1.8% | 2.7% | 7.8% | 3.9% | -2.2% | 9.2% | 12.8% | -0.5% | 5.0% | 4.9% | 4.9% | |
| Long-Term Care Homes | 3.6 | 3.7 | 3.8 | 3.9 | 3.9 | 4.0 | 4.1 | 4.3 | 4.8 | 5.1 | 5.5 | 5.9 |
| Growth | 1.7% | 3.2% | 2.2% | 2.1% | 1.9% | 2.6% | 3.8% | 11.6% | 6.9% | 7.0% | 7.5% | |
| Community Programs | 4.1 | 4.3 | 4.5 | 4.8 | 5.0 | 5.2 | 5.3 | 6.1 | 6.2 | 6.6 | 7.0 | 7.3 |
| Growth | 4.9% | 6.9% | 5.5% | 4.4% | 4.7% | 0.9% | 14.6% | 2.8% | 5.8% | 5.3% | 4.4% | |
| Other Programs | 6.1 | 6.3 | 6.4 | 7.0 | 7.2 | 7.5 | 8.0 | 8.0 | 8.2 | 8.5 | 8.8 | 9.1 |
| Growth | 2.9% | 2.3% | 9.4% | 2.0% | 3.9% | 7.6% | -0.7% | 3.4% | 3.5% | 3.4% | 3.2% | |
| Capital | 1.4 | 1.5 | 1.7 | 1.8 | 1.6 | 1.7 | 1.8 | 1.9 | 1.9 | 2.0 | 2.0 | 2.1 |
| Growth | 10.7% | 11.2% | 6.9% | -12.3% | 8.6% | 6.2% | 3.2% | 3.3% | 3.3% | 3.1% | 3.1% | |
| Total Health Sector | 50.4 | 51.6 | 52.9 | 54.4 | 55.3 | 56.3 | 59.3 | 61.3 | 64.8 | 67.3 | 70.3 | 73.3 |
| Growth | 2.5% | 2.5% | 2.7% | 1.7% | 1.9% | 5.3% | 3.5% | 5.7% | 3.9% | 4.4% | 4.3% | |
Appendix B: Development of this Report
Authority
The Financial Accountability Officer decided to undertake the analysis presented in this report under Section 10(1)(a) of the Financial Accountability Officer Act, 2013.
Key Questions
The following key questions were used as a guide while undertaking research for this report:
- How does the growth of health spending in 2017-18 and 2018-19 compare to the growth from 2011-12 to 2016-17?
- What accounts for the change in program area growth rates?
- What is the FAO’s health spending projection from 2019-20 to 2022-23?
- How will the program changes announced in the 2018 Fall Economic Statement affect health sector spending going forward?
- What other factors could impact the FAO’s health spending projection?
Methodology
This report has been prepared with the benefit of information provided by, and meetings with staff from, the Ministry of Health and Long-Term Care and a review of relevant literature and other publicly available information. Specific sources are referenced throughout.
All dollar amounts are in Canadian, current dollars (i.e. not adjusted for inflation) unless otherwise noted.
Footnotes
[1] Note: The FAO’s spending projection does not include the potential financial impact of the proposed Bill 74, The People’s Health Care Act, 2019 and the Province’s announcement on February 26, 2019 regarding changes to the health care system, including the creation of Ontario Health and Ontario Health Teams.
[2] 2018 Fall Economic Statement, p. 18 and 117.
[3] See the FAO’s 2018 Fall Economic and Budget Outlook for more details.
[4] 2018 Fall Economic Statement and FAO analysis of the February 19, 2019 Kaplan Board of Arbitration decision on physician compensation.
[5] Health Quality Ontario, “Measuring Up 2018 A yearly report on how Ontario’s health system is performing”, p. 3.
[6] See page 2 of the Ontario Long-Term Care Association’s 2019 Budget Submission.
[7] Health Quality Ontario, “Hospital Overcrowding”, in Measuring Up 2018.
[8] Health Quality Ontario, Measuring Up 2018. Average time spent in the emergency department for admitted patients reached a six-year high of 16 hours in 2017-18 and wait times for low-acuity discharged patients reached a six-year high of 2.4 hours in 2017-18.
[9] Emergency room visits for opioid poisoning have more than doubled since 2014. 42% of Ontarians reported that their emergency room visit could have been managed by a primary care provider if they had been available.
[10] Health Quality Ontario, “Hospital Overcrowding” in Measuring Up 2018.
[11] Ontario Newsroom. “Ontario’s Government for the People Taking Immediate Action to End Hallway Health Care.” October 3, 2018.
[12] See “Hallway Health Care: A System Under Strain”, the 1st Interim Report from the Premier’s Council on Improving Healthcare and Ending Hallway Medicine.
[13] 2018 Fall Economic Statement, p. 66.
[14] 2018 Fall Economic Statement, p. 18 and 117.
[15] The FAO’s spending projection also does not include the potential financial impact of the proposed Bill 74, The People’s Health Care Act, 2019 and the Province’s announcement on February 26, 2019 regarding changes to the health care system, including the creation of Ontario Health and Ontario Health Teams.
[16] The Province recorded a provisional expense of $713 million in 2017-18 in anticipation of the arbitration decision. Based on the FAO’s review of the arbitration decision, the provisional expense will be partially in 2018-19. See chapter 4 for details.
[17] The Province added 1,200 hospital beds in 2017-18.
[18] Excluding the partial reversal of the 2017-18 provisional expense, average annual expense growth would be 3.8 per cent in 2017-18 and 2018-19.
[19] OHIP+ is a drug program that provides coverage for Ontarians under 25 years of age.
[20] 2018 Fall Economic Statement, p. 69.
[21] Health Quality Ontario, Measuring Up 2016.
[22] 2018 Fall Economic Statement, p. 68.
[23] 2018 Fall Economic Statement, p. 19.
[24] This preliminary estimate does not include the budget impact of how payments will be disbursed across medical specialties, as this will be decided in phase two of the arbitration process.
[25] 2017-18 Treasury Board Order, number 166, dated September 12, 2018, as reported in the Ontario Gazette, volume 152, issue 07, February 16, 2019.
[26] Retroactive compensation applies to the global fee increase of 0.75 per cent on April 1, 2017 and 1.25 per cent on April 1, 2018.
[27] This excludes technical fees billed in hospital and independent health facility settings.
[28] See “Schedule of Benefits – Physician Services Under the Health Insurance Act”, published by MOHLTC, under Regulation 552 of the Health Insurance Act. The schedule of benefits lists health care services and prices that are funded by the Province through OHIP. In 2016-17, fee for service payments comprised 67 per cent of the physician services budget.
[29] Also known as capitation. There are also grants, salaried positions, and other payment arrangements, including a blend of fee for service and non-fee for service. See MOHLTC’s submission to the Kaplan Board of Arbitration, p. 1. In 2016-17, non-fee for service payments comprised 33 per cent of the physician services budget.
[30] Note that the 0.5 per cent fee reduction reversal is included in the April 1, 2019, 1.0 per cent global fee increase.
[31] The Kaplan Board of Arbitration decision stated that $100 million in savings is to be achieved from June 1, 2019 to March 31, 2020 for annualized savings of $120 million. See p. 26.
[32] Decision from the Kaplan Board of Arbitration, p. 9.
[33] Decision from the Kaplan Board of Arbitration, pp. 8-9.
[34] Note: The FAO’s spending projection does not include the potential financial impact of the proposed Bill 74, The People’s Health Care Act, 2019 and the Province’s announcement on February 26, 2019 regarding changes to the health care system, including the creation of Ontario Health and Ontario Health Teams.
[35] Ontario’s population grew by 1.8% in 2018, the highest annual growth since 2002. See Statistics Canada Table 17-10-0005-01.
[36] See the FAO’s 2017 Long-Term Budget Outlook.
[37] CIHI Health Spending Data Tables, series B.
[38] See the FAO’s 2018 Fall Economic and Budget Outlook for more information on the outlook for consumer price inflation.
[39] The FAO estimates the incremental cost of a long-term care bed to be approximately $56,000 annually and by 2022-23, 12,750 of the 15,000 committed beds will be in service. This commitment replaces the previous government’s commitment to create over 30,000 long term care beds over ten-years, announced in the Province’s 2017 Action Plan for Seniors.
[40] The 10-year $1.9 billion of mental health spending replaces a previous commitment of $2.1 billion over four years in the 2018 Ontario Budget. On January 23, 2019 the Province and the Government of Canada signed a five-year agreement as part of the planned 10-year investment.
[41] See pages 18 and 117 of the 2018 Fall Economic Statement.
[42] See the FAO’s 2018 Fall Economic and Budget Outlook for more details.