

Assessing Ontario’s Medium-term Budget Plan
1 | Executive Summary
FAO Projects Sharp Increase in Budget Deficit
The FAO projects Ontario’s budget deficit will more than triple to $12.3 billion in 2018-19, its highest level since 2011-12.
This sharp jump in the deficit is the result of a significant increase in program spending combined with a decline in overall revenue, and comes after four years of strong economic growth.
FAO Projects a Sharp Increase in Ontario’s 2018-19 Deficit
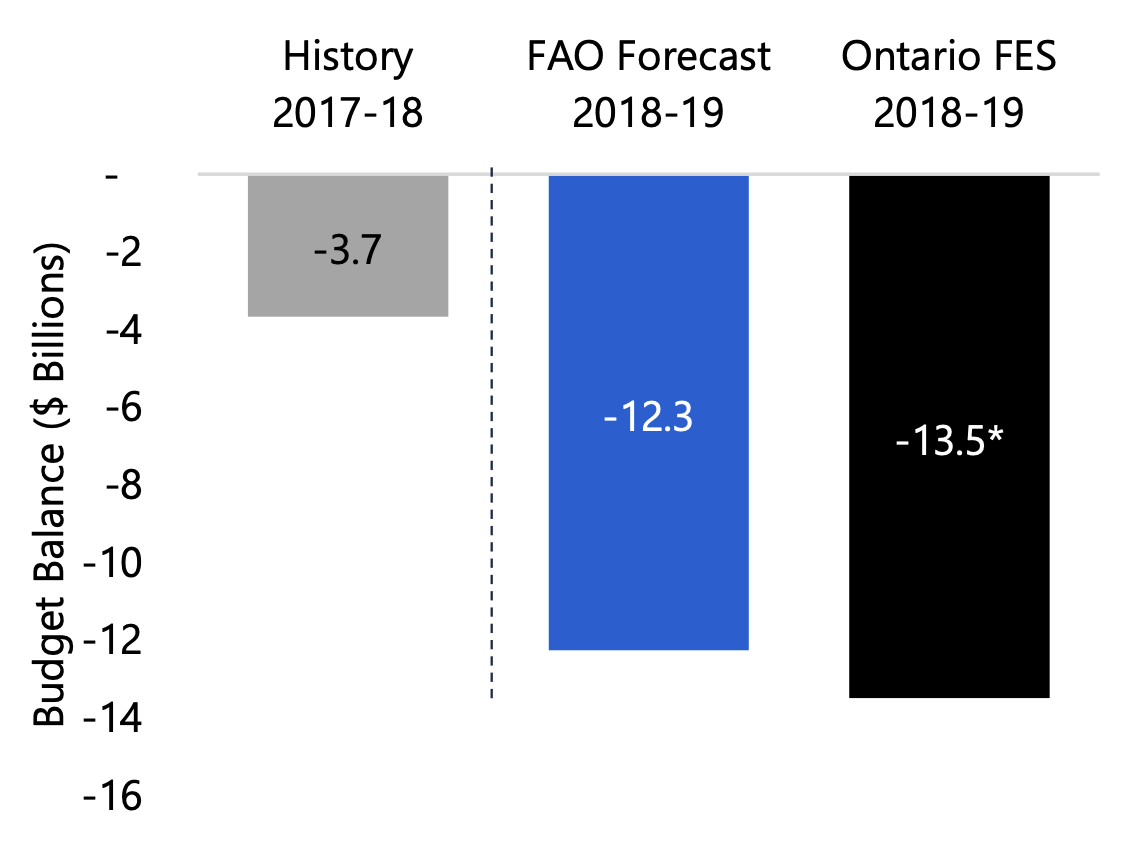
* Deficit estimates are presented without the reserve.
Source: Ontario Public Accounts, 2018 Ontario Economic Outlook and Fiscal Review (FES) and FAO.
Accessible version
This chart shows Ontario’s historical budget balance before the reserve in 2017-18 and the forecasted budget balance 2018-19 for both the FAO and the Ontario Fall Economic Statement.
The 2017-18 deficit was $3.7 billion. In 2018-19, the Government projects the deficit to be $13.5 billion, while the FAO forecasts the deficit to be $12.3 billion.
Ontario’s economy has performed strongly since 2014, with real GDP growth averaging 2.5 per cent, the fastest pace since the mid-2000s. However, most economic forecasters, including the FAO, expect that economic growth will moderate over the next few years, as rising interest rates combined with high levels of household debt slow the growth of household spending and residential investment.
At the same time, a number of domestic and international factors could negatively impact this moderating outlook, including weaker than expected business investment, protectionist US trade policies, and an unsettled global political environment.
Over the past five months, the Ontario government has introduced a number of changes to both revenue and spending policies. These changes included cancelling the cap and trade program, scaling back or cancelling many new spending initiatives from the 2018 Budget, reversing several tax increases included in the 2018 Budget and paralleling business tax changes introduced by the federal government. These policy changes, combined with a moderately weaker economic forecast, have contributed to a larger budget deficit since the FAO’s Spring outlook.[1]
Recent Policy Changes Increased Ontario’s Deficit Over the Outlook
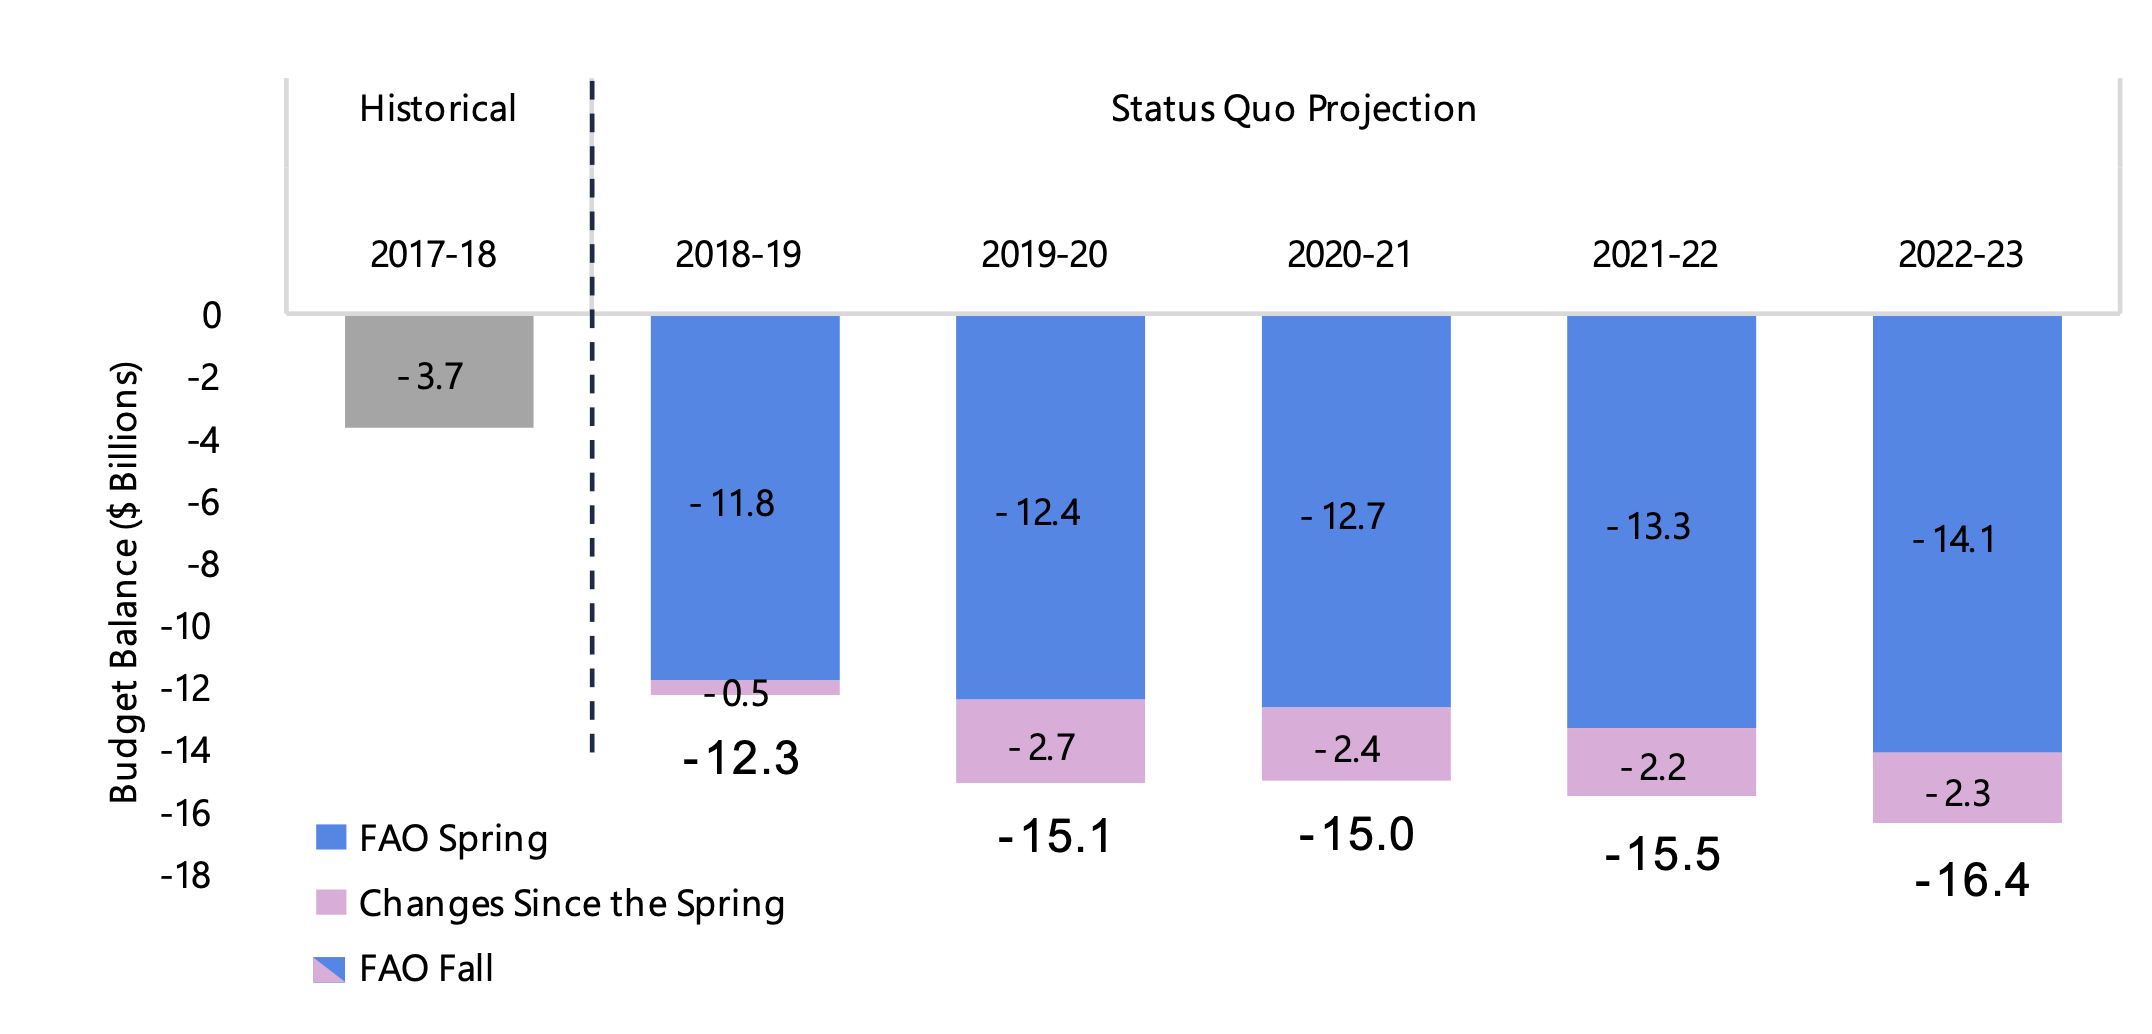
Note: Budget Balance is presented before reserve. The deficit for 2017-18 reflects 2017-18 Public Accounts. Numbers may not add up due to rounding.
Source: Ontario Public Accounts, 2018 Ontario Economic Outlook and Fiscal Review and FAO.
Accessible version
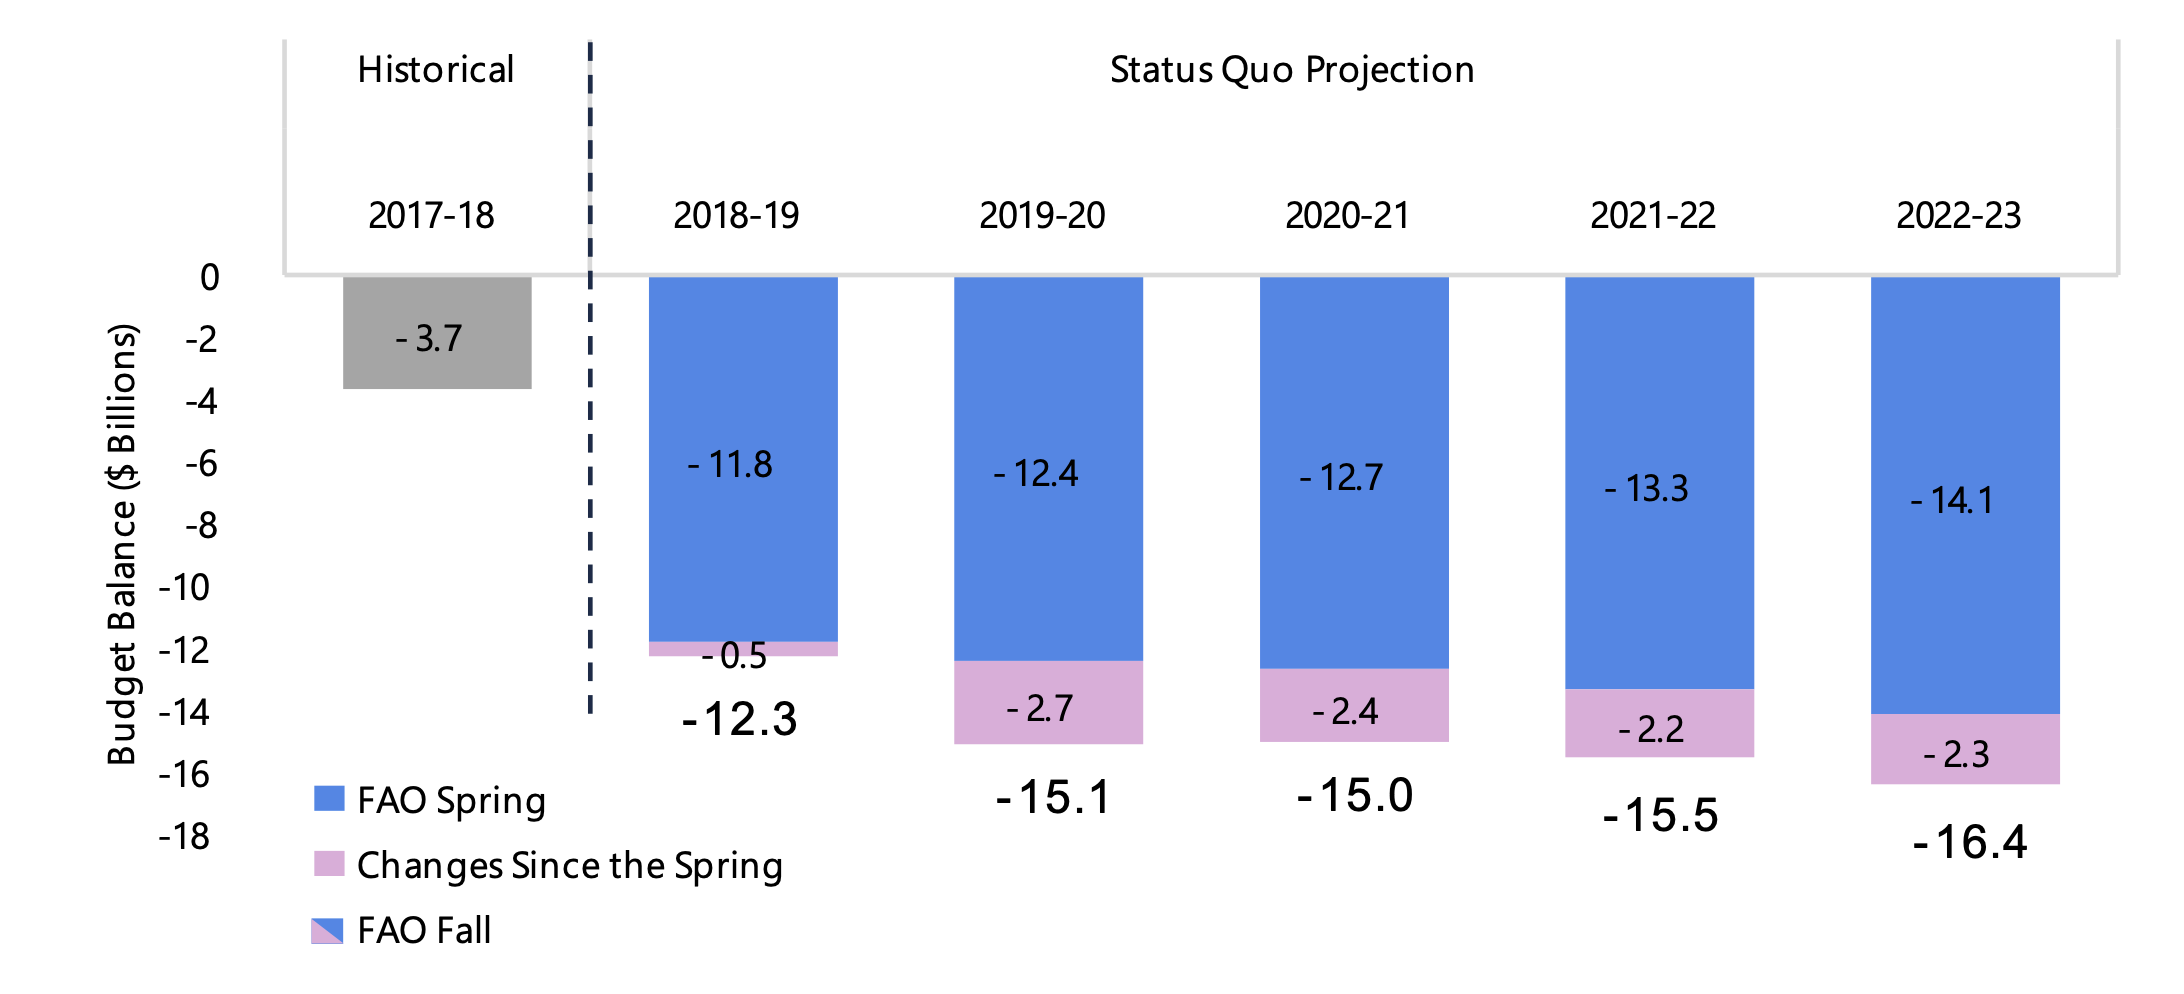
This chart shows the historical and forecasted budget balance before the reserve from 2017-18 to 2022-23. The chart shows the FAO’s spring forecast as well as the FAO’s fall forecast, in addition to changes between the two forecasts.
In 2017-18 the deficit was $3.7 billion. The FAO’s fall forecast shows a deficit of $12.3 billion in 2018-19, which is $0.5 billion higher from Spring. The FAO’s fall deficit forecast rises to $15.1 billion in 2019-20, $15.0 billion in 2020-21 and $15.5 billion in 2021-22 and $16.4 billion 2022-2023. Compared to the spring, the deficit is higher by $2.7 billion in 2019-20, $2.4 billion in 2020-21, $2.2 billion in 2021-22 and $2.3 billion in 2022-23.
Based on the FAO’s status quo projection, Ontario’s budget deficit will deteriorate to $15.1 billion in 2019-20 (an increase of $2.8 billion from 2018-19), largely due to reductions in revenue announced since the 2018 Budget. In the absence of policy changes from the government, the budget deficit would continue to deteriorate over the outlook, exceeding $16 billion by 2022-23.
When the Ontario budget is in deficit, the Fiscal Transparency and Accountability Act (FTAA) requires the government to develop a recovery plan that articulates both the measures it will take to return to budget balance, as well as the time period over which it will do so. While the government has not indicated when it intends to achieve balance, it has committed to not raising taxes.[2]
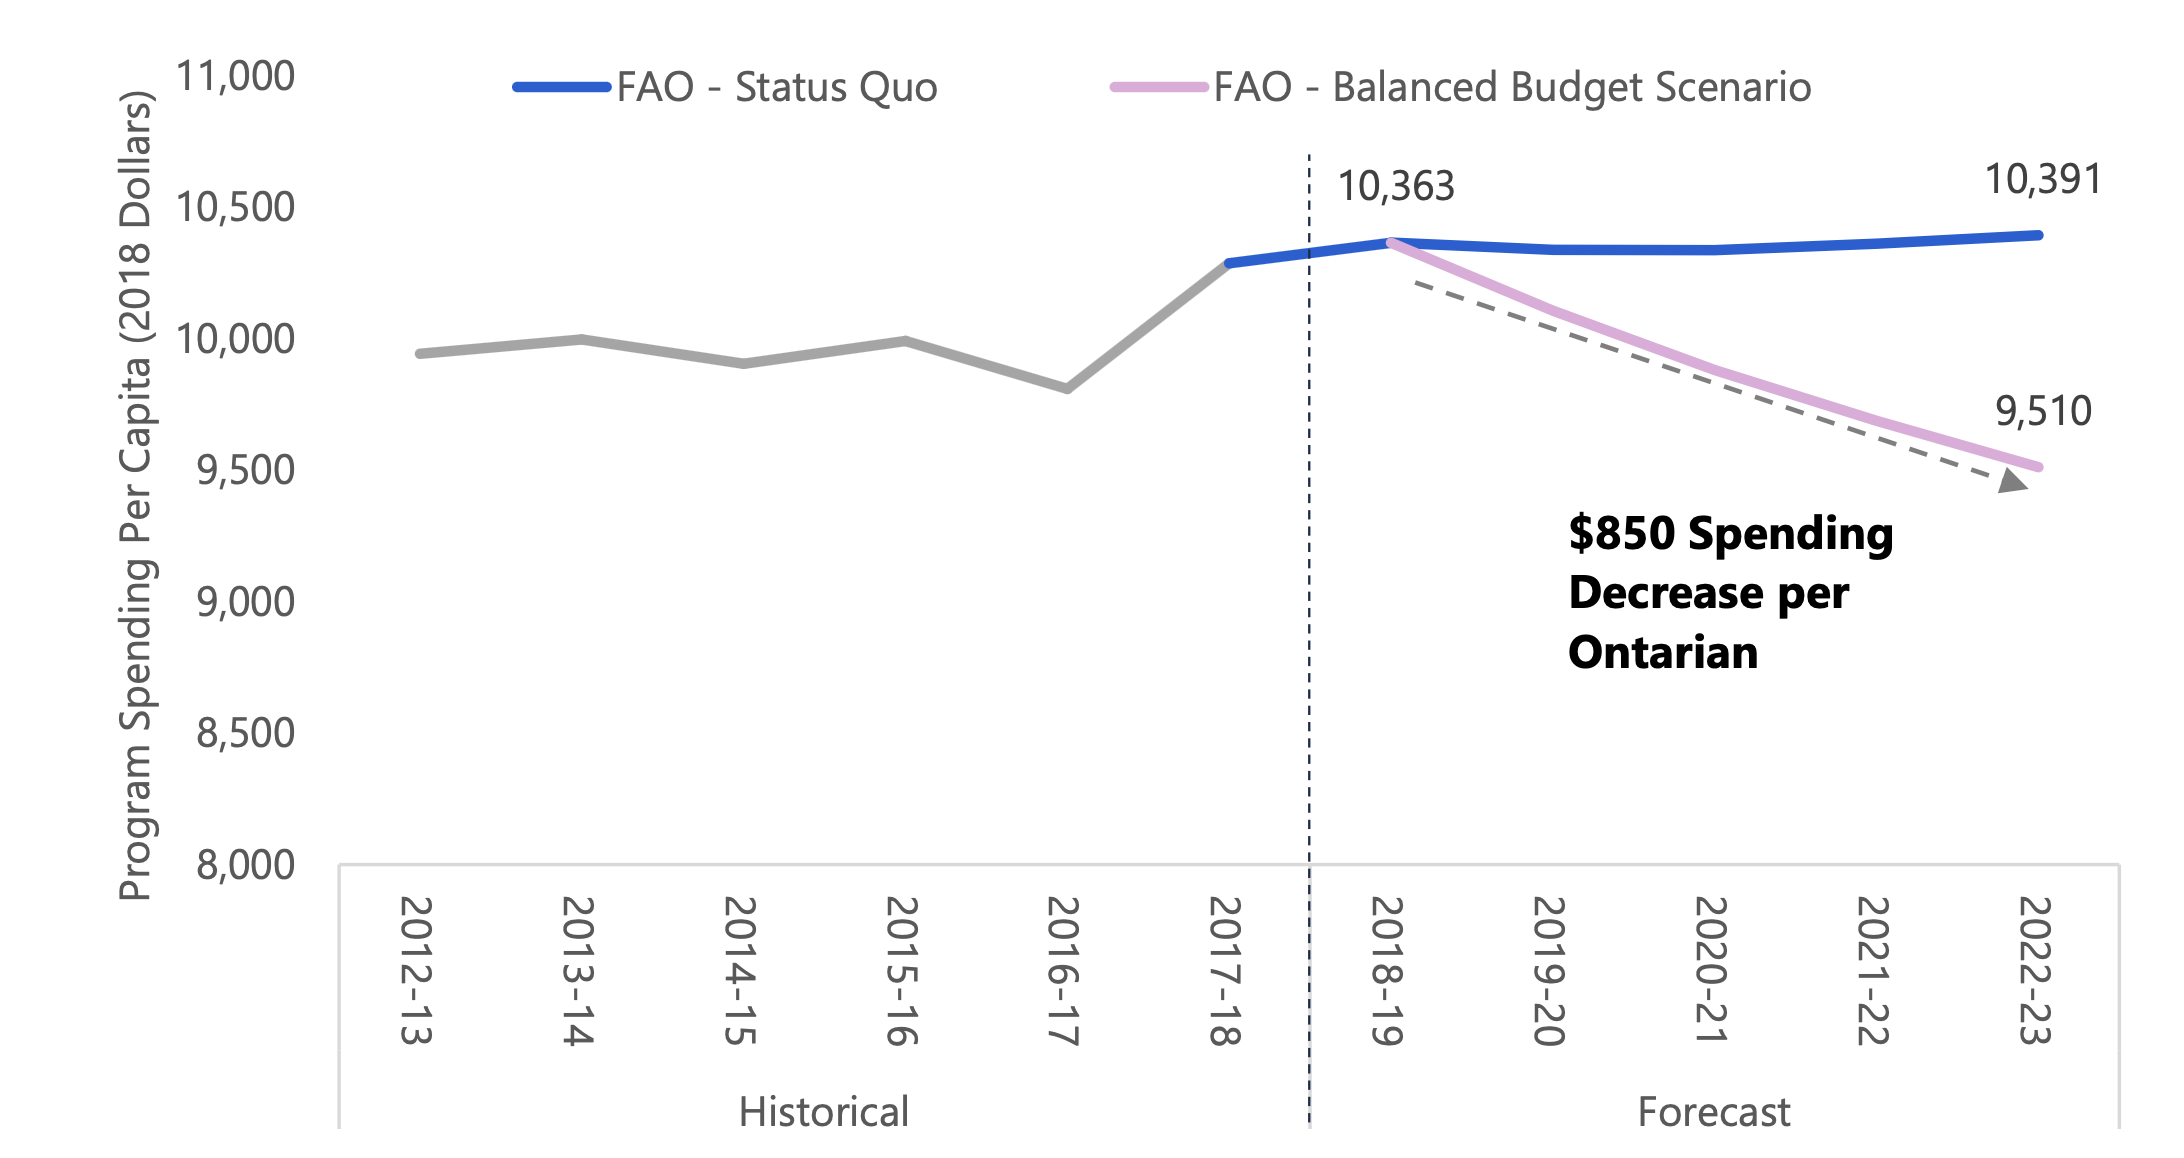
To explore the implications of achieving a balance budget without raising taxes, the FAO developed a scenario that eliminates Ontario’s current deficit over the next four years exclusively through spending restraint. Based on this scenario, the Ontario government would need to limit the growth in total program spending to 1.2 per cent per year on average from 2019-20 to 2022-23. This would be the slowest average growth in program spending since the mid-1990s. Restraining total spending to this extent would imply that spending per person would have to be reduced by $850 (or 8 per cent) by 2022-23, compared to today’s spending levels.
Balancing the Budget Without Raising Revenue Would Require Spending $850 Less Per Ontarian
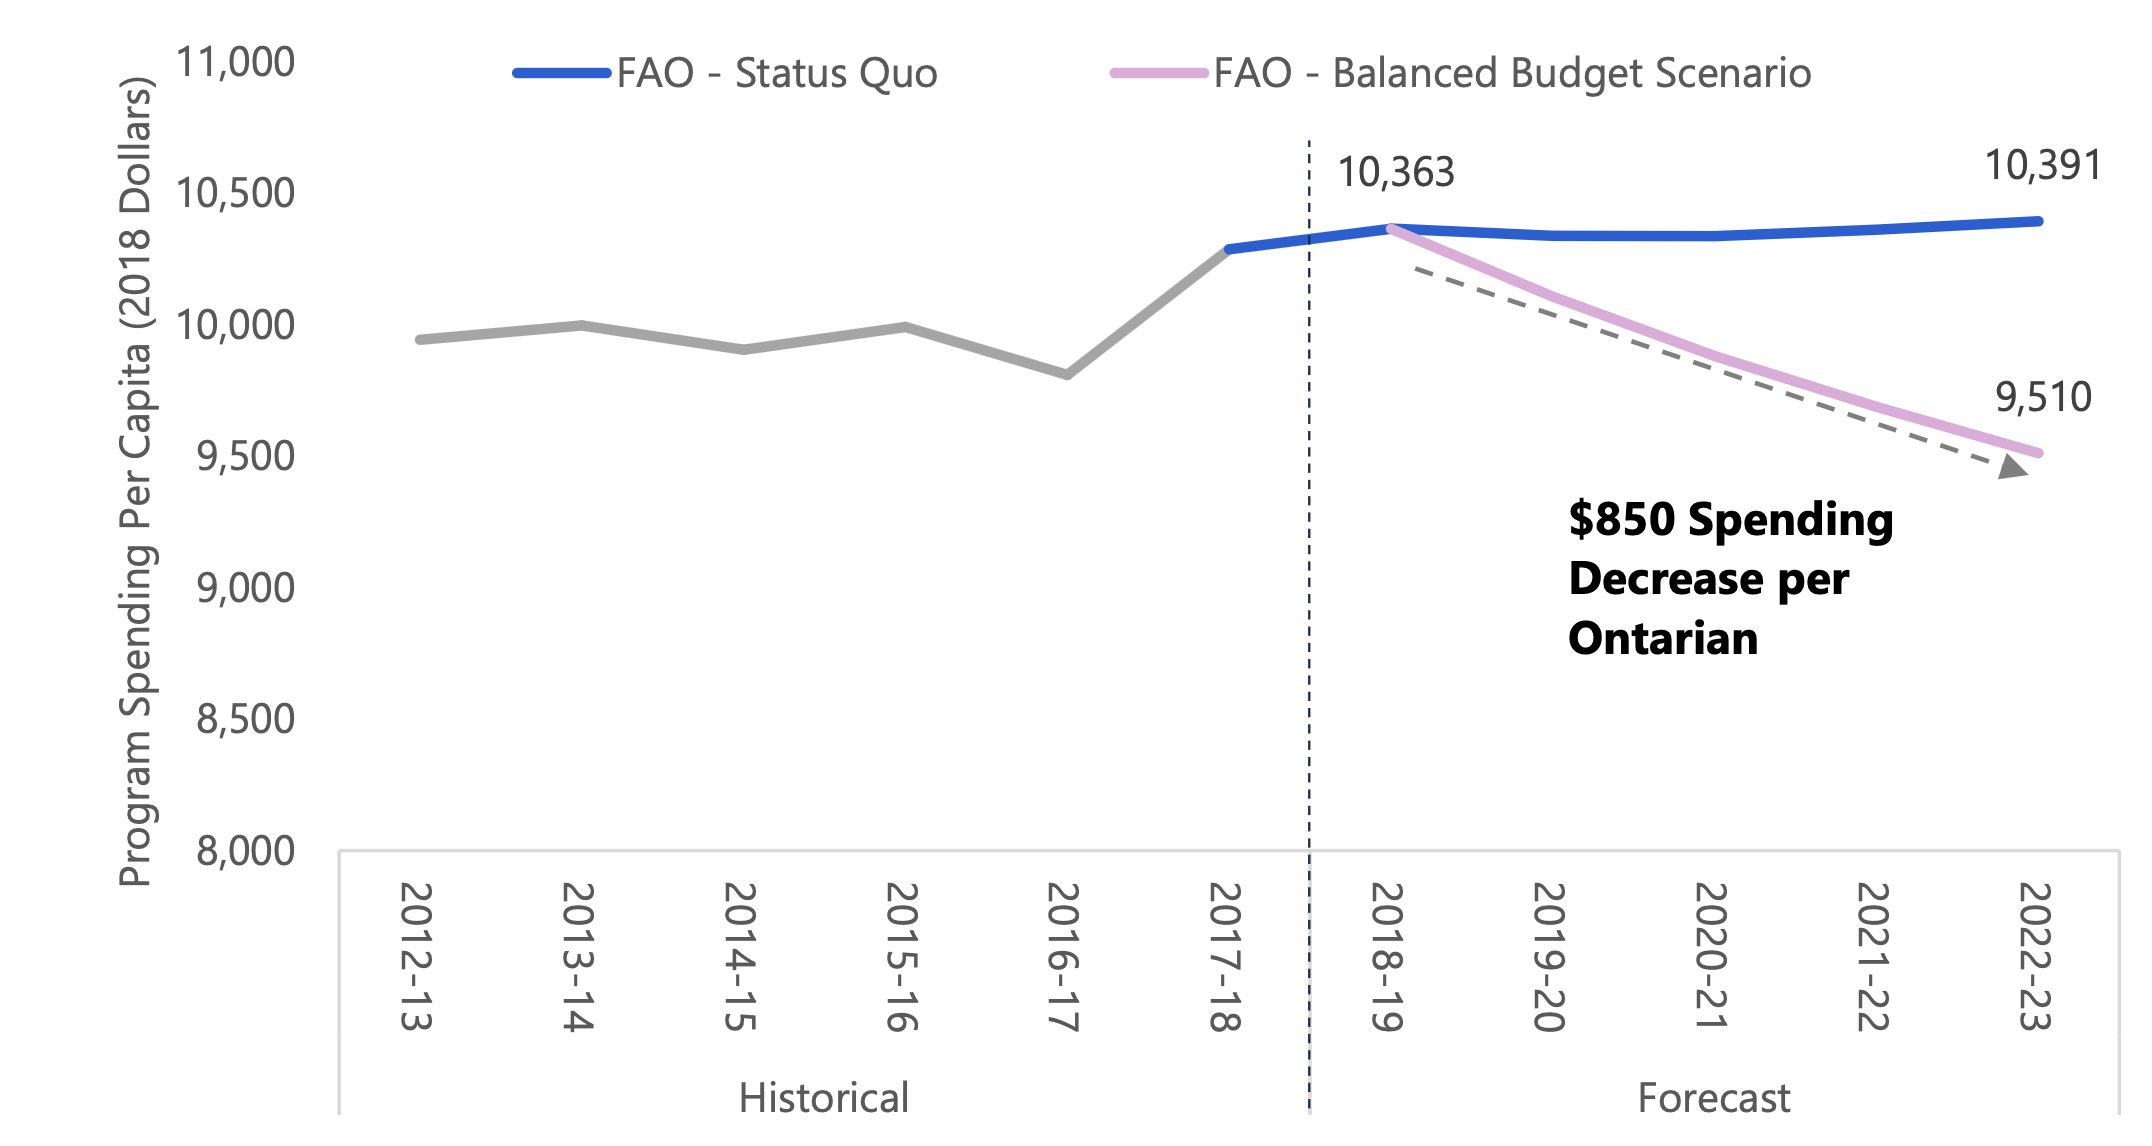
Source: Ontario Public Accounts, 2018 Ontario Economic Outlook and FAO.
Accessible version
This chart compares historical and forecasted program spending per capita from 2012-13 to 2022-23 under the FAO’s status quo projection and the balanced budget scenario. The chart highlights that the government would have to reduce program spending per capita by $850 from 2018-19 values in order to achieve a balanced budget by 2022-23.
Alternatively, the government could balance the budget through a combination of revenue and spending changes, spreading the burden across different sectors and groups. However, regardless of the government’s policy choices, balancing the budget over four years will require significant fiscal policy changes.
Policy changes of this magnitude could have wide-ranging impacts on Ontario households and businesses, as well as on the overall economy. Ontarians would benefit from an informed debate on the Province’s budget objectives and the tradeoffs necessary to achieve them.
2 | Economic Outlook
Overview
In 2018, Ontario real GDP is projected to increase by a moderate 2.2 per cent, following four years of stronger-than-average growth.[3] Ontario’s labour market continued to perform strongly in 2018 as robust employment gains pushed down the province’s projected annual unemployment rate for 2018 to the lowest level in almost two decades.
Over the outlook, the FAO projects that Ontario’s economy will expand at a more modest pace, with real GDP rising at an average rate of 2.0 per cent per year from 2018 to 2022, as rising interest rates combined with elevated levels of household debt are projected to slow growth in household spending and residential investment.
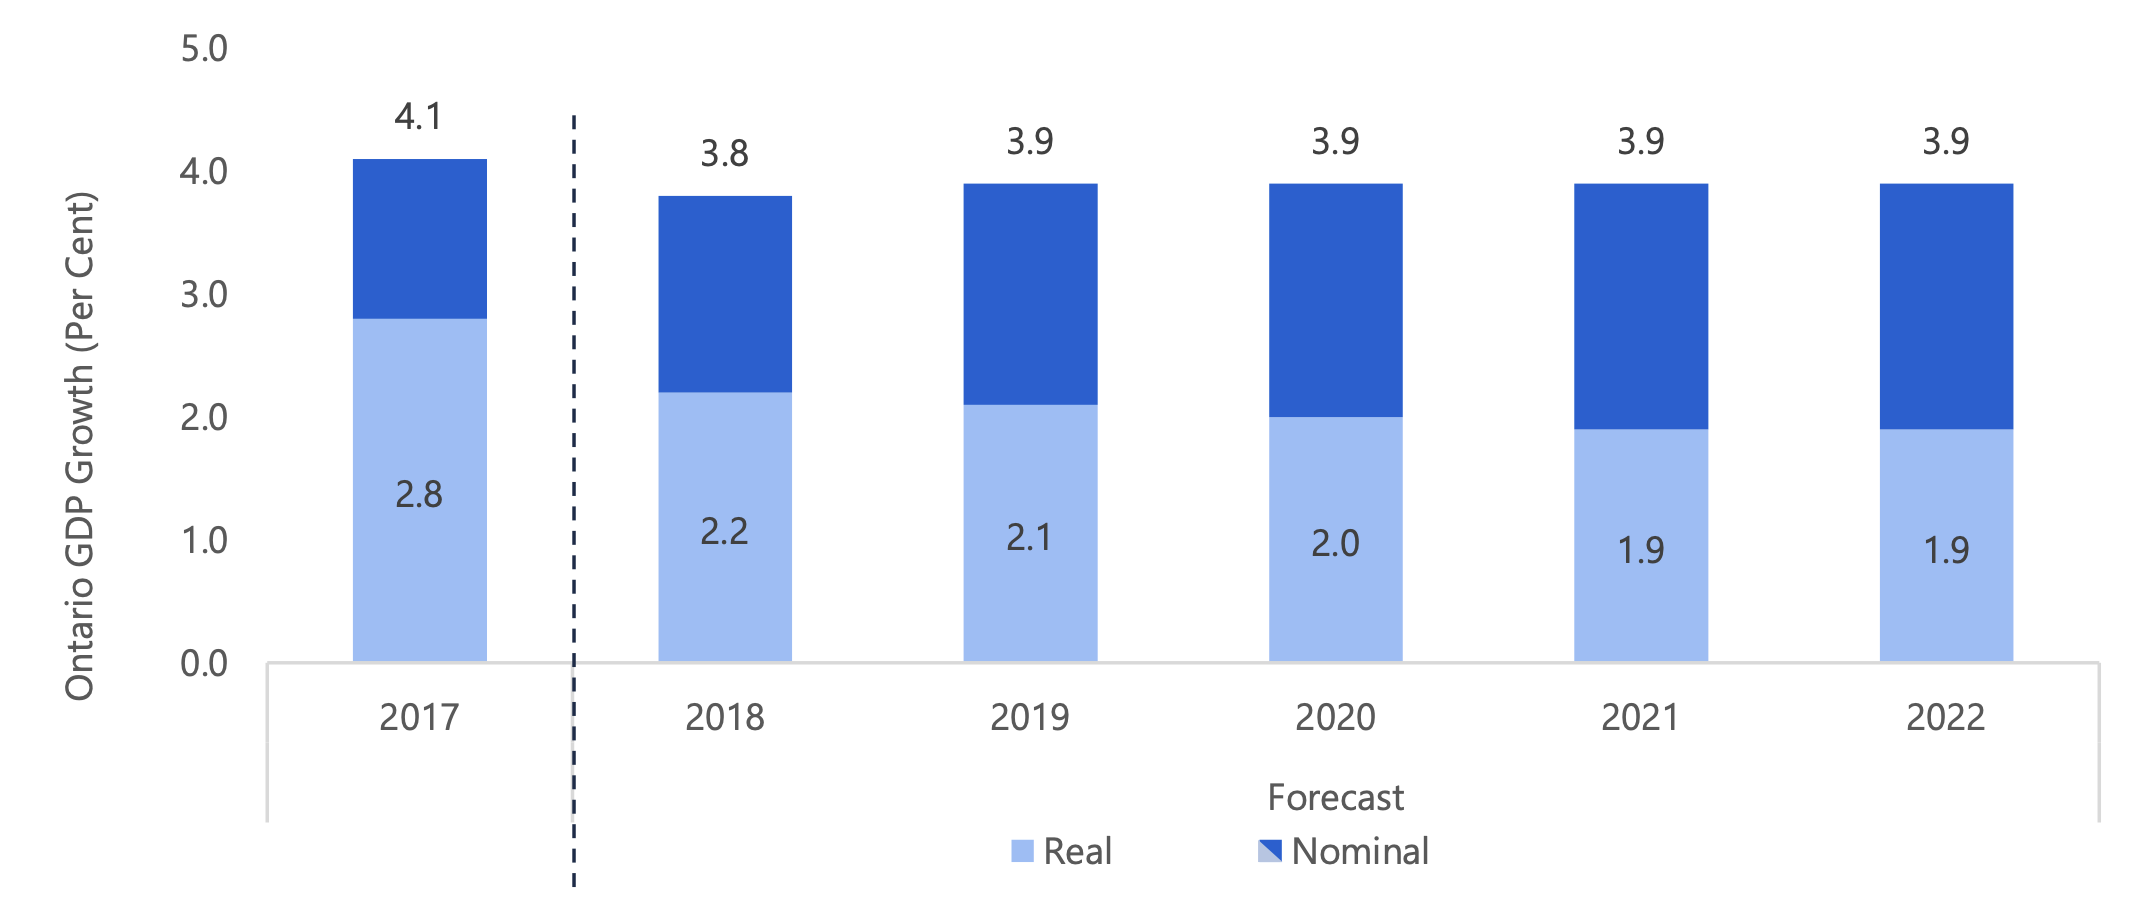
Nominal GDP – the broadest measure of the tax base – is expected to grow 3.8 per cent in 2018, slowing from a gain of 4.1 per cent in 2017. The FAO projects nominal GDP growth will average 3.9 per cent over the outlook, down from average growth of 4.4 per cent over the past four years.
Economic Growth in Ontario to Moderate Over Outlook
Source: Statistics Canada, Ontario Economic Accounts and FAO.
Accessible version
This chart shows the FAO’s forecast for Ontario’s nominal and real GDP growth from 2017 to 2022. Real GDP grew by 2.8 per cent in 2017. The FAO forecasts real GDP growth of 2.2 per cent in 2018, 2.1 per cent in 2019, 2.0 per cent in 2020 and 1.9 per cent in 2021 and 2022. Nominal GDP grew by 4.1 per cent in 2017. The FAO forecasts nominal GDP growth of 3.8 per cent in 2018 and 3.9 per cent from 2019 to 2022.
However, Ontario’s economy is facing increased risk from domestic and foreign factors. These risks include elevated household debt, protectionist US trade policies, the possibility of a more adverse business response to US tax reforms and heightened global political uncertainty. If these risks were to materialize, Ontario households and businesses would be negatively impacted, resulting in weaker economic growth than currently projected by the FAO.
Stable, But Risky Global Outlook
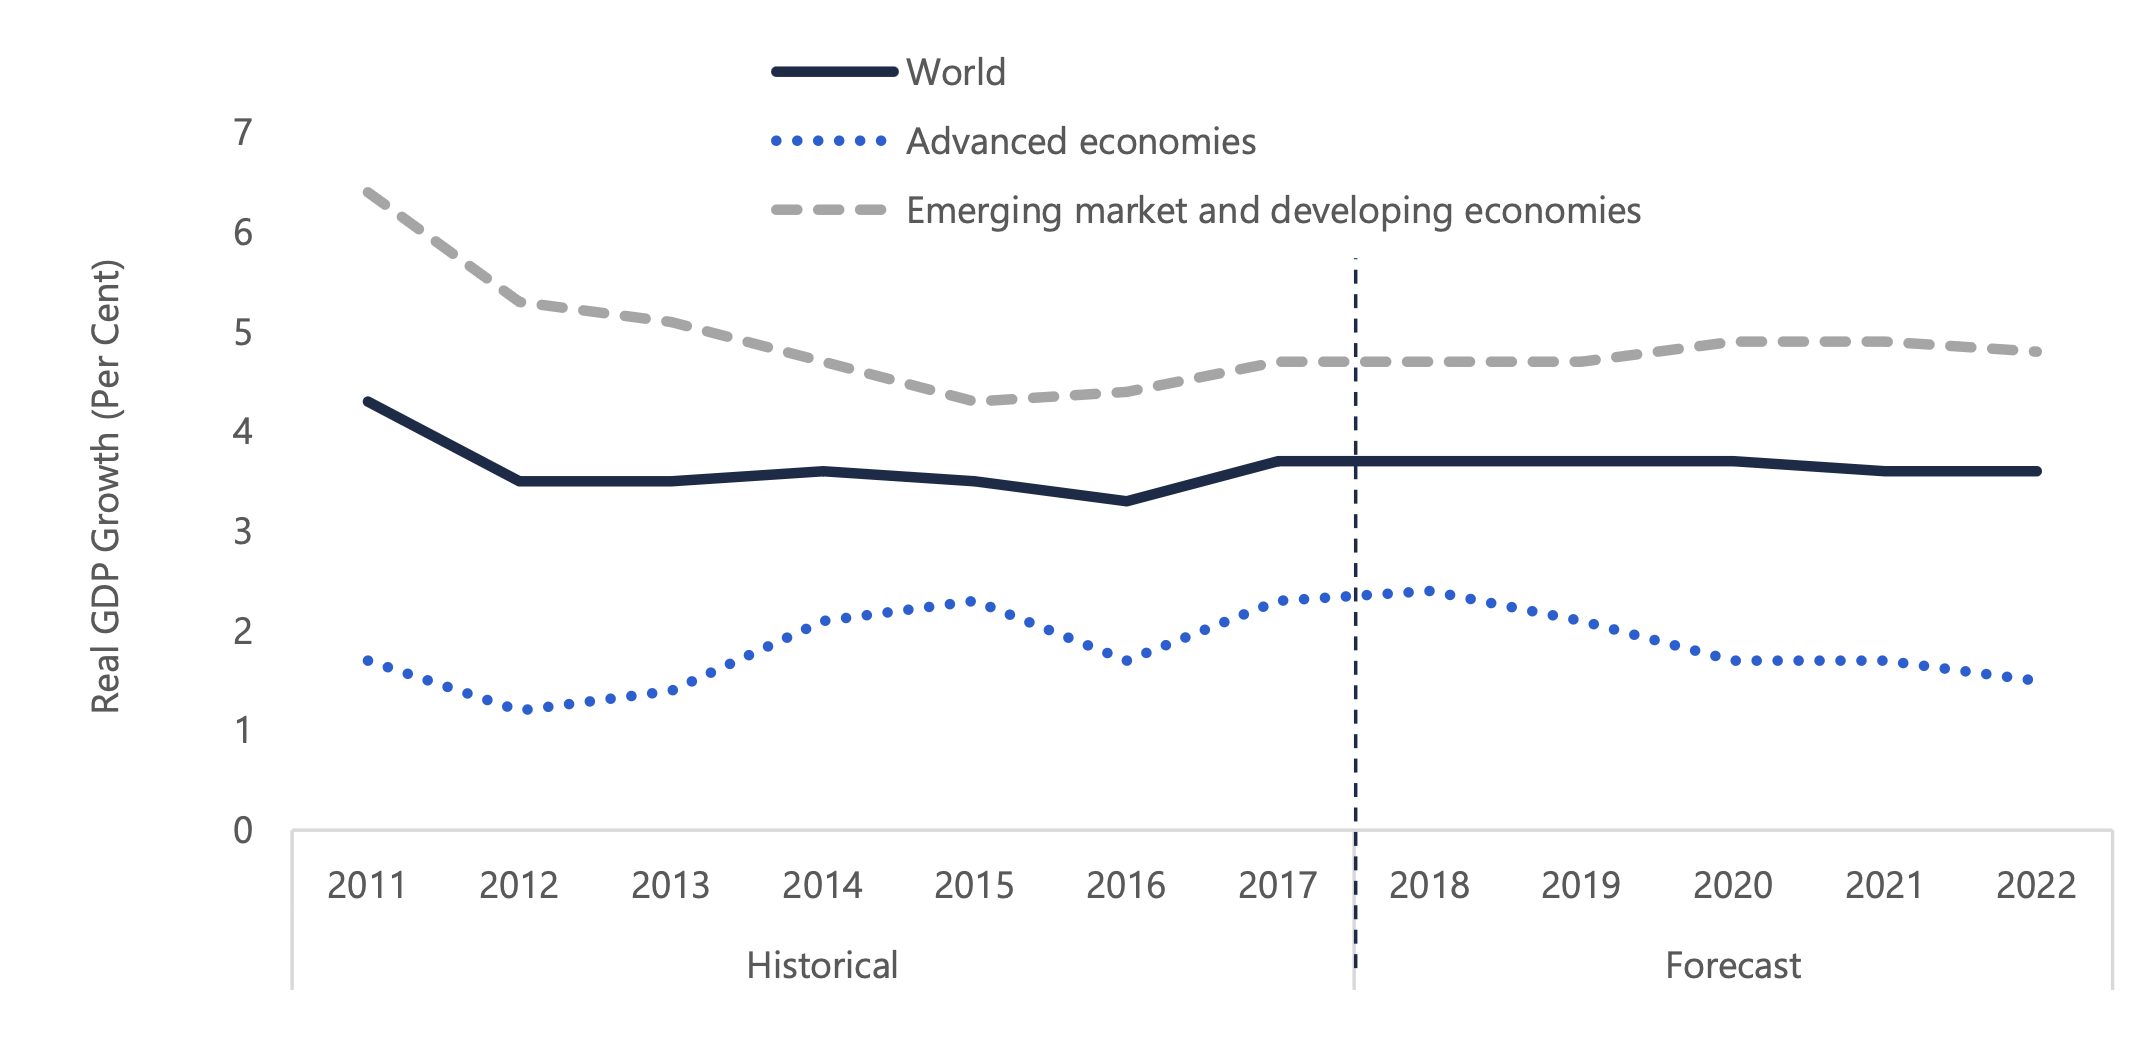
In 2018, the global economy lost some momentum over the course of the year due to an uncertain international trade environment and weaker performance in emerging markets. The International Monetary Fund (IMF) expects global growth will average 3.7 per cent in 2018, a slight downward revision from its April outlook.
Global Growth Expected to Remain Relatively Stable Over Outlook
Source: International Monetary Fund, World Economic Outlook, October 2018.
Accessible version
This chart shows the historical and forecasted real GDP growth for the world, advanced economies, and emerging market and developing economies from 2011 to 2022. Global real GDP growth was 3.7 per cent in 2017 and expected to remain at 3.7 per cent in 2018 and 2019. Advanced economies grew at 2.3 per cent in 2017 and are expected to grow at 2.4 and 2.1 per cent in 2018 and 2019, respectively. Emerging market and developing economies grew at 4.7 per cent in 2017 and are expected to grow at 4.7 per cent in 2018 and 2019.
For advanced economies, steady gains continued in 2018 with expected average growth of 2.4 per cent, despite higher oil prices and rising uncertainty in trade relations. Growth for advanced economies is expected to slow over the outlook as countries continue to face modest productivity growth, aging workforces and tightening financial conditions. [4]
Growth for emerging market and developing economies is expected to average 4.7 per cent per year over the outlook, despite mixed outlooks for individual countries. Prospects for emerging Asia and emerging Europe remain favourable, while the opposite is true for Latin America, the Middle East and sub-Saharan Africa.[5]
United States
The United States economy is expected to outperform most other advanced economies in 2018, supported by ongoing fiscal stimulus and cuts in personal and corporate income taxes.[6] The US labour market was bolstered by strong demand for workers as the unemployment rate fell to its lowest level in almost fifty years. US workers have also benefitted from stronger wage growth which has supported robust consumer spending.
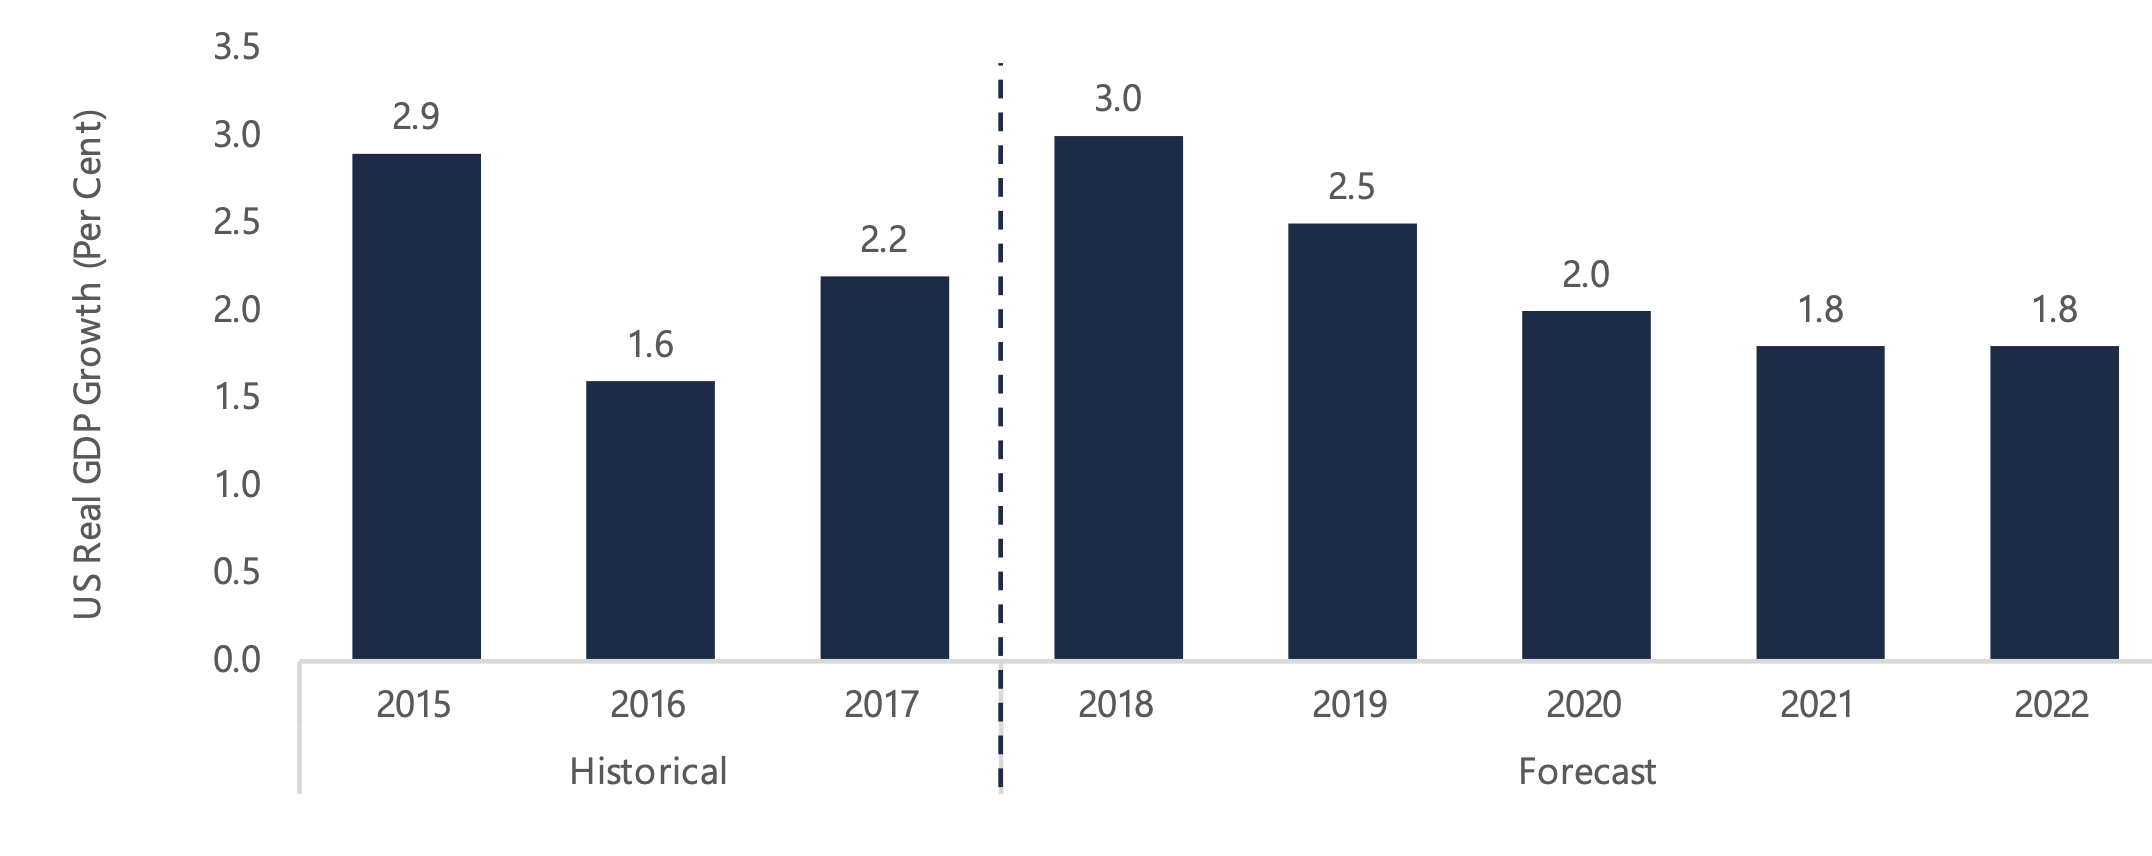
However, US growth is expected to moderate over the next few years as the fiscal stimulus unwinds and the Federal Reserve continues to raise its policy interest rate. The sustainability of US fiscal policy, given steep increases in the federal budget deficit, is a key risk for the US and global economies.
US Economy Expected to Moderate After Fiscal Stimulus Ends
Source: US Bureau of Economic Analysis, Federal Open Market Committee and FAO.
Accessible version
This chart shows the historical and forecasted US real GDP growth rates from 2015 to 2022. The US economy grew by 2.9 per cent in 2015, 1.6 per cent in 2016, and by 2.2 per cent in 2017. US real GDP growth is expected to reach 3.0 per cent in 2018, 2.5 per cent in 2019, 2.0 per cent in 2020 and 1.8 per cent in 2021 and 2022.
China
Chinese economic growth remained solid over the first half of 2018 but has slowed noticeably in recent months, the result of policy measures to contain debt and financial risks as well as the volatile nature of trade relations with the United States.[7]
Weaker domestic credit growth as well as financial uncertainty are expected to dampen Chinese growth in 2019. At the same time, US tariffs on Chinese imports combined with retaliatory responses by the Chinese government remain a key risk for the Chinese and global economies.
Canadian Growth Expected to Stabilize
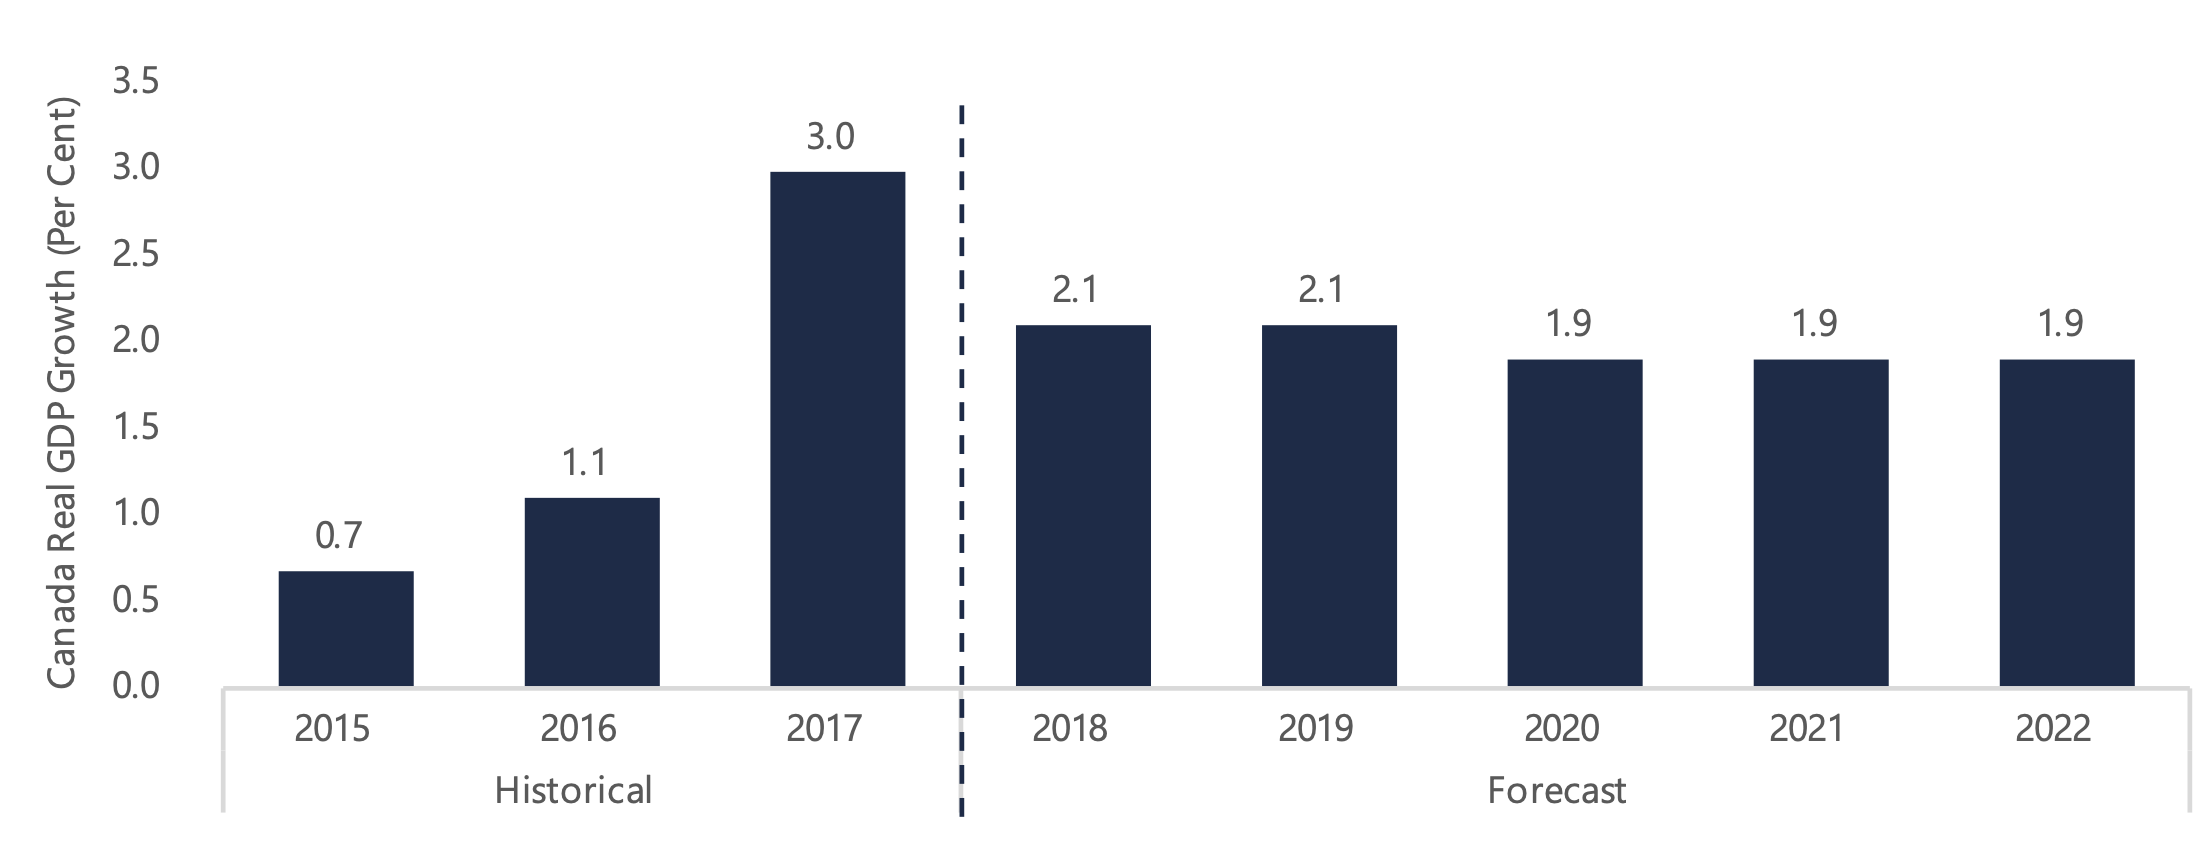
Last year, Canadian real GDP grew by 3.0 per cent, driven by robust household spending, continued gains in residential investment and a strong rise in machinery and equipment investment. Over the first half of 2018, overall growth has been moderate, supported by gains in household spending, business investment and international trade.
Canadian real GDP growth is projected to moderate to 2.1 per cent in 2018. Over the outlook, the FAO projects Canadian real GDP to grow at an average annual rate of 2.0 per cent.[8]
Canadian Real GDP Growth Expected to Level Out
Source: Statistics Canada and FAO.
Accessible version
This chart shows the historical and forecasted Canadian real GDP growth rates from 2015 to 2022. The Canadian economy grew by 0.7 per cent in 2015, 1.1 per cent in 2016, and 3.0 per cent in 2017. Canadian real GDP growth is expected to be 2.1 per cent in 2018 and 2019 and 1.9 per cent from 2020 to 2022.
Interest Rates to Continue Rising
In October 2018, the Bank of Canada raised its policy interest rate by 25 basis points to 1.75 per cent. In the accompanying statement, the Bank indicated that the Canadian economy was operating close to capacity and given inflationary pressures, it was necessary to raise the policy interest rate to achieve the inflation target of 2.0 per cent.[9] The Bank has increased the policy interest rate by 125 basis points since the spring of 2017, including 75 basis points so far in 2018.
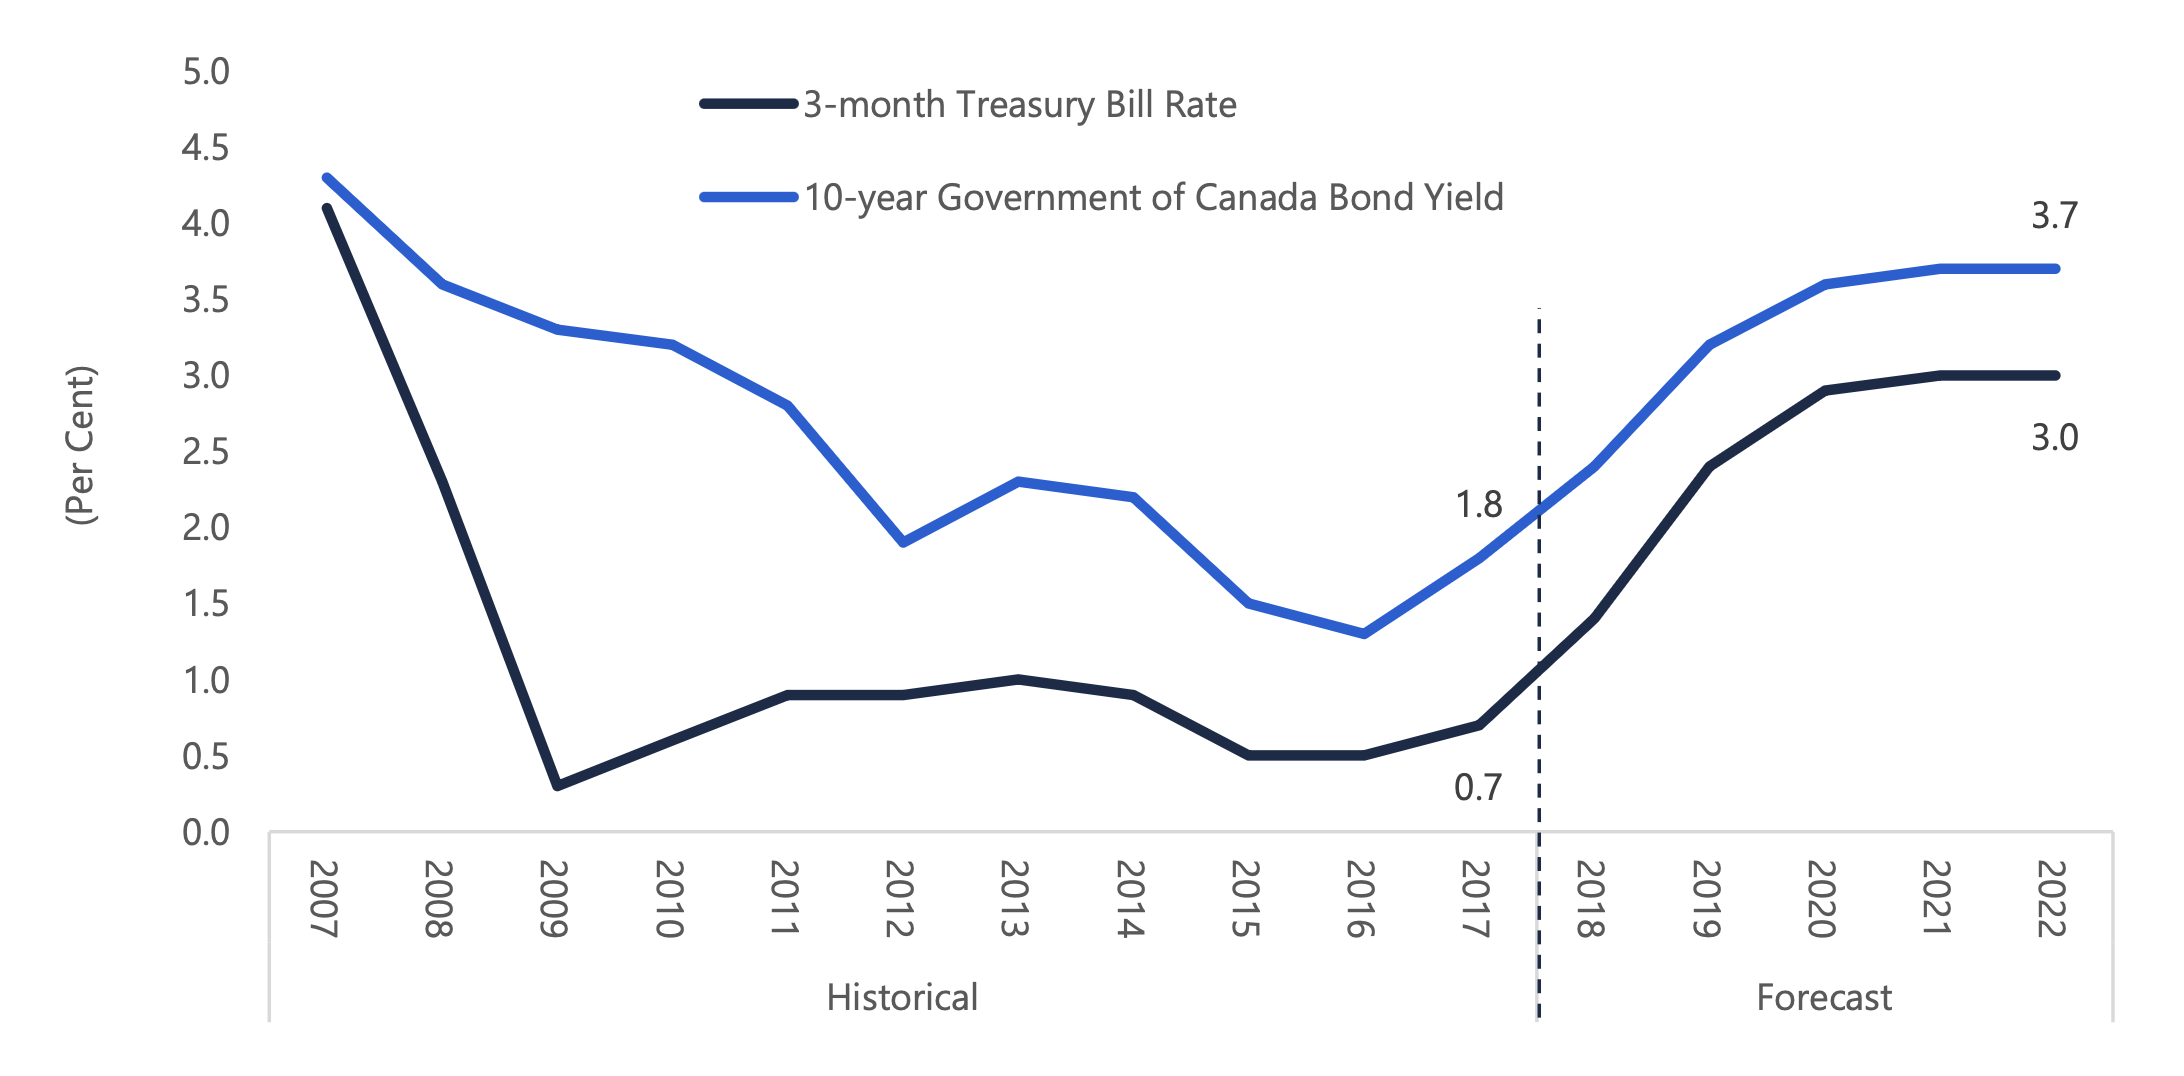
In recent communications, the Bank has continued to emphasize that it will take a data-dependent approach to setting the policy interest rate, suggesting that the pace of future hikes could continue to be relatively rapid if warranted by economic indicators.[10] Based on the Bank’s recent actions, the FAO projects a steady rise in interest rates over the next two years before leveling off at what the Bank estimates to be the ‘neutral’ rate.[11]
Interest Rates Expected to Rise Steadily Through 2019
Source: Statistics Canada and FAO.
Accessible version
This chart shows the historical and forecasted 3-month Treasury bill rate and the 10-year Government of Canada bond yield from 2007 to 2022. The 3-month Treasury bill rate declined from 4.1 per cent in 2007 to 0.7 per cent in 2017. The Treasury bill rate is expected to rise to 3.0 per cent by 2022. The 10-year Government of Canada bond yield declined from 4.3 per cent in 2007 to 1.8 per cent in 2017. The 10-year bond yield is expected rise to 3.7 per cent by 2022.
Ontario’s Economic Growth to Moderate
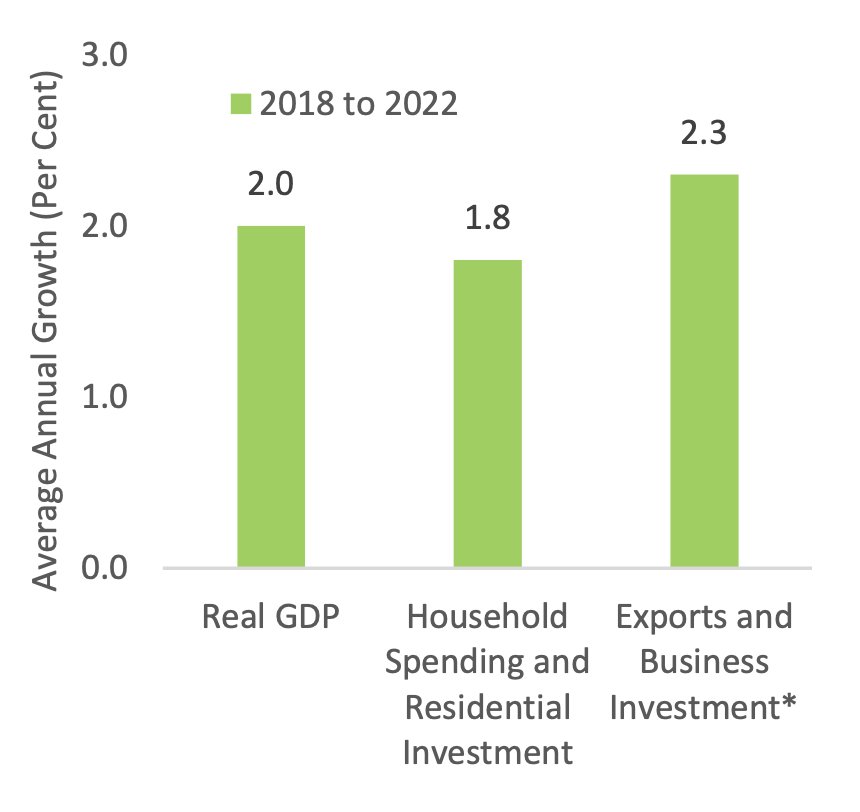
Exports and Business Investment to Lead Growth Over Outlook
* Business investment includes both non-residential investment and machinery and equipment investments.
Source: Statistics Canada, Ontario Economic Accounts and FAO.
Accessible version
This chart shows average annual growth rates from 2018 to 2022 for three categories: (1) Ontario real GDP, (2) household spending and residential investment and (3) exports and business investment. Real GDP is expected to grow at an annual rate of 2.0 per cent from 2018 to 2022. Growth in household spending and residential investment are expected to grow at an annual rate of 1.8 per cent from 2018 to 2022. Growth in exports and business investment is expected to grow at an annual rate of 2.3 per cent from 2018 to 2022.
Ontario real GDP increased by 2.8 per cent in 2017 – the fourth consecutive year of relatively strong growth led primarily by robust household spending and residential investment.[12] However, given the accelerated growth of the past four years, combined with only limited increases in output capacity, the Ontario economy is operating close to its potential, implying that future economic growth will likely be more restrained.[13]
In 2018, real GDP is projected to increase by a more moderate 2.2 per cent, as overall growth becomes less dependent on household spending and residential investment – a trend that began to emerge in 2017.
Further increases in interest rates are expected to contribute to more moderate gains in household spending and residential investment over the outlook. At the same time, exports and business investment[14] are expected to play a larger role in overall growth, supported by a solid US economy, new trade agreements[15] and the need for Ontario businesses to expand production capacity to meet higher demand.[16] Going forward, the FAO projects real GDP growth to average 2.0 per cent annually over the outlook.
Steady Job Growth Projected
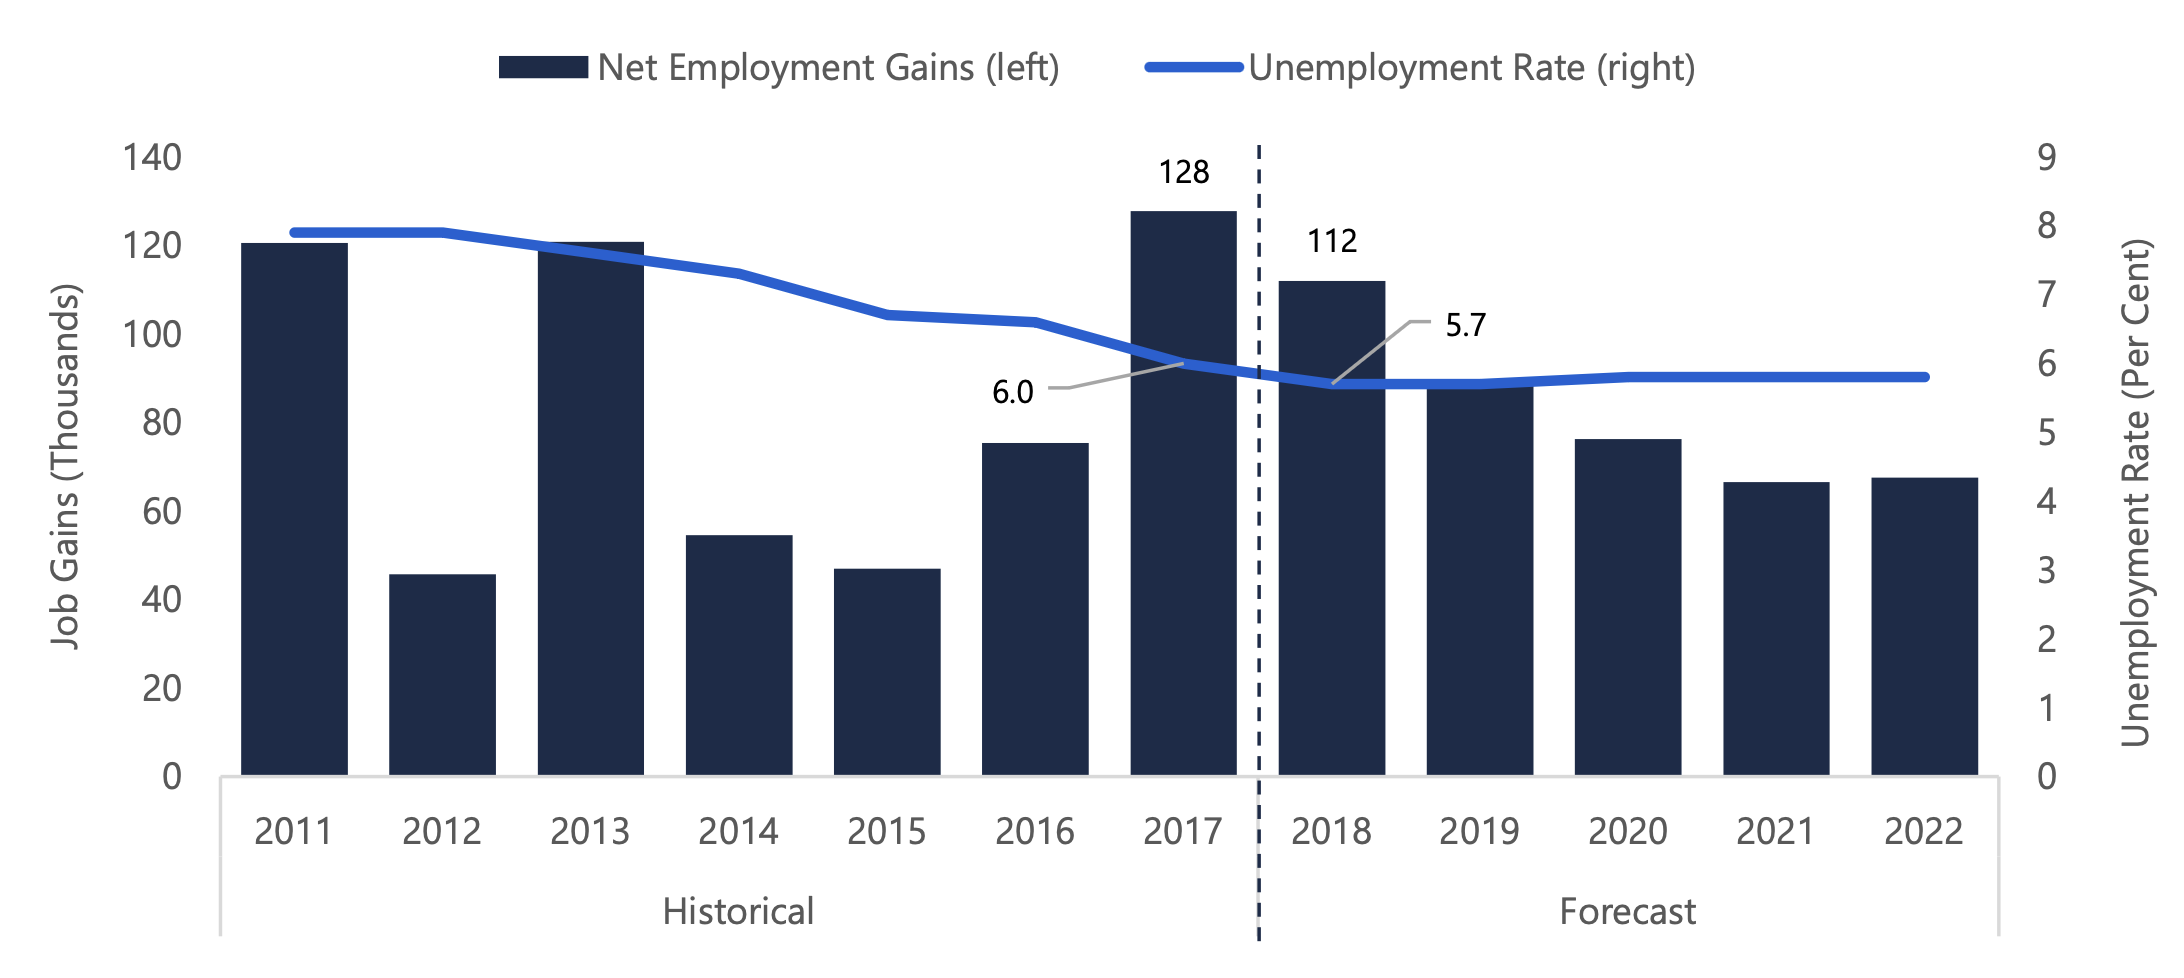
Ontario employment growth is expected to remain robust with the creation of 112,000 net new jobs in 2018 and a continued decline in the annual unemployment rate to 5.7 per cent. Over the outlook, steady economic growth is expected to support average annual employment gains of 1.0 per cent[17], in-line with growth in the labour force, keeping the unemployment rate relatively stable.
Steady Job Gains Projected Over Outlook
Source: Statistics Canada and FAO.
Accessible version
This chart shows the historical and forecasted net employment gains and unemployment rate from 2011 to 2022. The chart shows that the unemployment rate has been declining since 2011, reaching 6.0 per cent in 2017. The unemployment rate is projected to reach 5.7 per cent in 2018 and remain roughly stable over the forecast. Net employment gains were 128,000 in 2017. Gains are expected to moderate over the outlook, reaching 112,000 in 2018 and falling to 68,000 by 2022.
Economy-wide Incomes to Moderate
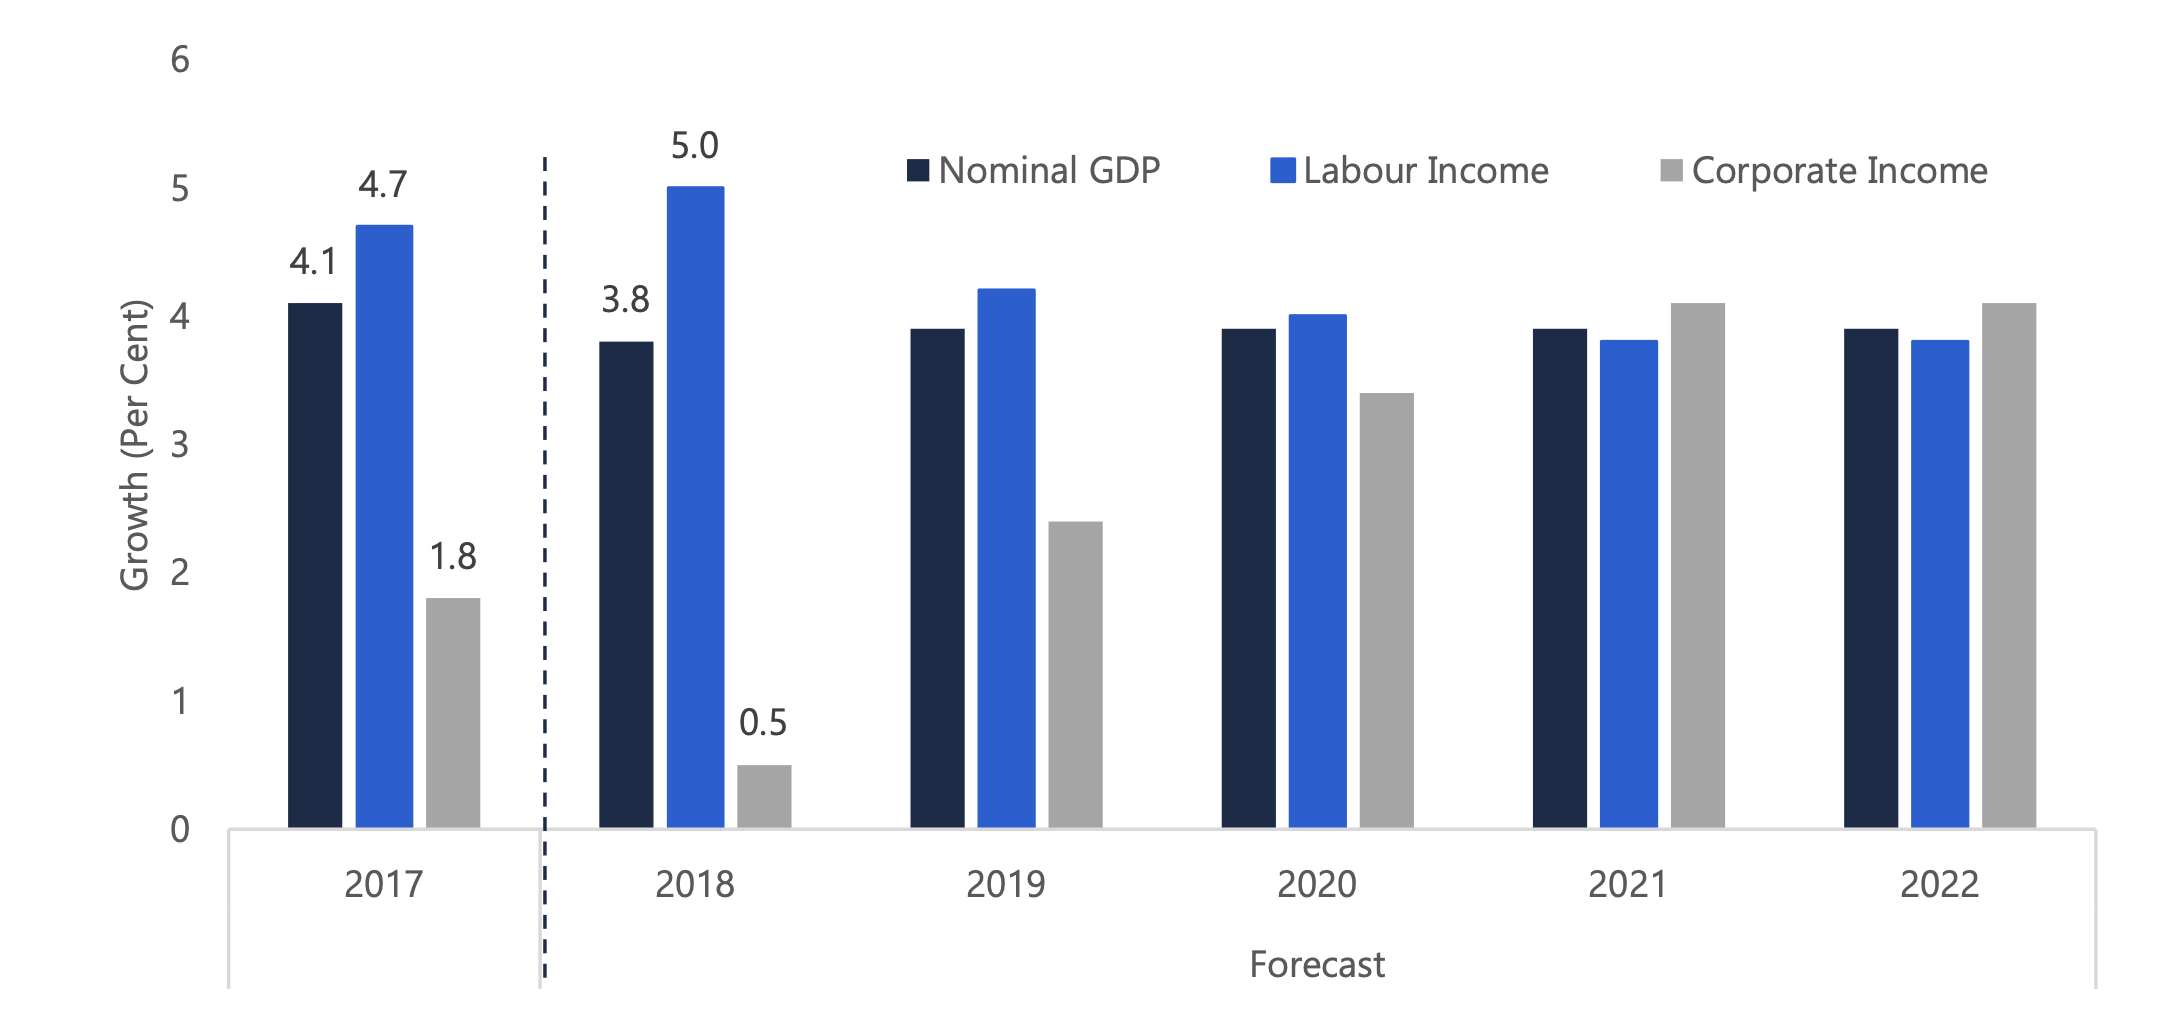
Labour income in Ontario is projected to increase by a robust 5.0 per cent in 2018, following a similarly strong gain of 4.7 per cent in 2017. Corporate profits are expected to edge up by just 0.5 per cent this year, following an increase of 1.8 per cent in 2017 and 15.8 per cent in 2016.[18] Ontario’s nominal GDP is projected to increase by 3.8 per cent in 2018, down from a 4.1 per cent gain in 2017.
Over the outlook, corporate profit growth is expected to strengthen while labour income gains are projected to moderate. Overall, nominal GDP growth is forecast to average 3.9 per cent over the five years of the outlook, down from average growth of 4.4 per cent over the past four years.
Corporate Income Growth to Strengthen While Labour Income Growth Moderates
Source: Statistics Canada, Ontario Economic Accounts and FAO.
Accessible version
This chart shows the historical and forecast growth rates for Ontario’s nominal GDP, labour income and corporate income from 2017 to 2022. Nominal GDP grew by 4.1 per cent in 2017. The FAO forecasts nominal GDP growth of 3.8 per cent in 2018 and 3.9 per cent from 2019 to 2022. Labour income grew by 4.7 per cent in 2017. The FAO forecasts labour income growth of 5.0 per cent in 2018, 4.2 per cent in 2019, 4.0 per cent in 2020 and 3.8 per cent in 2021 and 2022. Corporate income grew by 1.8 per cent in 2017. The FAO forecasts corporate income growth of 0.5 per cent in 2018, 2.4 per cent in 2019, 3.4 per cent in 2020 and 4.1 per cent in 2021 and 2022.
Key Risks
A number of domestic and foreign factors pose risks for Ontario’s economic outlook. These risk factors include elevated household debt, protectionist US trade policies, the possibility of a more adverse business response to US tax reforms and heightened global political uncertainty. If these risks materialize, economic growth could be slower than forecast by the FAO.
Household Debt
In 2017, Ontario households continued to accumulate debt faster than incomes grew. As a result, the ratio of household debt-to-disposable income in Ontario rose to 180 per cent in 2017, significantly higher than the rest of Canada average of 169 per cent.[19] To service this debt, Ontarians spent an average of 14 per cent of their disposable income on debt payments, a share that would be expected to increase as interest rates rise over the outlook.[20]
A sharper-than-expected rise in interest rates would further increase household debt payments, forcing households to scale back spending on goods and services. This could have potentially significant negative implications for the broader economy.
Compounding this risk are elevated house prices in some parts of the province, notably the Greater Toronto Area. While recent housing reforms and new financing regulations[21] have helped cool housing market activity, a sharper housing price correction remains a risk. A more dramatic decline in housing prices would negatively impact household wealth and likely weigh on consumer spending, leading to broader, economy-wide impacts.
Protectionist Trade Policies
Free and open trade, particularly with the US, is critical to Ontario’s economy. While the threat of a complete dismantling of NAFTA has largely been avoided, it remains unclear when the new United States-Mexico-Canada trade agreement will be ratified or whether the US Congress could demand further concessions. If negotiations on the agreement are re-opened, business investment would likely suffer in the interim as uncertainty over the North American trade relationship continues.
In addition, the future status of US tariffs on steel, aluminum and softwood lumber imports also remains unclear. The FAO’s outlook assumes that these tariffs do not materially impact Ontario exports and that no additional tariffs are imposed. However, a prolonged tariff battle or the imposition of additional tariffs by the United States would disrupt Ontario exports with the potential to significantly slow overall economic growth.
Business Investment and Competitiveness
The FAO outlook assumes Ontario businesses will boost investment to alleviate capacity pressures.[22] However, protectionist US trade policies as well as US tax reforms may delay, discourage or divert business investment in Ontario.
In 2018, the US lowered the federal corporate tax rate from 35 per cent to 21 per cent and introduced significantly more generous capital expensing rules. These US tax changes have negatively impacted Canada’s relative competitiveness and could potentially lead to reduced business investment in Canada and Ontario.
In response, the federal government announced new corporate tax measures, which the Province is paralleling. However, if businesses were to respond more strongly to the US tax changes, Ontario business investment could be weaker than projected by the FAO, reducing Ontario’s economic growth both in the short- and long-term.
Other Global Risks
In addition to domestic and trade-related risks for Ontario’s economic outlook, there are a number of international risks that could significantly impact the global economy with repercussions for the Ontario economy.
- A continuation of trade tensions between the US and China poses a major downside risk to global growth and commodity prices. If recently imposed US-China tariffs are not removed or if new tariffs are levied, global forecasts would likely be revised lower in 2019 as trade activity declines.
- The uncertainty surrounding Brexit negotiations continues to weigh on the UK and EU’s medium-term outlook, as do the post-Brexit trade barriers that are anticipated to hamper UK economic growth over the medium-term. At the same time, Italy’s debt challenges could devolve into a full crisis, threatening financial stability in the European Union.
- Volatility in global financial markets combined with rising interest rates have started to expose vulnerabilities in several emerging market economies which are facing increased pressure from capital outflows and rising dollar-denominated debt. With several emerging markets also facing political uncertainty, there are concerns that weak economic performance in these countries could lead to spillover effects for the global economy.
3 | Fiscal Outlook
Overview
The FAO projects Ontario’s budget deficit will increase from $3.7 billion in 2017-18 to $12.3 billion in 2018-19, the largest deficit since 2011-12. The sharp increase in the deficit, despite solid economic growth, is the result of a significant increase in program spending combined with a decline in overall revenue.
FAO Projects a Sharp Increase in Ontario’s 2018-19 Deficit

* Deficit estimates are presented without the reserve.
Source: Ontario Public Accounts, 2018 Ontario Economic Outlook and Fiscal Review (FES) and FAO.
Accessible version
This chart shows Ontario’s historical budget balance before the reserve in 2017-18 and the forecasted budget balance 2018-19 for both the FAO and the Ontario Fall Economic Statement.
The 2017-18 deficit was $3.7 billion. In 2018-19, the Government projects the deficit to be $13.5 billion, while the FAO forecasts the deficit to be $12.3 billion.
In the 2018 Ontario Economic Outlook and Fiscal Review (also referred to as the Fall Economic Statement or FES), the government forecast a budget deficit of $13.5 billion in 2018-19 (before reserve), $1.2 billion higher than the FAO’s projection. The government’s higher projected deficit for the current fiscal year is the result of a lower estimate for tax revenue.
In a departure from usual practice, the 2018 Fall Economic Statement did not include a medium-term fiscal forecast. In the absence of a fiscal projection by the government – including planned program spending – the FAO developed a status quo medium-term fiscal projection, which represents the expected fiscal outlook for Ontario given existing policies without anticipating any new government policy decisions.
In the FAO’s status quo projection, Ontario’s budget deficit rises to $15.1 billion in 2019-20 (an increase of $2.8 billion from 2018-19), largely due to reductions in revenue announced since the 2018 Budget. By 2022-23, the deficit is expected to exceed $16 billion.
Recent Policy Changes Increased Ontario’s Deficit Over the Outlook
Note: Budget Balance is presented before reserve. The deficit for 2017-18 reflects 2017-18 Public Accounts. Numbers may not add up due to rounding.
Source: Ontario Public Accounts, 2018 Ontario Economic Outlook and Fiscal Review and FAO.
Accessible version
This chart shows the historical and forecasted budget balance before the reserve from 2017-18 to 2022-23. The chart shows the FAO’s spring forecast as well as the FAO’s fall forecast, in addition to changes between the two forecasts.
In 2017-18 the deficit was $3.7 billion. The FAO’s fall forecast shows a deficit of $12.3 billion in 2018-19, which is $0.5 billion higher from Spring. The FAO’s fall deficit forecast rises to $15.1 billion in 2019-20, $15.0 billion in 2020-21 and $15.5 billion in 2021-22 and $16.4 billion 2022-2023. Compared to the spring, the deficit is higher by $2.7 billion in 2019-20, $2.4 billion in 2020-21, $2.2 billion in 2021-22 and $2.3 billion in 2022-23.
The current deficit projection is higher than the FAO’s spring outlook due to a combination of revenue and expenditure policy changes introduced since the 2018 Budget, coupled with a moderately weaker economic forecast.
Revenue Outlook
Ontario’s overall revenues experienced a significant jump in 2017-18, benefiting from solid tax revenue growth combined with a boost from several time-limited revenue sources.
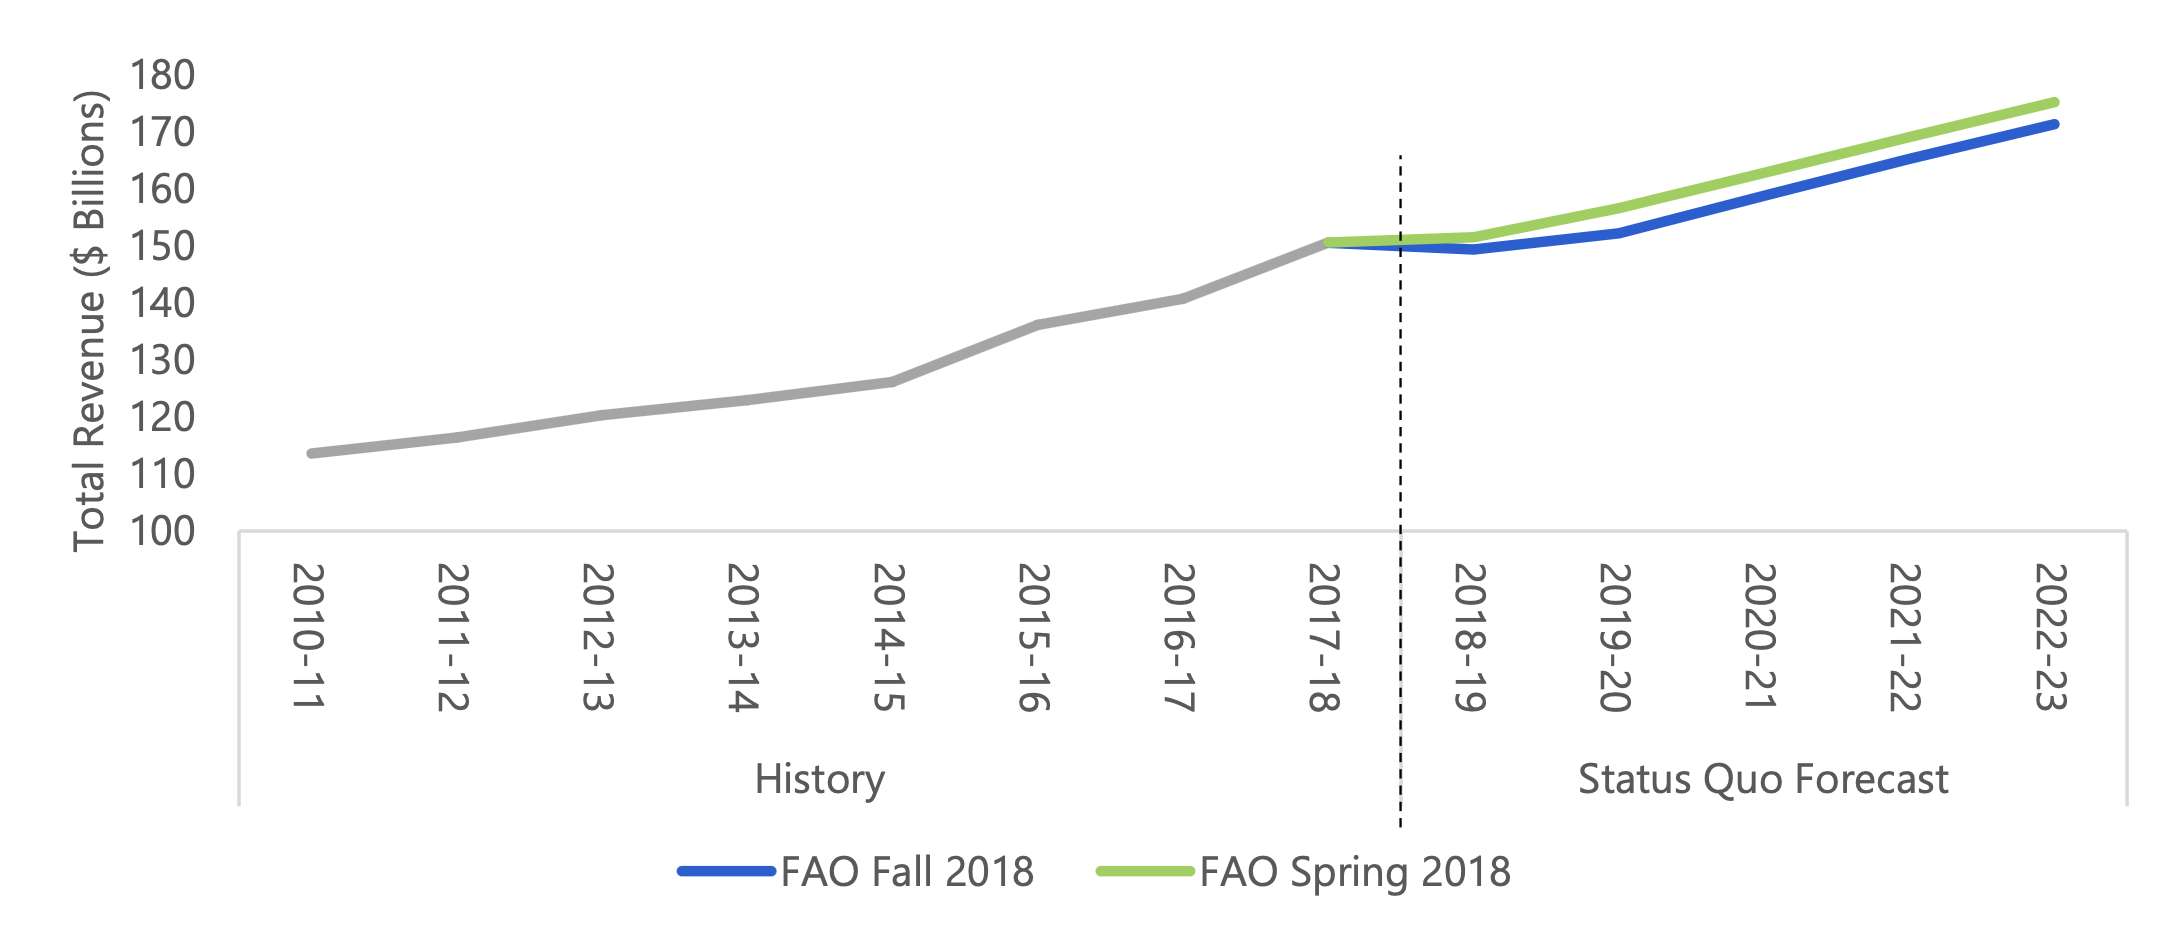
In 2018-19, total revenues are expected to decline[23] by $1.2 billion (0.8 per cent), due to a combination of policy changes and the loss of time-limited revenues.[24]
Over the outlook, total revenues are projected to grow at an average pace of 2.6 per cent per year, 0.5 percentage points slower than the FAO’s spring forecast. The slower growth is the result of:
- policy decisions since the 2018 Budget, which combine to significantly reduce revenues; and
- slightly weaker growth in key economic drivers, which lowers tax revenue compared to the spring outlook.
Ontario Revenues Decline in 2018-19
Source: Ontario Public Accounts, 2018 Ontario Economic Outlook and Fiscal Review and FAO.
Accessible version
This chart shows historical and forecasted total revenue from 2010-11 to 2022-23. This chart also shows the FAO’s previous forecast for total revenue from the FAO’s Spring 2018 forecast. The FAO’s current forecast for total revenue is lower than in the Spring for all forecast years. Importantly, the fall forecast shows revenues declining in 2018-19.
Policy Changes Since the 2018 Budget Lower Revenue
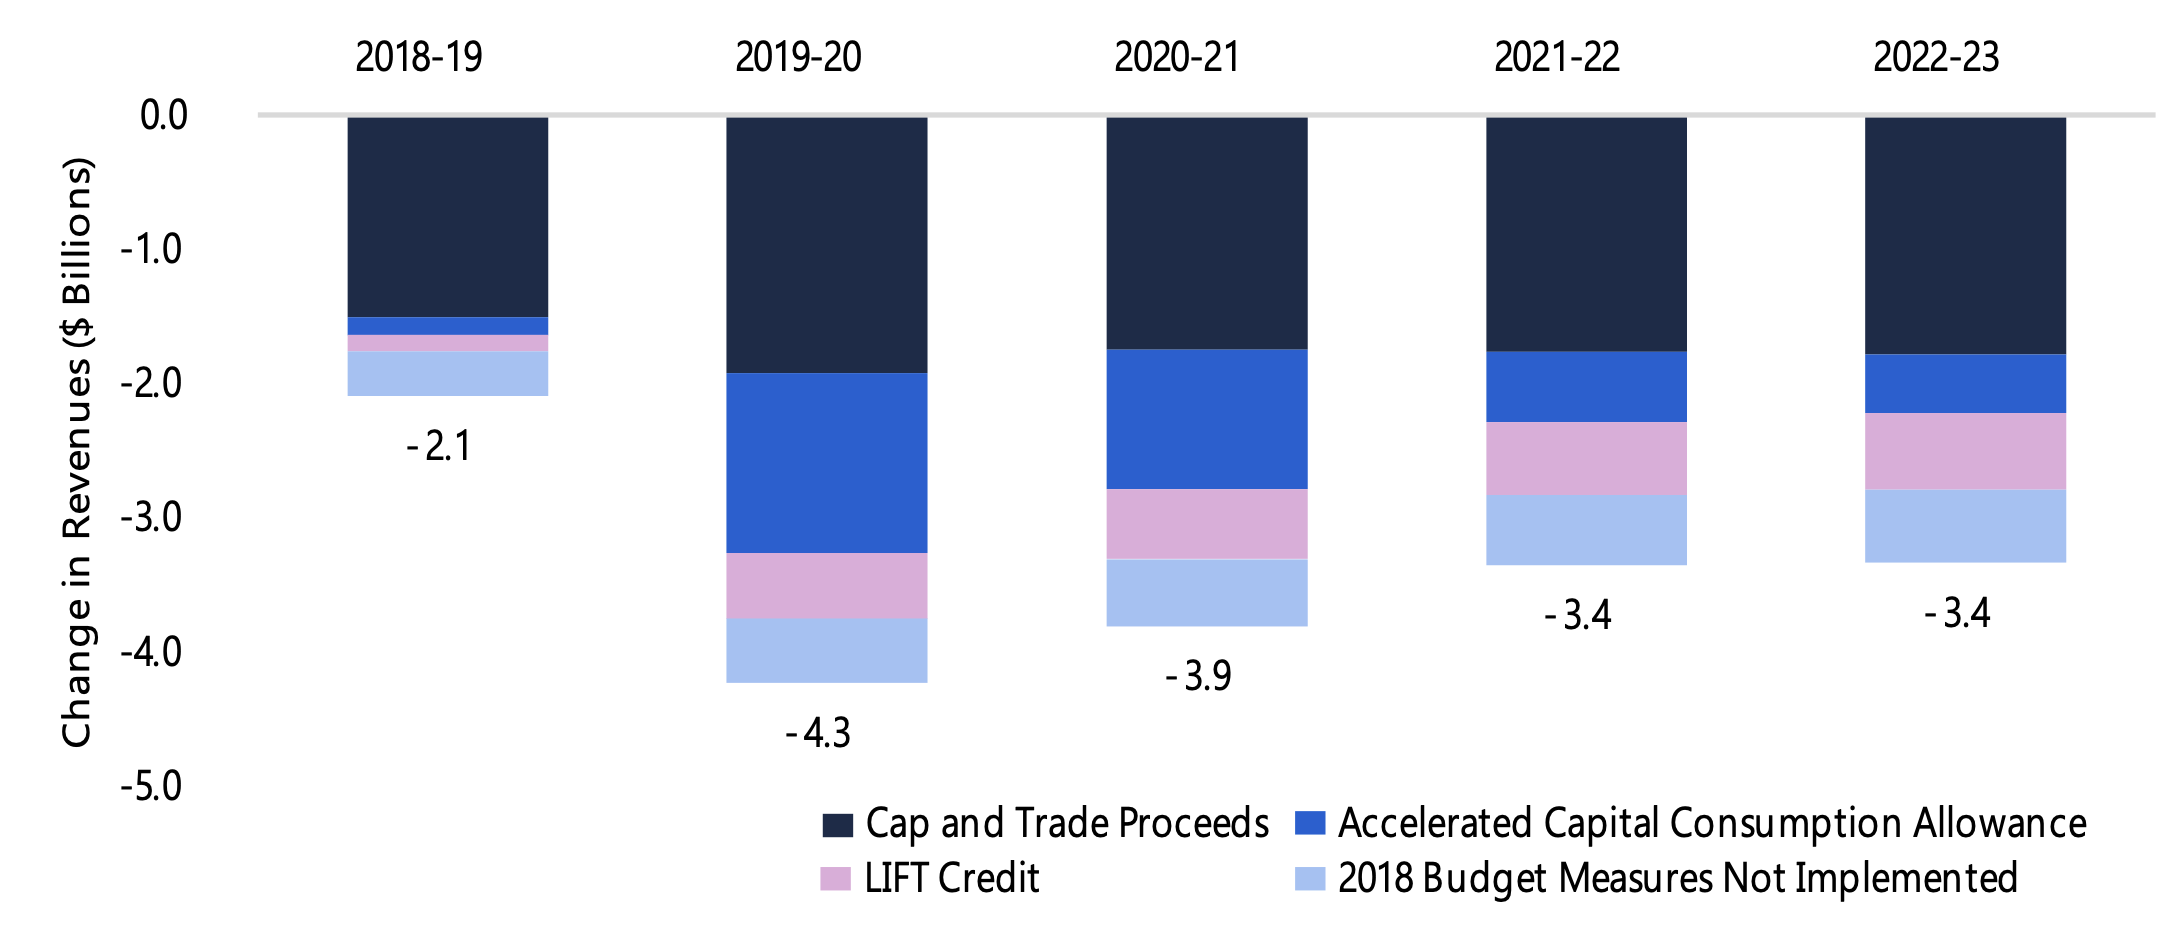
Policy decisions by the current Ontario government will reduce revenues by $2.1 billion in 2018-19, and by an average of $3.7 billion over the next four years.
- The cancellation of Ontario’s cap and trade program, ending the auction and trading of emission allowances[25], is projected to decrease revenues by an average of $1.7 billion each year over the outlook.[26]
- The 2018 Fall Economic Statement several tax measures introduced in the 2018 Budget.[27] Reversing these measures are projected to decrease revenues by roughly $0.5 billion per year over the outlook.
- In 2018, the US introduced tax reforms, which included a significant reduction in corporate income tax rates and allowed the immediate write-off of certain capital investments. The Canadian federal government responded with changes to Canadian tax rules,[28] which the Province has indicated will be paralleled in Ontario. These tax changes are estimated to reduce Ontario corporate tax revenue by an average of $0.8 billion per year from 2019-20 to 2022-23.[29]
- In the 2018 Fall Economic Statement, the government introduced the Low-Income Individuals and Families Tax (LIFT) Credit which will reduce Ontario Personal Income Tax (PIT) for low-income taxpayers starting in 2019. This tax measure is expected to reduce PIT revenues by an average of $0.5 billion each year over the outlook.
Revenue Reductions due to Policy Changes since the 2018 Budget
Source: 2018 Ontario Economic Outlook and Fiscal Review, 2018 Ontario Budget and FAO.
Accessible version
This chart shows the sources of revenue reductions due to policies since the 2018 Budget, which include Cap-and-Trade proceeds, accelerated capital consumption allowance, the LIFT credit and 2018 Budget measures that were not implemented. The FAO estimates total revenue reductions to be $2.1 billion in 2018-19, $4.3 billion in 2019-20, $3.9 billion in 2020-21 and $3.4 billion in 2021-22 and 2022-23.
| Revenue Source | Assumption | Forecast |
|---|---|---|
| Taxation Revenue | Grows with key economic drivers including labour income, corporate net income and household spending. | Average 3.5 per cent growth per year from 2018-19 to 2022-23. |
| Federal Transfers | Based on legislated growth rates and economic forecasts for Ontario and Canada. | Average 2.7 per cent growth per year from 2018-19 to 2022-23. |
| Government Business Enterprises (GBE) | Based on government projections from the 2018 FES for 2018-19 and the 2018 Budget for 2019-20 and 2020-21. For 2021-22 and beyond, assumed to grow at the same pace as nominal GDP. | Average 2.9 per cent growth per year from 2018-19 to 2022-23. |
| Other Revenue | Based on government projections for 2018-19. Grows at trend rate for 2019-20 to 2022-23. | Decrease from $19.9 billion in 2017-18 to $17.5 billion by 2022-23, mainly due to the cancellation of the cap and trade program. |
Spending Outlook
Based on the FAO’s status quo projection, total spending will grow by an average of 4.0 per cent per year from 2018-19 to 2022-23, reflecting a sharp jump in program spending in 2018-19 and accelerating interest on debt payments over the outlook.
In the 2018 Fall Economic Statement, program spending is expected to grow by 4.8 per cent to $149.2 billion in 2018-19. From 2019-20 to 2022-23, the FAO’s status quo projection assumes program spending will grow at an average annual rate of 3.5 per cent, in-line with the growth of program spending over the past four years. The FAO’s status quo projection reflects key demand and cost drivers for public services, as well as recent policy changes announced by the government.
Policy Changes Reduce Program Spending Over Outlook
The current government has announced a number of policy changes that will result in lower overall program spending over the outlook.[30]
- Several new health programs introduced in the 2018 Budget have been eliminated, including programs providing drug and dental coverage, OHIP+ expansion for seniors, and OHIP+ for children and youth already covered by private insurance. The government also reduced the investment in new mental health and addiction programs introduced in the 2018 Budget.[31]
- The cancellation of the cap and trade program reduced program spending by $0.8 billion in 2018-19, growing to $1.1 billion by 2022-23.[32]
- The government scaled back increases in social assistance benefits from 3.0 per cent (as proposed in the 2018 Budget) to 1.5 per cent, reducing social assistance spending by $0.3 billion per year.
- The government is also expected to eliminate the publicly-funded preschool child care program announced in the 2018 Budget, which is expected save around $1 billion, beginning 2020-21.[33]
On net, these changes are expected to reduce program spending by $1.7 billion in 2018-19, growing to $3.8 billion by 2022-23.
Spending Reductions from Policy Announcements since the 2018 Budget
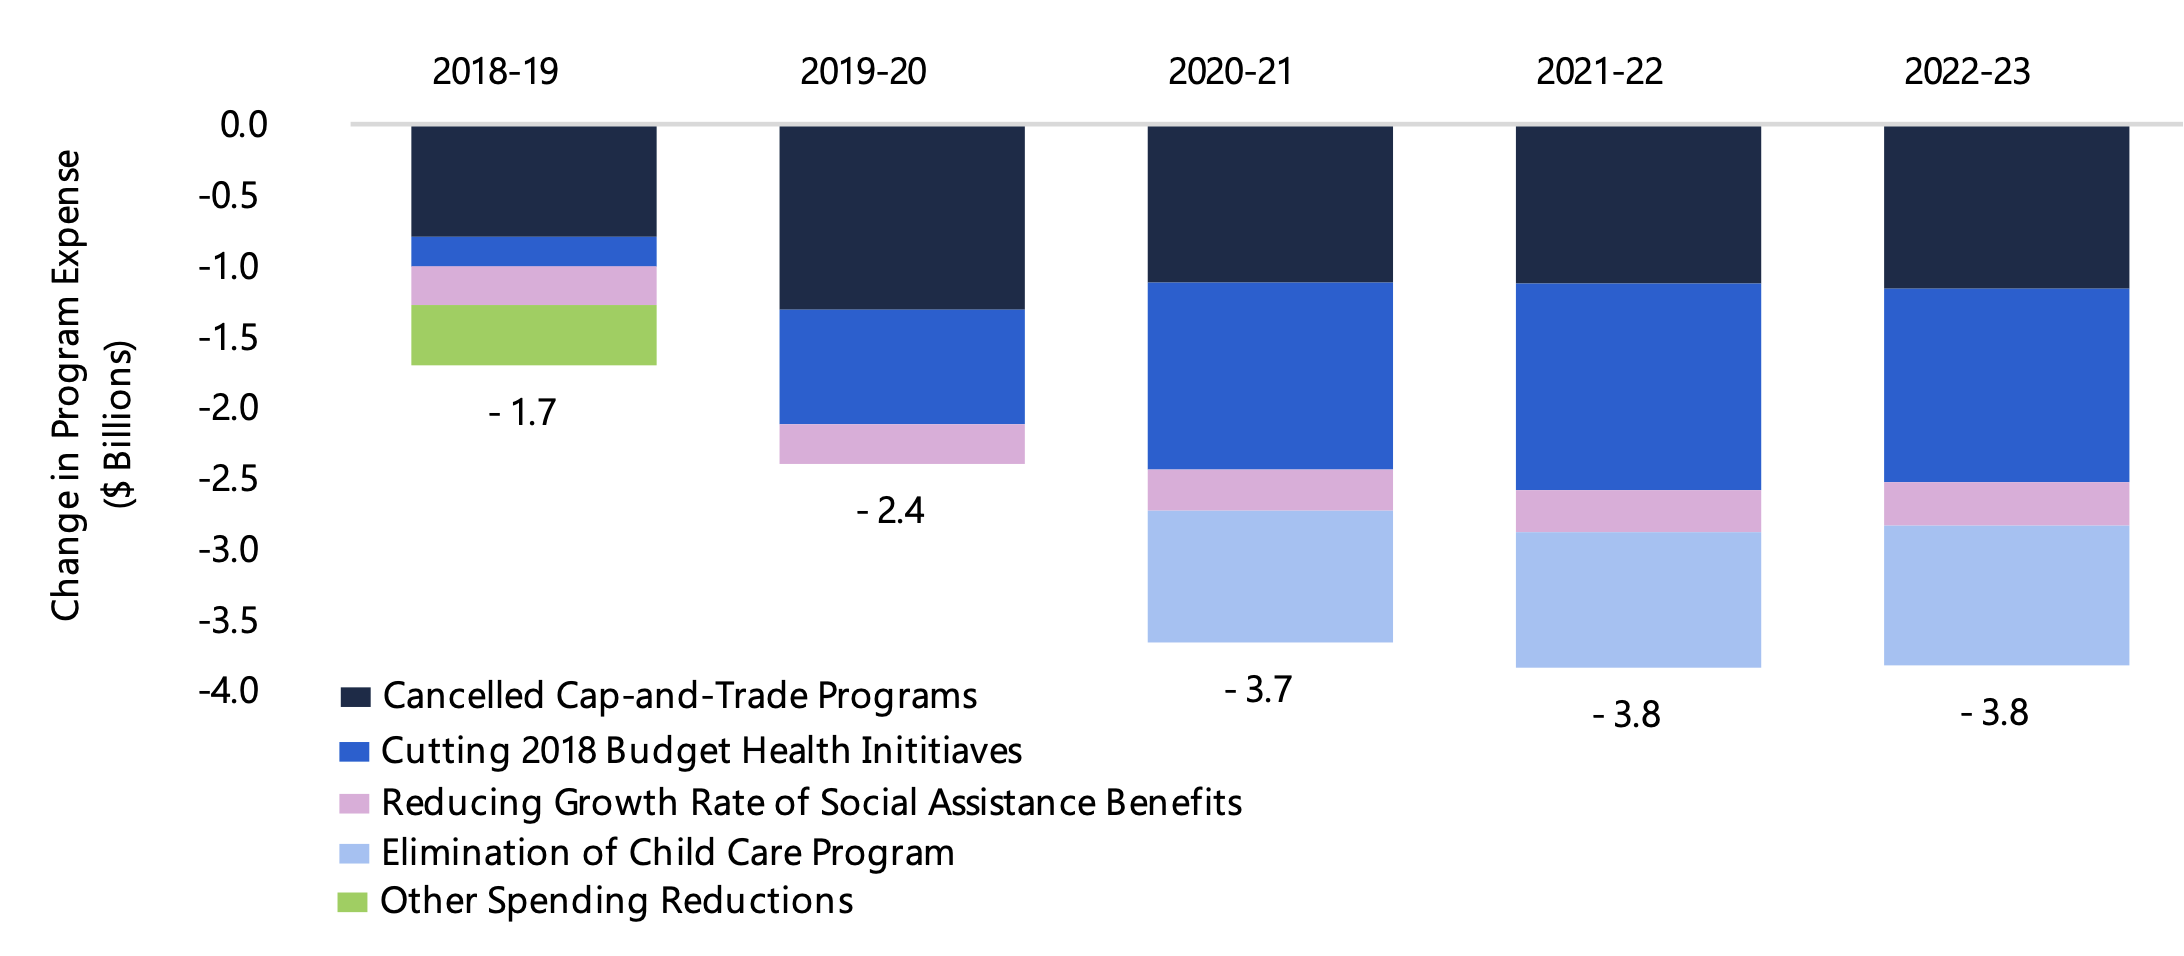
Note: Other spending reductions includes elimination of a number of postsecondary education and employment training programs, and other smaller programs.
Source: 2018 Ontario Economic Outlook and Fiscal Review, 2018 Ontario Budget and FAO.
Accessible version
This chart shows the sources of spending reductions due to policies since the 2018 Budget, which include the elimination of Cap-and-Trade programs, the cutting of 2018 Budget health initiatives and the reduction in the growth rate of social assistance benefits as well as other reductions. The FAO estimates total spending reductions to be $1.7 billion in 2018-19, $2.4 billion in 2019-20, $3.7 billion in 2020-21 and $3.8 billion in 2021-22 and 2022-23.
In the 2018 Fall Economic Statement, the government identified $3.2 billion in program expense savings for 2018-19.
The government’s $3.2 billion in expenditure savings is composed of:
- $1.7 billion in lower program spending relative to the 2018 Budget estimate, largely the result of eliminating programs introduced by the previous government; and
- $1.4 billion in ministry underspending, expense reprofiling or program efficiencies – often referred to as year-end savings.
Notably, the 2018 Budget assumed that $1.4 billion in year-end savings would be achieved in 2018-19.
| Sector | Assumption | Average Growth from 2019-20 to 2022-23 |
|---|---|---|
| Health | Spending increases with population growth and aging, and price inflation. | 4.0 per cent |
| Education | Spending grows with the projected rate of student enrolment and price inflation. | 3.4 per cent |
| Children’s and Social Services | Spending rises with projected youth population, and planned increases in social assistance benefits. | 3.3 per cent |
Interest on Debt Payments to Increase
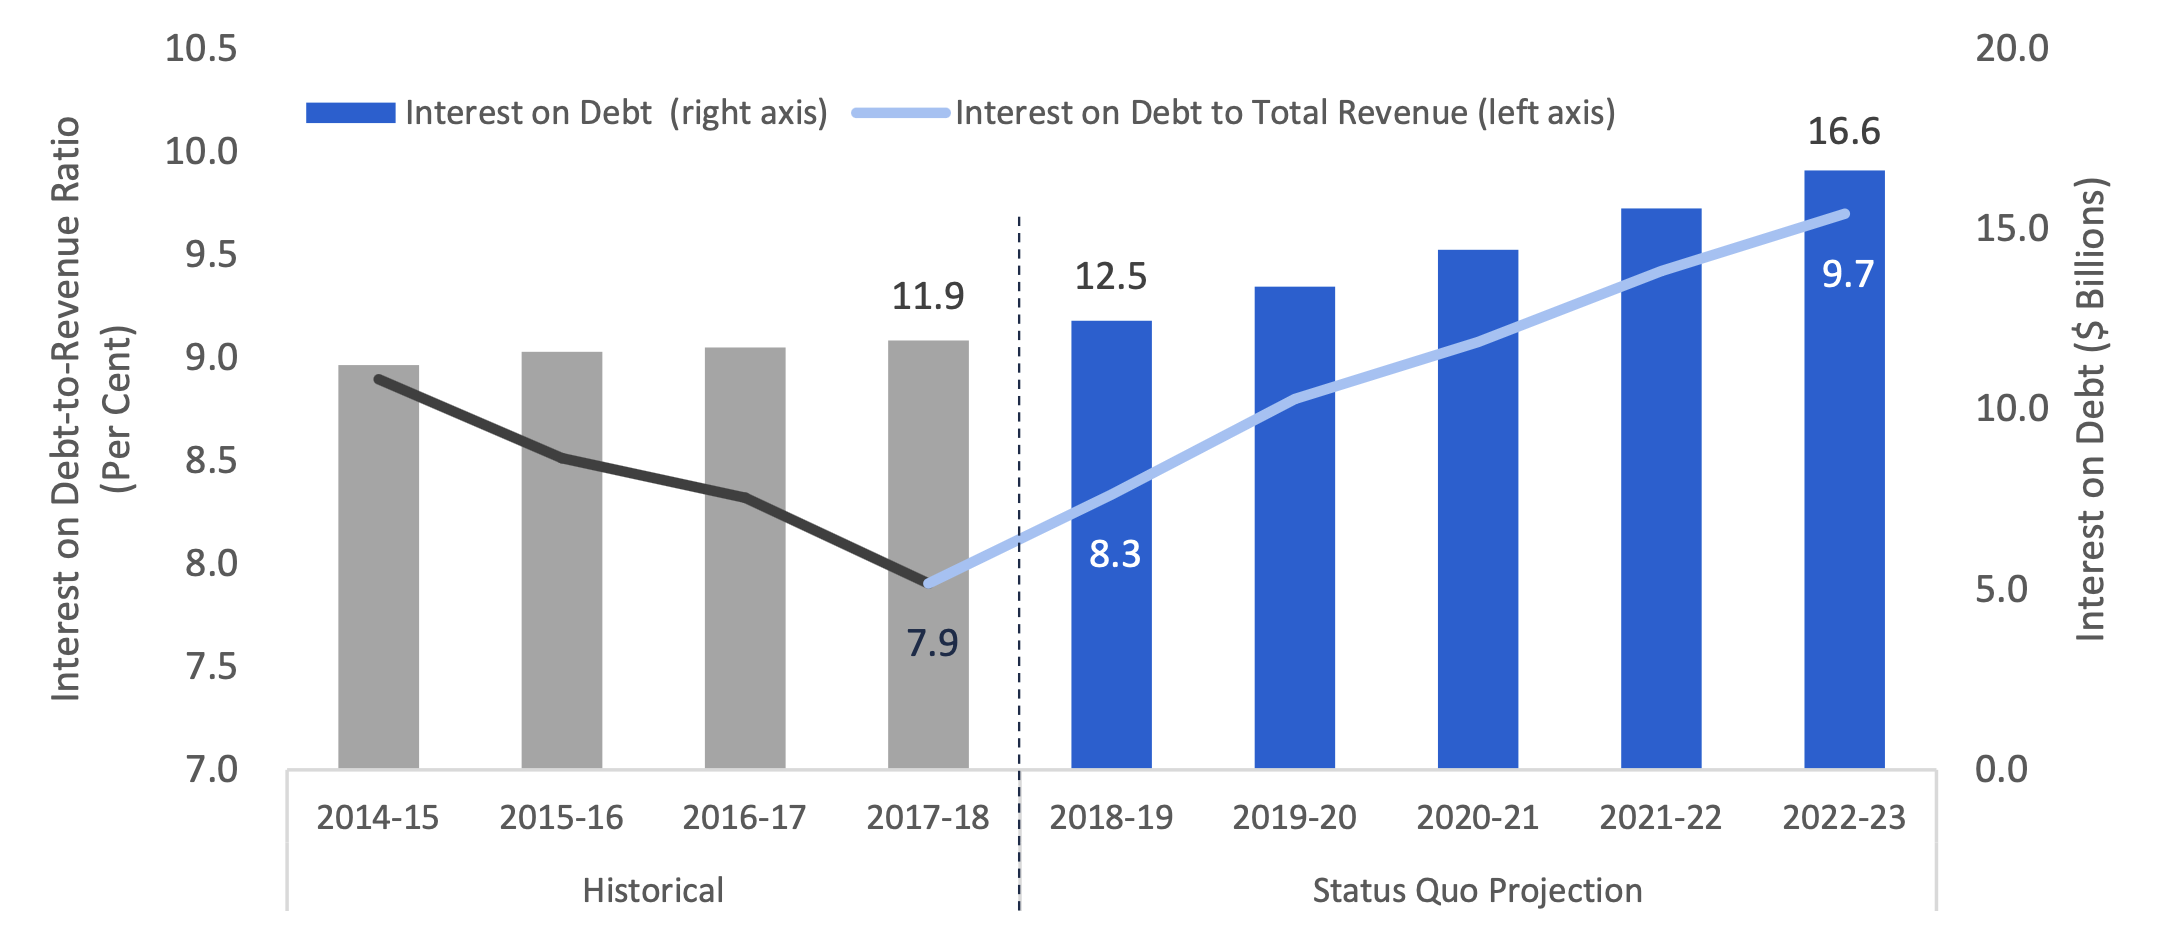
In the FAO’s status quo projection, interest on debt (IOD) payments are forecast to increase by an average of 6.9 per cent per year from 2018-19 to 2022-23, a significant acceleration from 1.6 per cent average growth over the last four years. Based on the FAO’s projection, Ontario will be spending $16.6 billion on IOD payments by 2022-23, approximately $4.2 billion higher than interest payments this year.
Rising IOD payments will lead to sharp increases in the ratio of IOD to total revenue, a key measure of the government’s ability to finance its debt. By 2022-23, IOD payments are projected to account for 9.7 per cent of total revenues, an increase of nearly two percentage points from 2017-18.
Ontario’s Interest on Debt Expense Projected to Rise Sharply
Source: Ontario Public Accounts, 2018 Ontario Economic Outlook and Fiscal Review, 2018 Ontario Budget and FAO.
Accessible version
This chart shows the historical and forecasted level of interest on debt and interest on debt as a share of total revenue from 2014-15 to 2022-23. The chart shows that interest on debt is expected to rise from $11.9 billion in 2017-18 to $16.6 billion in 2022-23. The chart also shows that interest on debt as a share of total revenue is expected to steadily increase from 7.9 per cent in 2017-18 to 9.7 per cent in 2022-23.
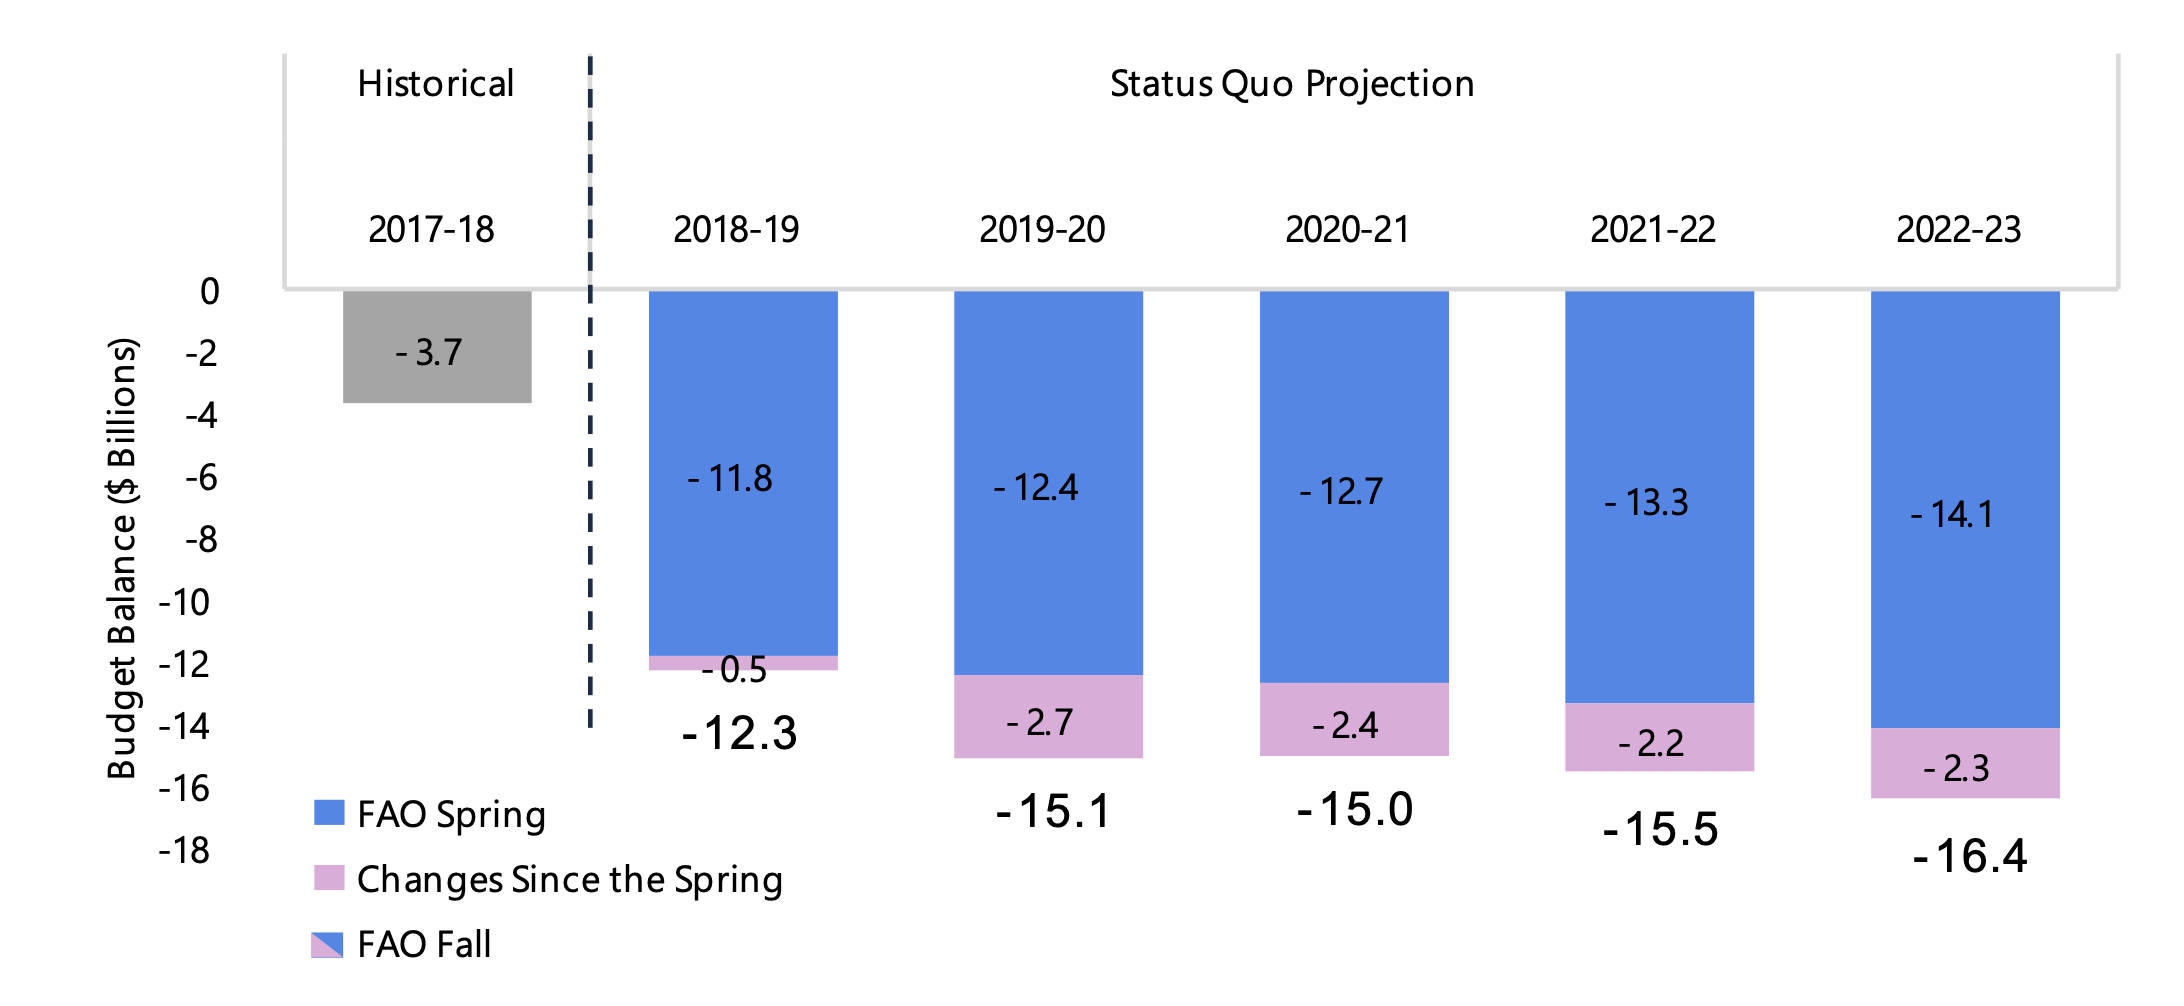
Budget Balance
The FAO projects Ontario’s budget deficit will increase from $3.7 billion in 2017-18 to $12.3 billion in 2018-19. The sharp increase in the deficit this year reflects a significant increase in program spending combined with a decline in overall revenue.
Based on the FAO’s projection, Ontario’s budget deficit would be expected to increase to $15.1 billion in 2019-20, largely the result of policy changes announced since the previous government’s 2018 Budget. Over the next four years, in the absence of any policy action, the budget deficit would continue rising, exceeding $16 billion by 2022-23.
The current deficit projection is higher than the FAO’s spring outlook due to a combination of revenue and expenditure policy changes introduced since the 2018 Budget, coupled with a moderately weaker economic forecast.
Recent Policy Changes Increased Ontario’s Deficit Over the Outlook
Note: Budget Balance is presented before reserve. The deficit for 2017-18 reflects 2017-18 Public Accounts. Numbers may not add up due to rounding.
Source: Ontario Public Accounts, 2018 Ontario Economic Outlook and Fiscal Review and FAO.
Accessible version
This chart shows the historical and forecasted budget balance before the reserve from 2017-18 to 2022-23. The chart shows the FAO’s spring forecast as well as the FAO’s fall forecast, in addition to changes between the two forecasts.
In 2017-18 the deficit was $3.7 billion. The FAO’s fall forecast shows a deficit of $12.3 billion in 2018-19, which is $0.5 billion higher from Spring. The FAO’s fall deficit forecast rises to $15.1 billion in 2019-20, $15.0 billion in 2020-21 and $15.5 billion in 2021-22 and $16.4 billion 2022-2023. Compared to the spring, the deficit is higher by $2.7 billion in 2019-20, $2.4 billion in 2020-21, $2.2 billion in 2021-22 and $2.3 billion in 2022-23.
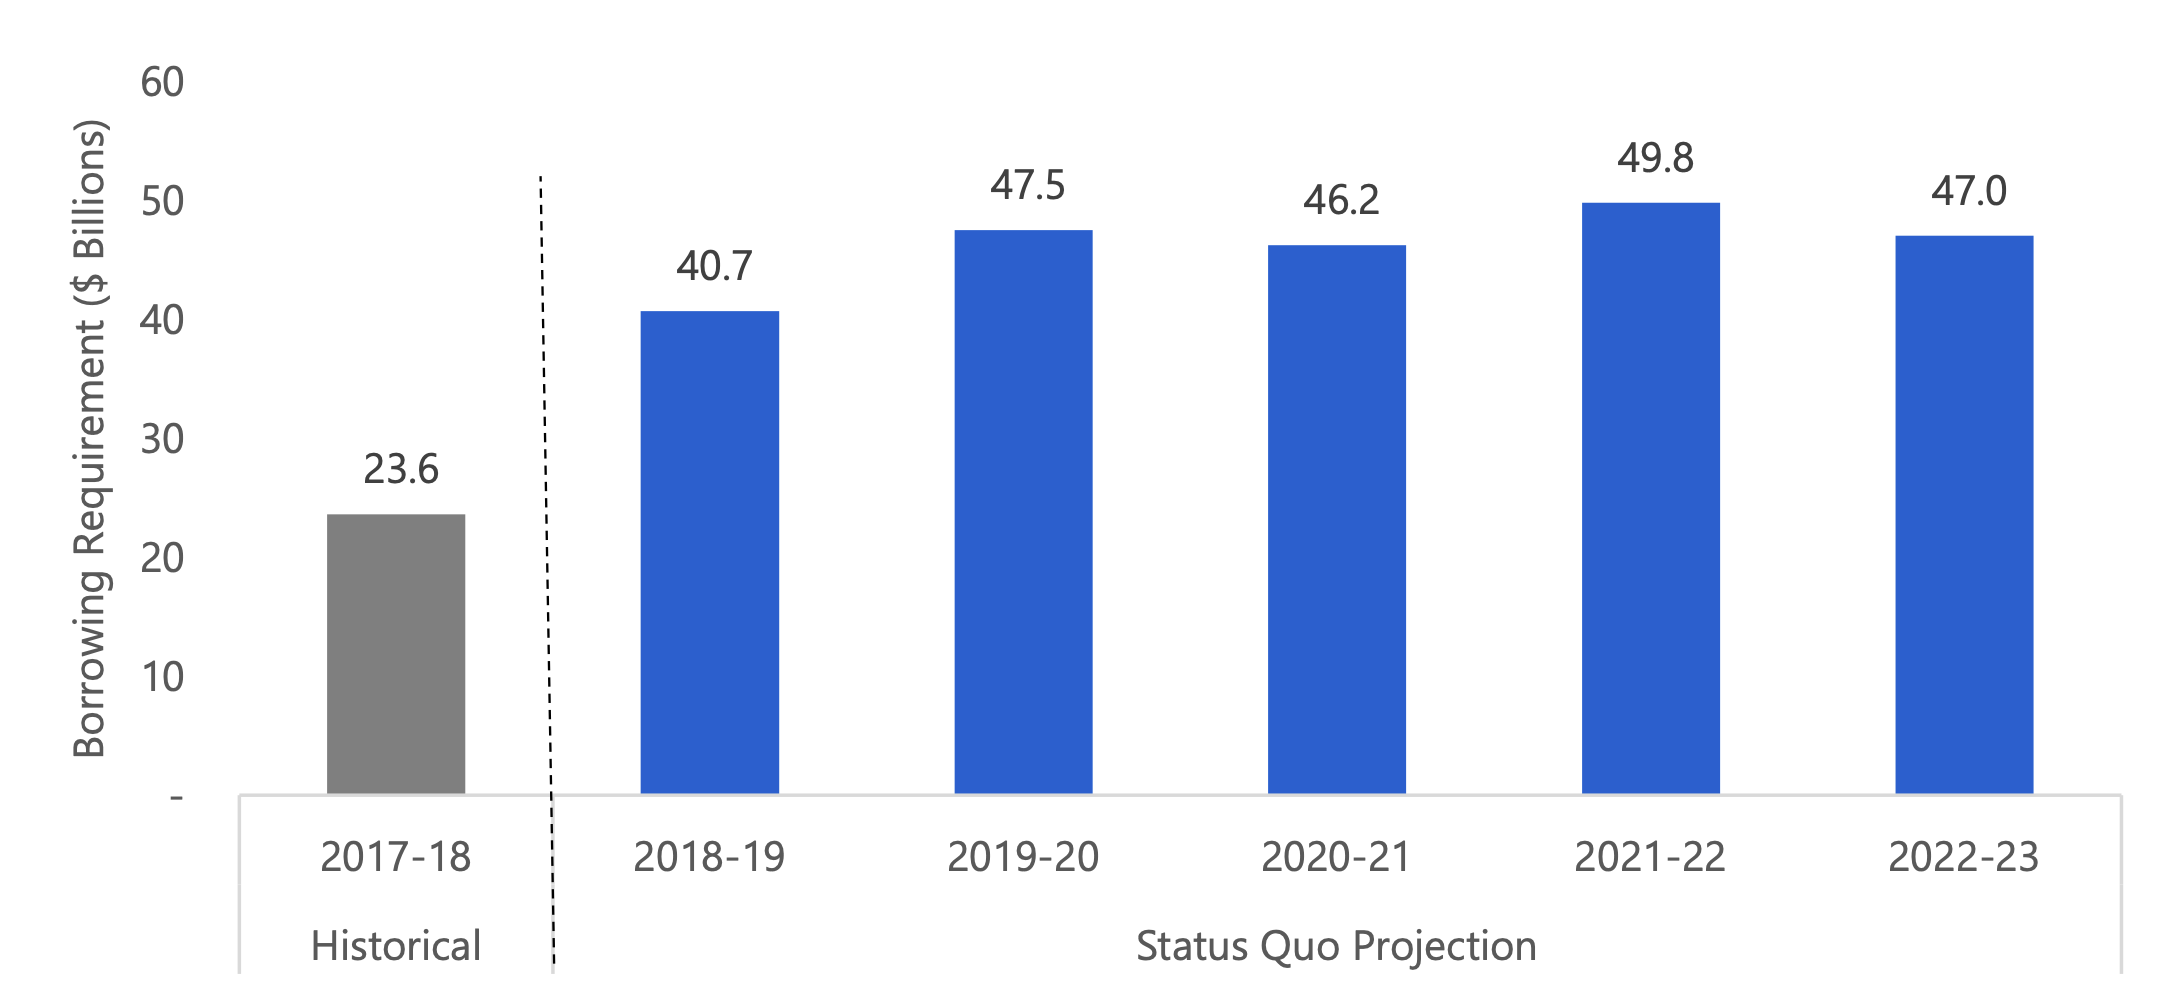
Borrowing and Net Debt
Based on the FAO’s projection, government borrowing – to finance budget deficits, capital expenditures and maturing debt – is expected to average $46 billion per year over the next five years, almost double the borrowing requirement in 2017-18.
Ontario’s Borrowing to Rise Over Outlook
Source: Ontario Public Accounts, 2018 Ontario Economic Outlook and Fiscal Review, and FAO.
Accessible version
This chart shows the historical and forecasted total borrowing requirement from 2017-18 to 2022-23. Government borrowing was $23.6 billion in 2017-18. The FAO forecasts government borrowing of $40.7 billion in 2018-19. Based on the FAO’s status quo forecast, government borrowing will be $47.5 billion in 2019-20, $46.2 billion in 2020-21, $49.8 billion in 2021-22 and $47.0 billion in 2022-23.
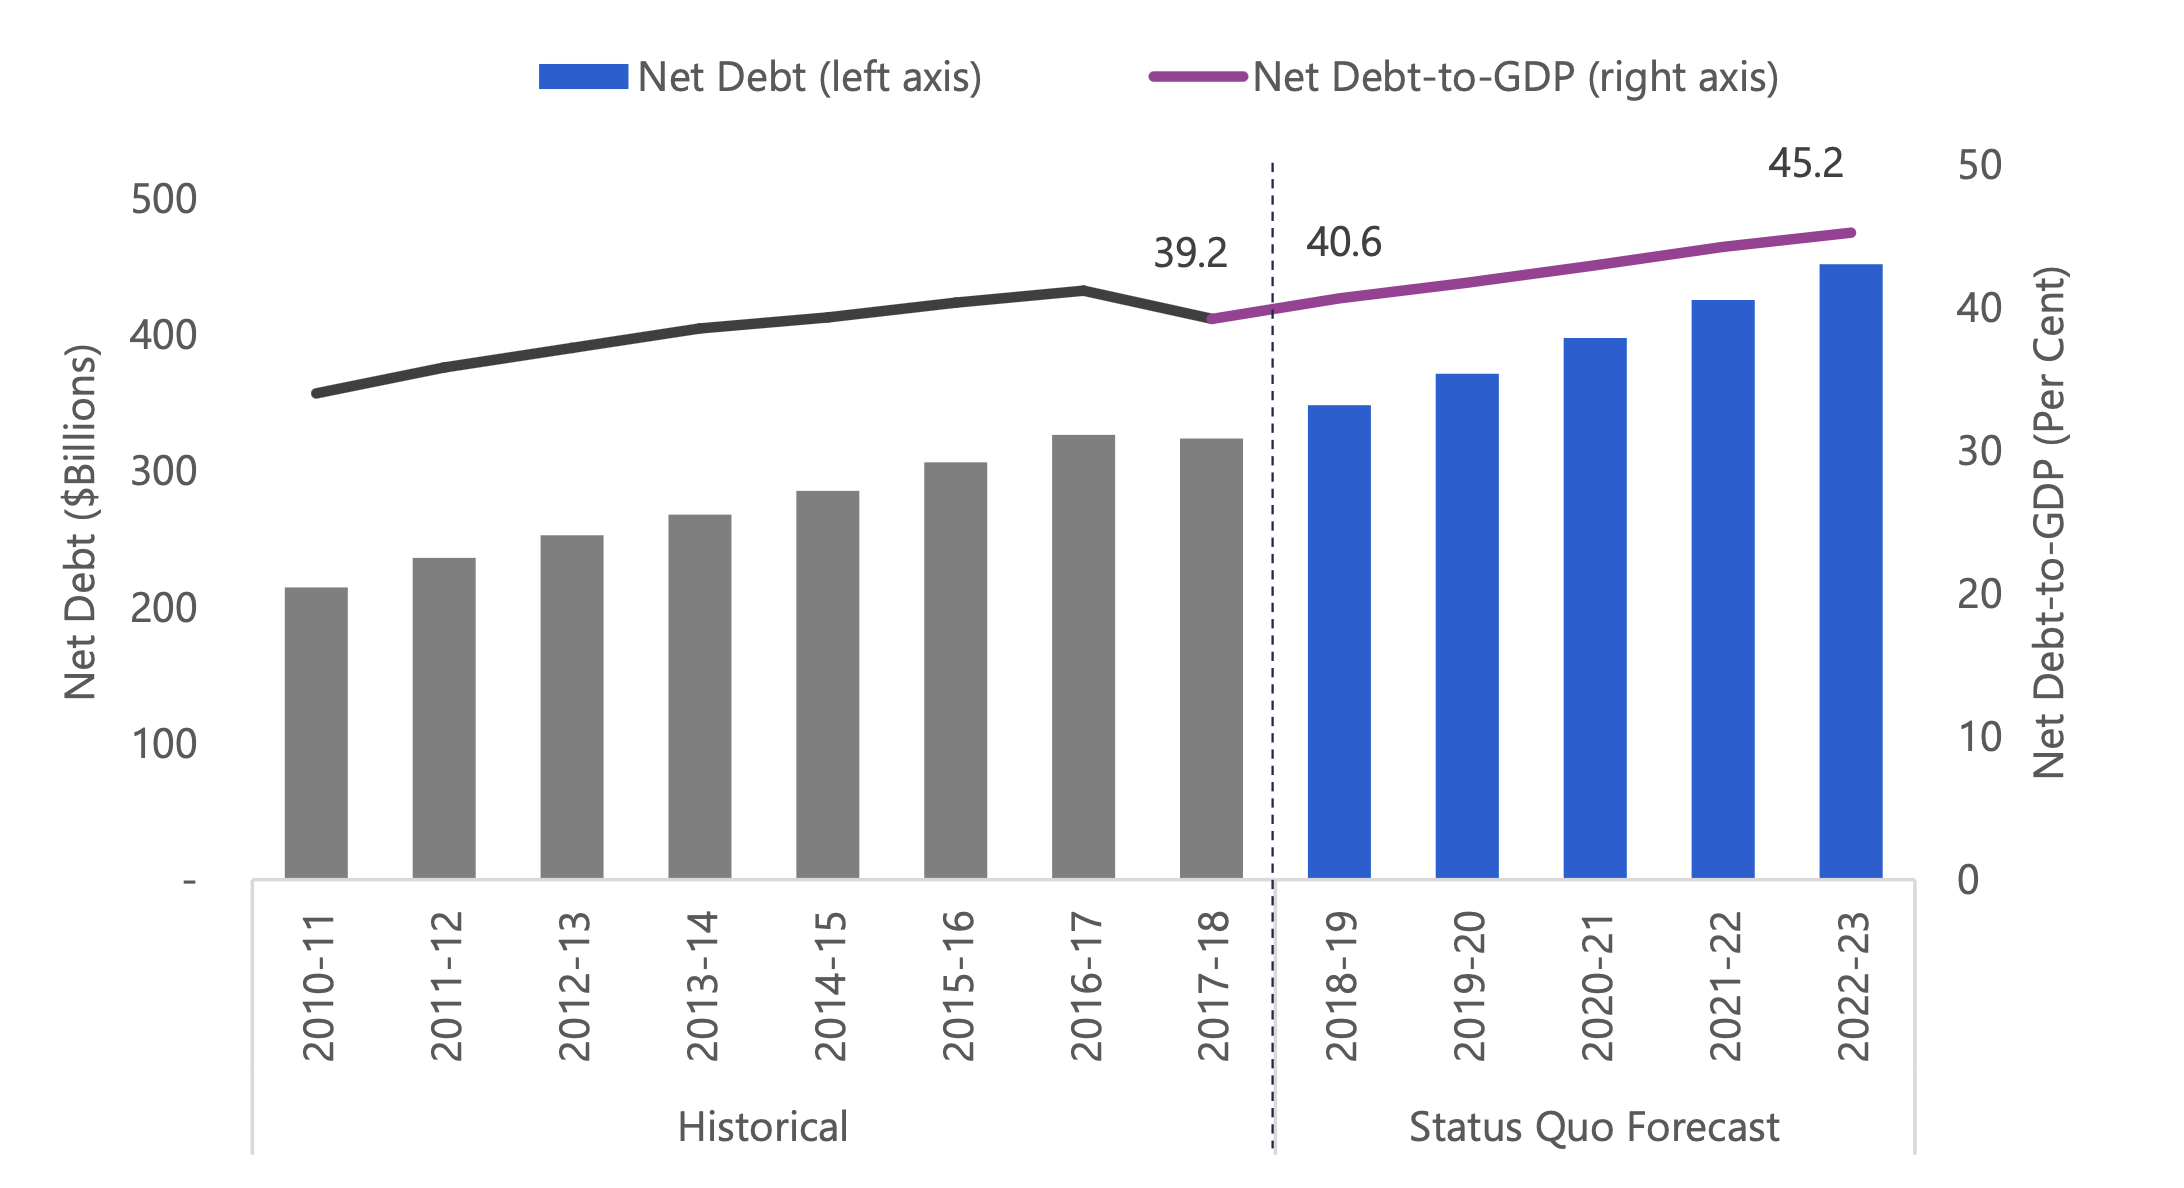
Based on the FAO’s status quo projection, on-going deficits contribute to an increase in net debt of more than $100 billion over the outlook, from $348 billion in 2018-19 to over $450 billion by 2022-23. As a result, Ontario’s net debt-to-GDP ratio is projected to rise to 45.2 per cent by 2022-23, up sharply from 40.6 per cent in 2018-19.
Elevated Net Debt and Net Debt-to-GDP Ratio
Source: Ontario Public Accounts, 2018 Ontario Economic Outlook and Fiscal Review, and FAO.
Accessible version
This chart shows the historical and forecasted net debt and net debt-to-GDP ratio from 2010-11 to 2022-23. The FAO’s forecast shows net debt rising over the outlook from $324 billion in 2017-18 to $452 billion in 2022-23. The FAO’s forecast also shows net debt-to-GDP rising over the outlook from 39.2 per cent in 2017-18 to 45.2 per cent in 2022-23.
Balancing Ontario’s Budget Will Require Significant Policy Changes
When the Ontario budget is in deficit, the Fiscal Transparency and Accountability Act (FTAA) requires the government to develop a fiscal recovery plan to balance the budget.[34] Accordingly, the FAO has developed a balanced budget scenario to illustrate the reductions in spending or increases in revenue required to eliminate the deficit over the next four years.
To achieve a balanced budget by 2022-23 through expense restraint alone, the government would need to limit program spending growth to 1.2 per cent per year on average from 2019-20 to 2022-23. This would represent the slowest pace of program spending growth over a four-year period since the mid-1990s. Restraining total spending to this extent would imply that spending per person would have to be reduced by $850 (or 8 per cent) by 2022-23, after adjusting for inflation.
Balancing the Budget Without Raising Revenue Would Require Spending $850 Less Per Ontarian
Source: Ontario Public Accounts, 2018 Ontario Economic Outlook and Fiscal Review, and FAO.
Accessible version
This chart compares historical and forecasted program spending per capita from 2012-13 to 2022-23 under the FAO’s status quo projection and the balanced budget scenario. The chart highlights that the government would have to reduce program spending per capita by $850 from 2018-19 values in order to achieve a balanced budget by 2022-23.
Alternatively, achieving a balanced budget through tax increases alone would require a significant 12 per cent increase in total tax revenue. (See the Fiscal Risks and Budget Sensitivities section for estimates of the deficit impact of different tax increase options).
Economic Impact of Cutting Spending or Raising Taxes
To balance the budget by 2022-23, the government would need to reduce spending or increase revenues by 1.4 per cent of nominal GDP, which would place a significant drag on economic and employment growth.
However, slower economic growth would also dampen government tax revenue growth, making it even more challenging for the government to achieve budget balance.
Balancing the budget will require significant policy changes that could have wide-ranging impacts on Ontario households and businesses as well as the overall economy.
Fiscal Risks and Budget Sensitivities
Changes in Ontario’s current revenue or expense policies, as well as external factors can have a significant impact on Ontario’s budget balance. The FAO estimated the sensitivity of Ontario’s budget balance to changes in four key areas: tax policy, federal transfers, expenditure policy and economic risks.
If the government permanently raised personal income tax (PIT) rates in 2019-20 to generate 10 per cent more PIT revenue (roughly an additional $500 per taxpayer on average in that year), Ontario’s deficit would fall by $3.8 billion in the first year and by $5 billion in 2022-23. Similarly, if the government raised the HST rate from 8 per cent to 9 per cent beginning in 2019-20, the deficit would decrease by $3.6 billion in the first year and by $4.6 billion in 2022-23.
For spending, if the government was able to reduce the growth rate of health care expense by 1 per cent in each year of the projection, Ontario’s deficit would improve by $3.1 billion by 2022-23. Alternatively, if the growth of social assistance benefit rates were reduced by 1 percentage point in 2019-20, it would save $0.5 billion by 2022-23.
As discussed in the Economic Outlook chapter, there are several key risks that could negatively impact Ontario’s economic growth. If these risks were to materialize into a 1 per cent decrease in Ontario’s nominal GDP in 2019-20, along with an assumed, corresponding 0.5 per cent decrease in interest rates, the deficit would increase by $1.2 billion in 2019-20, growing to $1.5 billion by 2022-23.
| Deficit reduction in: | ||
|---|---|---|
| Change Beginning in 2018-19 | 2019-20 | 2022-23 |
| Tax Policy | ||
| A sustained 10 per cent increase in Personal Income Tax revenues ($500 per tax filer in 2019-20) over the projection | $3.8 billion | $5.0 billion |
| A sustained 1 percentage point increase in the general Corporations Tax rate over the projection | $1.1 billion | $1.5 billion |
| A sustained 1 percentage point increase in the HST rate over the projection | $3.6 billion | $4.6 billion |
| Federal Transfers | ||
| A sustained 1 percentage point increase in the annual growth of the Canada Health Transfer over the projection | $0.2 billion | $0.8 billion |
| A sustained 1 percentage point increase in the annual growth of the Canada Social Transfer over the projection | $0.1 billion | $0.3 billion |
| Expenditure Policy | ||
| A sustained 1 percentage point decrease in the growth rate of health care spending over the projection | $0.6 billion | $3.1 billion |
| A sustained 1 percentage point decrease in the growth rate of social assistance benefits over the projection | $0.1 billion | $0.5 billion |
| Economic Risks | ||
| A sustained 1 percentage point increase in Ontario’s effective borrowing rate over the projection | -$0.4 billion | -$2.0 billion |
| A 1 percentage point decrease in Ontario’s nominal GDP growth for one year, combined with a 50 basis point decrease in nominal interest rates | -$1.2 billion | -$1.5 billion |
4 | Appendices
Forecast Tables
| (Per Cent Growth) | 2016a | 2017a | 2018f | 2019f | 2020f | 2021f | 2022f | Average* |
|---|---|---|---|---|---|---|---|---|
| Nominal GDP | ||||||||
| FAO – Fall 2018 | 4.4 | 4.1 | 3.8 | 3.9 | 3.9 | 3.9 | 3.9 | 3.9 |
| 2018 Ontario FES | 4.4 | 4.1 | 3.8 | 3.8 | 3.5 | 3.2 | – | 3.6 |
| Consensus ** | 4.4 | 4.1 | 3.9 | 3.9 | 3.6 | 3.3 | – | 3.7 |
| Labour Income | ||||||||
| FAO – Fall 2018 | 1.8 | 4.7 | 5.0 | 4.2 | 4.0 | 3.8 | 3.8 | 4.3 |
| 2018 Ontario FES *** | 1.8 | 4.7 | 4.8 | 4.0 | 4.1 | 3.9 | – | 4.2 |
| Corporate Profits | ||||||||
| FAO – Fall 2018 | 15.8 | 1.8 | 0.5 | 2.4 | 3.4 | 4.1 | 4.1 | 2.6 |
| 2018 Ontario FES | 15.8 | 1.8 | 0.6 | 3.4 | 3.0 | 4.7 | – | 2.9 |
| Household Consumption | ||||||||
| FAO – Fall 2018 | 4.0 | 5.1 | 4.3 | 3.9 | 3.8 | 3.8 | 3.8 | 4.0 |
| 2018 Ontario FES | – | – | – | – | – | – | – | – |
| (Per Cent Growth) | 2016a | 2017a | 2018f | 2019f | 2020f | 2021f | 2022f | Average* |
|---|---|---|---|---|---|---|---|---|
| Real GDP | ||||||||
| FAO – Fall 2018 | 2.3 | 2.8 | 2.2 | 2.1 | 2.0 | 1.9 | 1.9 | 2.0 |
| 2018 Ontario FES | 2.3 | 2.8 | 2.0 | 1.8 | 1.7 | 1.5 | – | 1.8 |
| Consensus ** | 2.3 | 2.8 | 2.1 | 1.9 | 1.7 | 1.6 | – | 1.8 |
| Real GDP Components | ||||||||
| Household Consumption *** | 2.7 | 3.9 | 2.4 | 1.9 | 1.8 | 1.8 | 1.8 | 2.0 |
| Residential Investment | 7.5 | 1.0 | -2.8 | 0.0 | 1.8 | 2.1 | 2.4 | 0.3 |
| Business Investment **** | -6.1 | 4.8 | 8.5 | 4.0 | 3.4 | 3.0 | 2.7 | 4.7 |
| Government (Consumption and Investment) | 0.3 | 2.6 | 3.0 | 1.8 | 1.6 | 1.4 | 1.3 | 1.9 |
| Exports | 2.7 | 1.8 | 1.1 | 2.5 | 2.3 | 2.1 | 2.0 | 2.0 |
| Imports | 1.3 | 5.1 | 2.0 | 2.0 | 2.0 | 1.9 | 1.8 | 2.0 |
| 2016a | 2017a | 2018f | 2019f | 2020f | 2021f | 2022f | |
|---|---|---|---|---|---|---|---|
| Employment (Per Cent Growth) | |||||||
| FAO – Fall 2018 | 1.1 | 1.8 | 1.6 | 1.2 | 1.0 | 0.9 | 0.9 |
| Ontario FES 2018 | 1.1 | 1.8 | 1.5 | 1.2 | 1.0 | 0.8 | – |
| Unemployment Rate (Per Cent) | |||||||
| FAO – Fall 2018 | 6.5 | 6.0 | 5.7 | 5.7 | 5.8 | 5.8 | 5.8 |
| Ontario FES 2018 | 6.5 | 6.0 | 5.6 | 5.5 | 5.5 | 5.5 | – |
| Labour Force (Per Cent Growth) | |||||||
| FAO – Fall 2018 | 0.9 | 1.2 | 1.2 | 1.2 | 1.1 | 0.9 | 0.9 |
| Ontario FES 2018 | – | – | – | – | – | – | – |
| Population Growth (Per Cent) | |||||||
| FAO – Fall 2018 | 1.4 | 1.6 | 1.6 | 1.5 | 1.4 | 1.3 | 1.2 |
| Ontario FES 2018 | – | – | – | – | – | – | – |
| CPI Inflation (Per Cent Growth) | |||||||
| FAO – Fall 2018 | 1.8 | 1.7 | 2.4 | 2.1 | 2.1 | 2.1 | 2.1 |
| Ontario FES 2018 | 1.8 | 1.7 | 2.5 | 2.1 | 2.0 | 1.6 | – |
| Canada Real GDP (Per Cent Growth) | |||||||
| FAO – Fall 2018 | 1.1 | 3.0 | 2.1 | 2.1 | 1.9 | 1.9 | 1.9 |
| Ontario FES 2018 | – | – | – | – | – | – | – |
| US Real GDP (Per Cent Growth) | |||||||
| FAO – Fall 2018 | 1.6 | 2.2 | 3.0 | 2.5 | 2.0 | 1.8 | 1.8 |
| Ontario FES 2018 | 1.6 | 2.2 | 2.9 | 2.6 | 1.8 | 1.8 | – |
| Canadian Dollar (Cents US) | |||||||
| FAO – Fall 2018 | 75.5 | 77.0 | 77.4 | 77.3 | 78.2 | 78.9 | 79.6 |
| Ontario FES 2018 | 75.5 | 77.0 | 77.6 | 78.0 | 78.8 | 79.4 | – |
| Three-month Treasury Bill Rate (Per Cent) | |||||||
| FAO – Fall 2018 | 0.5 | 0.7 | 1.4 | 2.4 | 2.9 | 3.0 | 3.0 |
| Ontario FES 2018 | 0.5 | 0.7 | 1.4 | 2.1 | 2.5 | 2.6 | – |
| 10-year Government Bond Rate (Per Cent) | |||||||
| FAO – Fall 2018 | 1.3 | 1.8 | 2.4 | 3.2 | 3.6 | 3.7 | 3.7 |
| Ontario FES 2018 | 1.3 | 1.8 | 2.3 | 2.8 | 3.3 | 3.4 | – |
| ($ Billions) | 2017a | 2018f | 2019f | 2020f | 2021f | 2022f |
|---|---|---|---|---|---|---|
| Revenue | ||||||
| Personal Income Tax | 32.9 | 35.0 | 36.3 | 38.1 | 39.9 | 41.8 |
| Sales Tax | 25.9 | 26.8 | 27.7 | 28.8 | 29.9 | 31.1 |
| Corporations Tax | 15.6 | 14.8 | 13.9 | 14.6 | 15.7 | 16.3 |
| All Other Taxes | 25.3 | 25.5 | 26.6 | 27.4 | 28.3 | 29.1 |
| Total Taxation Revenue | 99.7 | 102.1 | 104.6 | 109.0 | 113.8 | 118.3 |
| Transfers from Government of Canada | 24.9 | 26.0 | 25.6 | 26.7 | 27.5 | 28.4 |
| Income from Government Business Enterprise | 6.2 | 5.2 | 6.0 | 6.6 | 6.8 | 7.1 |
| Other Non-Tax Revenue | 19.9 | 16.1 | 16.0 | 16.5 | 17.0 | 17.5 |
| Total Revenue | 150.6 | 149.4 | 152.2 | 158.8 | 165.2 | 171.3 |
| Expense | ||||||
| Health Sector | 59.3 | 61.7 | 64.2 | 66.8 | 69.4 | 72.1 |
| Education Sector | 27.3 | 29.0 | 29.9 | 30.9 | 32.0 | 33.2 |
| Children’s and Social Services Sector | 16.4 | 17.0 | 17.6 | 18.2 | 18.7 | 19.3 |
| Other* | 39.4 | 41.5 | 42.3 | 43.5 | 45.0 | 46.5 |
| Total Program Expense | 142.4 | 149.2 | 153.9 | 159.4 | 165.2 | 171.1 |
| Interest on Debt | 11.9 | 12.5 | 13.4 | 14.4 | 15.6 | 16.6 |
| Total Expense | 154.3 | 161.7 | 167.3 | 173.8 | 180.7 | 187.7 |
| Budget Balance** | -3.7 | -12.3 | -15.1 | -15.0 | -15.5 | -16.4 |
| $ Billions | 2017a | 2018f | 2019f | 2020f | 2021f | 2022f |
|---|---|---|---|---|---|---|
| Budget Balance* | -3.7 | -12.3 | -15.1 | -15.0 | -15.5 | -16.4 |
| Accumulated Deficit | 209.0 | 221.3 | 236.4 | 251.4 | 266.9 | 283.3 |
| Net Debt | 323.8 | 348.3 | 371.5 | 397.5 | 425.4 | 451.9 |
| Net Debt to GDP (Per Cent) | 39.2 | 40.6 | 41.7 | 42.9 | 44.2 | 45.2 |
Footnotes
[1] In a departure from usual practice, the 2018 Fall Economic Statement did not include a medium-term fiscal forecast. In the absence of a fiscal projection by the government, including planned program spending, the FAO developed a status quo medium-term fiscal projection, which represents the expected fiscal outlook for Ontario given existing policies, without anticipating any new government policy decisions.
[2] See page 18, Ontario Economic Outlook and Fiscal Review, 2018.
[3] Over the past four years, real GDP growth has averaged 2.5 per cent, the fastest pace of growth since the mid-2000s.
[4] World Economic Outlook, October 2018, International Monetary Fund.
[5] Ibid.
[6] Ibid.
[7] The measures to contain debt and financial risks include stricter regulations on household and corporate borrowing. See World Economic Outlook, October 2018, International Monetary Fund.
[8] The sharp drop in Canadian oil prices over the past few months presents a significant downside risk for the oil-producing Western provinces that has the potential to impact the broader national economy. However, provided that the drop in oil prices proves to be temporary, oil production will likely recover in 2019, limiting the overall impact on the national economy.
[9] Monetary Policy Report, October 2018, Bank of Canada.
[10] Stephen S. Poloz and Carolyn A. Wilkins, Monetary Policy Report – Press Conference (Webcasts) – October 2018.
[11] The Bank of Canada defines the neutral rate to be the real interest rate consistent with sustaining economic output at its potential level, plus 2 per cent for the inflation target. The Bank estimates the neutral rate to be between 2.5 and 3.5 per cent.
[12] Since 2012, consumption and residential investment have accounted for over 80 per cent of real GDP growth.
[13] The Ontario economy is showing signs that it is operating at capacity. Wage growth has picked up after two years of strong job gains, at the same time the annual unemployment rate is expected to reach its lowest level in almost two decades.
[14] While business investment was relatively weak in the second quarter of 2018, the tentative trade agreement reached between the US, Mexico and Canada to replace NAFTA – the United States-Mexico-Canada Agreement (USMCA) – should provide a more stable, business friendly environment. The FAO expects the easing of trade tensions will spur investment that had been delayed during the trade negotiations.
[15] Overall these trade agreements are expected to benefit Ontario business, although some industries, particularly dairy producers, may be negatively impacted. The new trade agreements include the Comprehensive Economic and Trade Agreement (CETA), the Comprehensive and Progressive Agreement for Trans-Pacific Partnership (CPTPP) and the USMCA.
[16] See Business Investment and Competitiveness in Key Risks section.
[17] The FAO’s forecast reflects the cancellation of the increase in the minimum wage to $15.00 an hour.
[18] Corporate income growth is expected to be held back as corporations shift income from Canada to the United States in response to the introduction of corporate tax reforms in the US. In response to the US tax changes, the Canadian federal government recently announced new corporate tax measures to encourage business investment. See the Fiscal Outlook chapter for details on the impact of the new federal tax measures on Ontario corporate tax revenue.
[19] Household debt-to-disposable income ratio data is from Statistics Canada Table: 36-10-0590-01.
[20] For further discussion of household debt, see the FAO’s commentary Assessing Ontario Households’ Debt Burden and Financial Vulnerability, January 2018.
[21] Including the Fair Housing Plan introduced in 2017 by the Ontario government as well as stricter mortgage qualification rules introduced in 2018 by the Office of the Superintendent of Financial Institutions (OSFI).
[22] Bank of Canada, Business Outlook Survey – Autumn 2018.
[23] The last time Ontario’s total revenues declined on a year-over-year basis was during the 2008-2009 financial crisis.
[24] For more details on time-limited revenues, see page 18 of the FAO’s 2018 Spring Economic and Budget Outlook.
[25] See the FAO’s report Cap and Trade: A Financial Review of the Decision to Cancel the Cap and Trade Programfor details.
[26] Since the loss of cap and trade revenue is only partially offset by lower spending, the cancellation of the cap and trade program is expected to result in a net increase to the deficit. See the FAO’s cap and trade report for more details.
[27] The 2018 Budget tax changes included the elimination of the personal income tax (PIT) Surtax, associated adjustments to PIT brackets and rates, and changes to the application of the small business limit and the Employer Health Tax exemption. See page 154-155 of the 2018 Ontario Economic Outlook and Fiscal Review.
[28] The tax changes will lower the taxes of both corporations and unincorporated businesses. For a description of the federal governments tax changes, see Canada’s 2018 Fall Economic Statement, page 54.
[29] This estimate is adapted from figures presented in Canada’s 2018 Fall Economic Statement, page 86. However, given the volatility of corporate tax revenues, there is considerable uncertainty around the estimated impact.
[30] In the 2018 Fall Economic Statement, the government indicated that new programs introduced in the 2018 Budget are generally considered to be eliminated, unless stated otherwise.
[31] Offsetting these program cuts are higher base funding for existing health care programs and additional funding for long-term care.
[32] However, the savings from cancelling cap and trade related programs are more than offset by the loss in revenues from the cap and trade program (see Revenue Outlook section). See the FAO’s report Cap and Trade: A Financial Review of the Decision to Cancel the Cap and Trade Program for further details.
[33] The FAO assumes that previously announced policy changes will be maintained, including the expansion of 100,000 spaces (announced in 2016) and compensation increases for child care workers (announced in 2017).
[34] The Fiscal Transparency and Accountability Act requires the government to provide a recovery plan in the annual Provincial Budget that specifies how the budget will be balanced, and the time period over which it will do so.