

1 | Executive Summary
Ontario’s economy grew at a solid pace over the past five years, with real GDP rising by 2.4 per cent per year on average. However, ongoing global uncertainty, a moderating US economy and rising interest rates are expected to slow Ontario’s economic growth over the next five years, with real GDP projected to increase at an average annual pace of 1.7 per cent during 2019 to 2023.
Softer economic growth coupled with recent policy changes will slow revenue growth to just 0.8 per cent in 2019-20, the slowest gain since the 2008-09 recession. Despite significant spending restraint by the government, the FAO projects that slower revenue growth will increase Ontario’s budget deficit to $8.5 billion in 2019-20, up from $7.4 billion last year, marking the third consecutive year of higher deficits.
Over the next four years (2020-21 through 2023-24), the FAO projects average annual revenue growth of 3.7 per cent. The FAO’s baseline projection also adopts the government’s spending plan,[1] which limits program spending increases to 1.4 per cent per year on average.[2] On this basis, the FAO projects a rapid improvement in Ontario’s fiscal position, with an almost balanced budget in 2021-22 and a large $8.7 billion surplus by 2023-24. This dramatic improvement in the budget balance is driven primarily by the government’s plan to significantly limit program spending.
FAO projects a balanced budget in two years, excluding unannounced policies
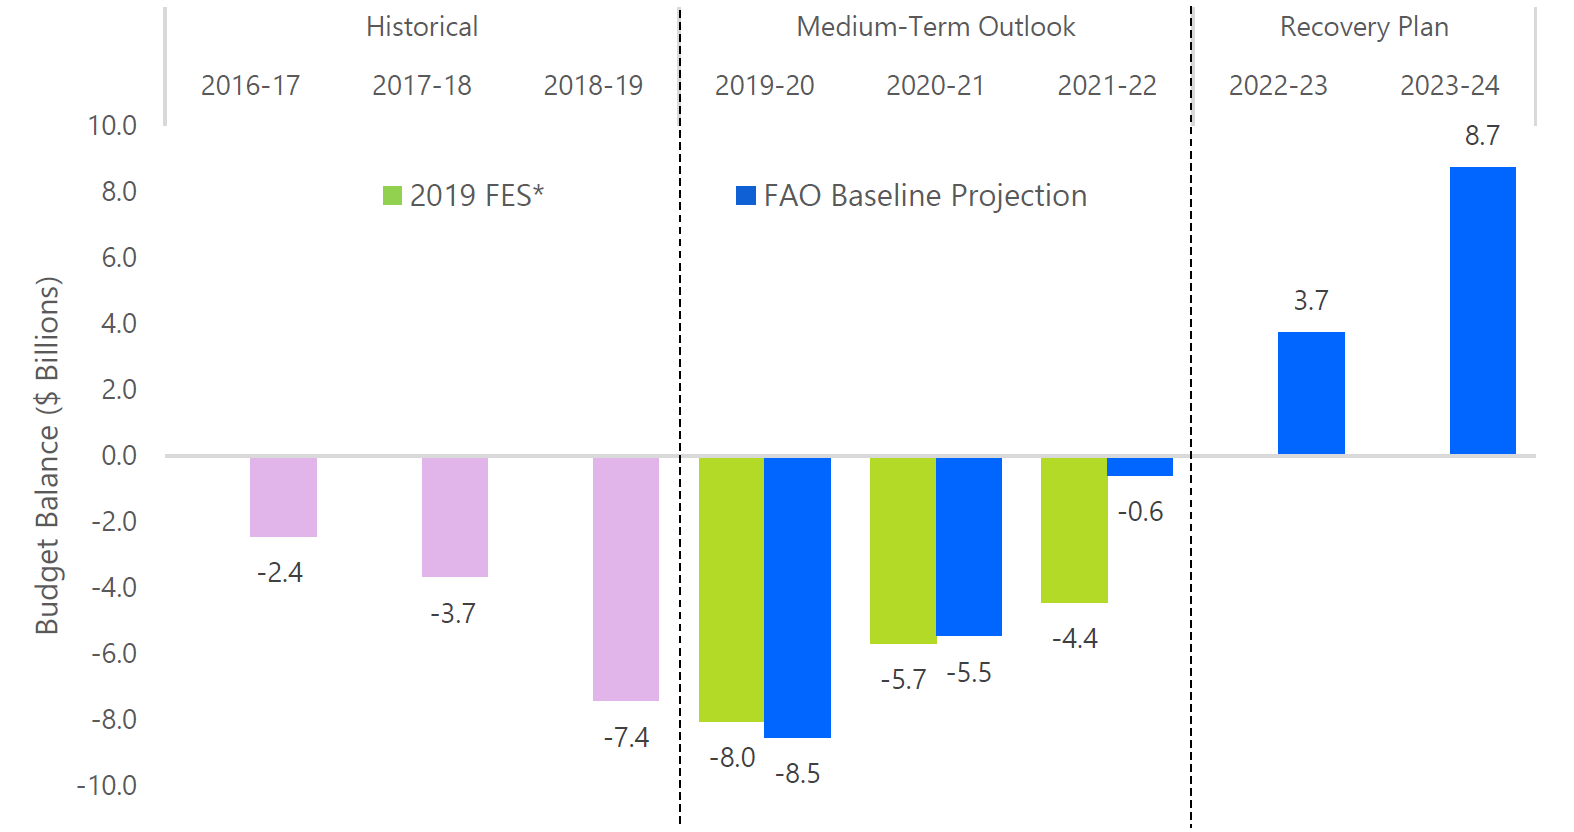
* Budget balance is presented before the reserve.
Source: Ontario Public Accounts, 2019 Ontario Economic Outlook and Fiscal Review and FAO.
Accessible version
This chart compares the historical, medium-term outlook, and projection of Ontario’s budget balance based on the 2019 Fall Economic Statement and the FAO baseline projection from the fiscal years 2016-17 to 2023-24, in billions of dollars. The chart shows that the historical budget balance was -$2.4 billion in 2016-17, -$3.7 billion in 2017-18 and -$7.4 billion in 2018-19. The medium-term outlook portion of the chart shows that the 2019 Fall Economic Statement expects the budget balance to be -$8.0 billion in 2019-20, -$5.7 billion in 2020-21 and -$4.4 billion in 2021-22. Under the FAO baseline projection, the budget balance Is expected to be -$8.5 billion in 2019-20, -$5.5 billion in 2020-21, -$0.6 billion in 2021-22, $3.7 billion in 2022-23 and $8.7 billion in 2023-24. The budget balance is presented without the reserve.
In sharp contrast to the FAO’s projection, the government’s 2019 Fall Economic Statement forecasts a more modest improvement, with the budget deficit declining from $8.0 billion[3] this year to $4.4 billion by 2021-22. In the Fall Economic Statement, the government also reaffirmed its commitment to balance the budget by 2023-24, effectively two years later than the FAO’s baseline projection.
Government forecast includes unannounced tax cuts and spending measures
Importantly, the government’s fiscal plan includes tax cuts and spending programs that have not been publicly disclosed. The FAO’s baseline projection excludes these unannounced measures because they are not reflected in current legislation and have not been formally proposed by the government. However, implementing the unannounced measures would delay the achievement of a balanced budget and result in an additional $13.5 billion in net debt by 2023-24.
The government’s fiscal plan hinges on successfully limiting the growth in program spending in order to deliver new tax cuts while still balancing the budget by 2023-24. If the government achieves its spending plan, program spending would be reduced by $1,070 per person, or by 10 per cent, over the next five years.
The government plans to reduce spending per person by $1,070 over five years
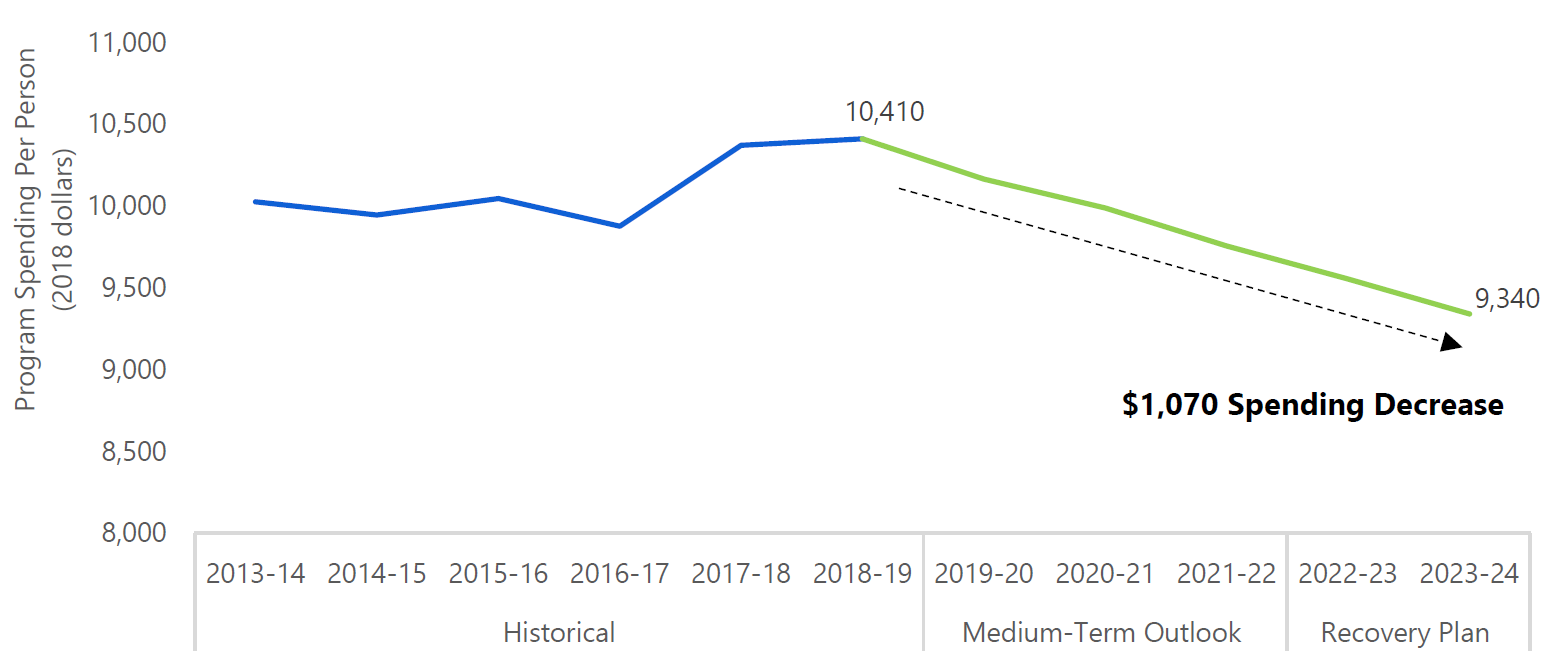
Note: Estimates for program spending in 2022-23 and 2023-24 are based on program spending growth rates from the 2019 Ontario Budget.
Source: Ontario Public Accounts, 2019 Ontario Budget, 2019 Ontario Economic Outlook and Fiscal Review and FAO.
Accessible version
This chart shows the historical and projected program spending per person in 2018 dollars according to the 2019 Fall Economic Statement from the fiscal years 2013-14 to 2023-24. The chart shows that the program spending per person was $10,025 in 2013-14, $9,945 in 2014-15, $10,046 in 2015-16, $9,876 in 2016-17, $10,370 in 2017-18, $10,410 in 2018-19, then is projected to gradually fall to $9,340 by 2023-24. The chart highlights that program spending is expected to decrease by $1070 per Ontarian by 2023-24.
The extent to which the fiscal plan will deliver a sustainable improvement to Ontario’s finances depends on the success of the government’s policies to change public services, particularly in the areas of health and education. However, based on the FAO’s analysis, the demand for public services will exceed the government’s planned program spending by approximately $5 billion by 2021-22, after accounting for the government’s measures to cut costs. There is a significant risk that the fiscal plan will not provide sufficient resources to meet future ongoing demand for key public services.
2 | Economic Outlook
Overview
Ontario’s economy grew at a solid pace over the 2014 to 2018 period, with real GDP rising by 2.4 per cent per year on average. Strong gains in household spending and residential construction led overall growth, supported by low interest rates and a surge in population growth. However, Ontario’s growth softened in late 2018 and early 2019, reflecting the impact of global trade uncertainty and modestly higher interest rates. On an annual basis, the FAO projects real GDP growth will slow to 1.7 per cent in 2019, with declines in residential construction and business investment offset by a gain in net exports and continued growth in household spending.
Ontario’s labour market has performed well over the past several years, with ongoing employment growth and a steady decline in the unemployment rate. Employment gains have been especially strong in 2019. As a result, the annual unemployment rate is projected to remain at 5.6 per cent this year, the lowest rate since the late 1980s.
Over the outlook, the FAO projects the pace of economic growth in Ontario will remain moderate, with real GDP rising at an average annual rate of 1.7 per cent over 2019 to 2023. Elevated levels of household debt will limit growth in household spending and residential investment, while a slowing US economy and ongoing geopolitical uncertainty are expected to dampen Ontario’s exports and business investment.
Nominal GDP – the broadest measure of the tax base – increased by 3.7 per cent in 2018, down noticeably from average gains of 4.4 per cent over the previous four years. Slower growth will continue in 2019 and over the outlook, with nominal GDP projected to grow at an average annual rate of 3.6 per cent.
Ontario economic growth has slowed
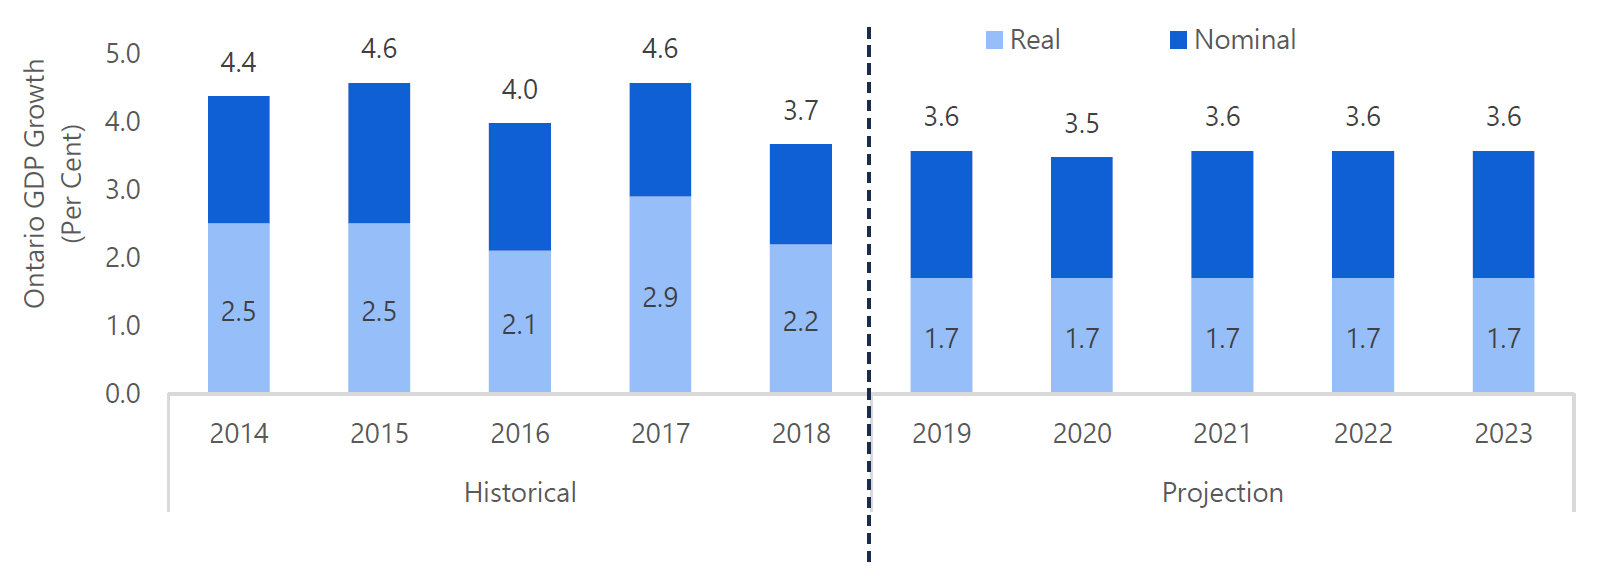
Source: Statistics Canada and FAO.
Accessible version
This chart shows the historical and projected real and nominal GDP growth in Ontario from 2014 to 2023 in per cent. The chart shows that real GDP growth was 2.5 per cent in 2014, 2.5 per cent in 2015, 2.1 per cent in 2016, 2.9 per cent in 2017, 2.2 per cent in 2018, and is expected to be 1.7 per cent each year from 2019 to 2023. The chart shows that nominal GDP growth was 4.4 per cent in 2014, 4.6 per cent in 2015, 4.0 per cent in 2016, 4.6 per cent in 2017, 3.7 per cent in 2018, and is expected to be 3.6 per cent in 2019, 3.5 per cent in 2020 and 3.6 per cent in 2021, 2022 and 2023.
The domestic and foreign risk factors for Ontario’s economic outlook have changed little since the spring. These factors include volatile global trading relationships, which will hold back business investment and exports, and elevated household indebtedness, which will continue to weigh on consumer spending. Uncertainty related to these factors could lead to even slower future growth for the Ontario economy, negatively impacting the Province’s fiscal outlook.[4]
IMF revises global economic outlook lower
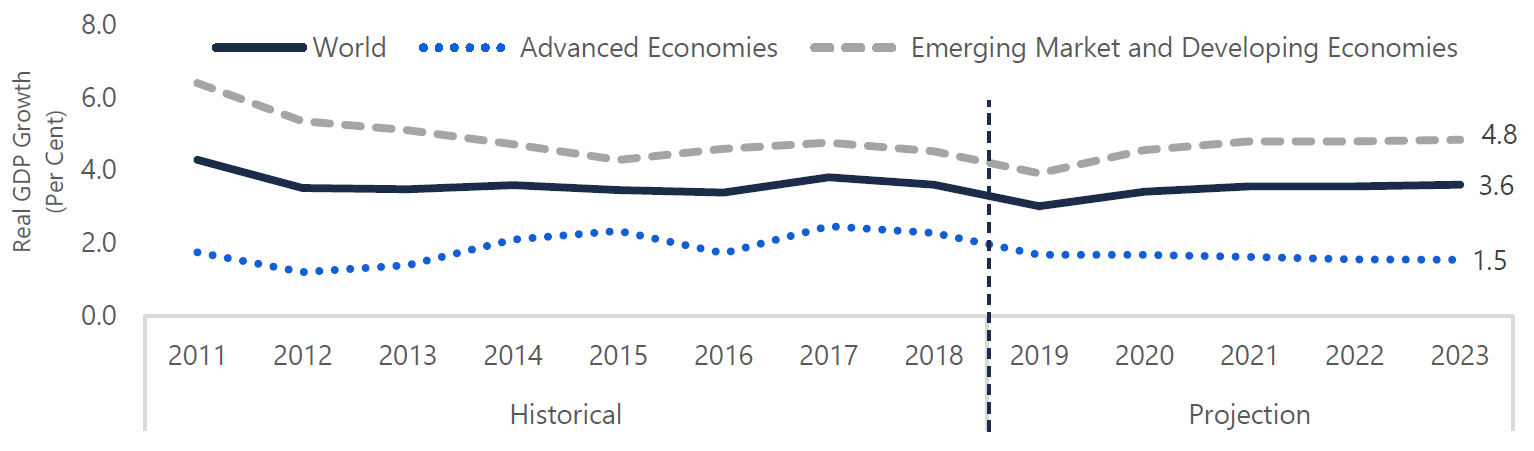
The global economy grew by 3.6 per cent in 2018, slowing in the second half of the year due to trade tensions, geopolitical uncertainty and country-specific developments such as Brexit negotiations in the United Kingdom. In this volatile global environment, recessions have occurred in Italy, Argentina, Mexico and Turkey. Global trade and industrial production have slumped further in 2019. As a result, the International Monetary Fund (IMF) downgraded its global economic growth projection to 3.0 per cent this year, the slowest pace since the 2008 global financial crisis and a considerable downward revision from the IMF’s spring forecast.[5] The IMF anticipates that challenges to global trade arrangements will continue to impact growth in 2020. Over the outlook, the IMF projects global economic growth will gradually recover to 3.6 per cent.
Weaker global growth in 2019 followed by steady growth over outlook
Source: International Monetary Fund, World Economic Outlook, October 2019.
Accessible version
This chart shows the historical and projected real GDP growth for the world, advanced economies, and emerging market and developing economies from 2011 to 2023. Global real GDP growth was 3.6 per cent in 2018 and expected to grow 3.0 per cent in 2019. Advanced economies grew at 2.3 per cent in 2018 and are expected to grow at 1.7 per cent in 2019. Emerging market and developing economies grew at 4.5 per cent in 2018 and are expected to grow at 3.9 per cent in 2019.
For advanced economies, growth is expected to slow sharply from 2.3 per cent in 2018 to 1.7 per cent in 2019, with weaker growth in all G7 countries.[6] In particular, there has been little progress in talks between the US and China on trade and technology, Germany continues to suffer from a sluggish manufacturing sector, and Brexit remains uncertain. In addition, slower labour force growth from an aging population in many advanced economies is expected to continue to weigh on GDP growth over the longer term.
For emerging market and developing economies, growth is expected to moderate from 4.5 per cent in 2018 to 3.9 per cent in 2019 due to weaker global demand and region-specific factors such as a slowdown in domestic demand in China and India, as well as political tension in the Middle East.[7] Prospects for Latin America have been revised down considerably, while a solid recovery is anticipated for emerging Europe and sub-Saharan Africa.
United States
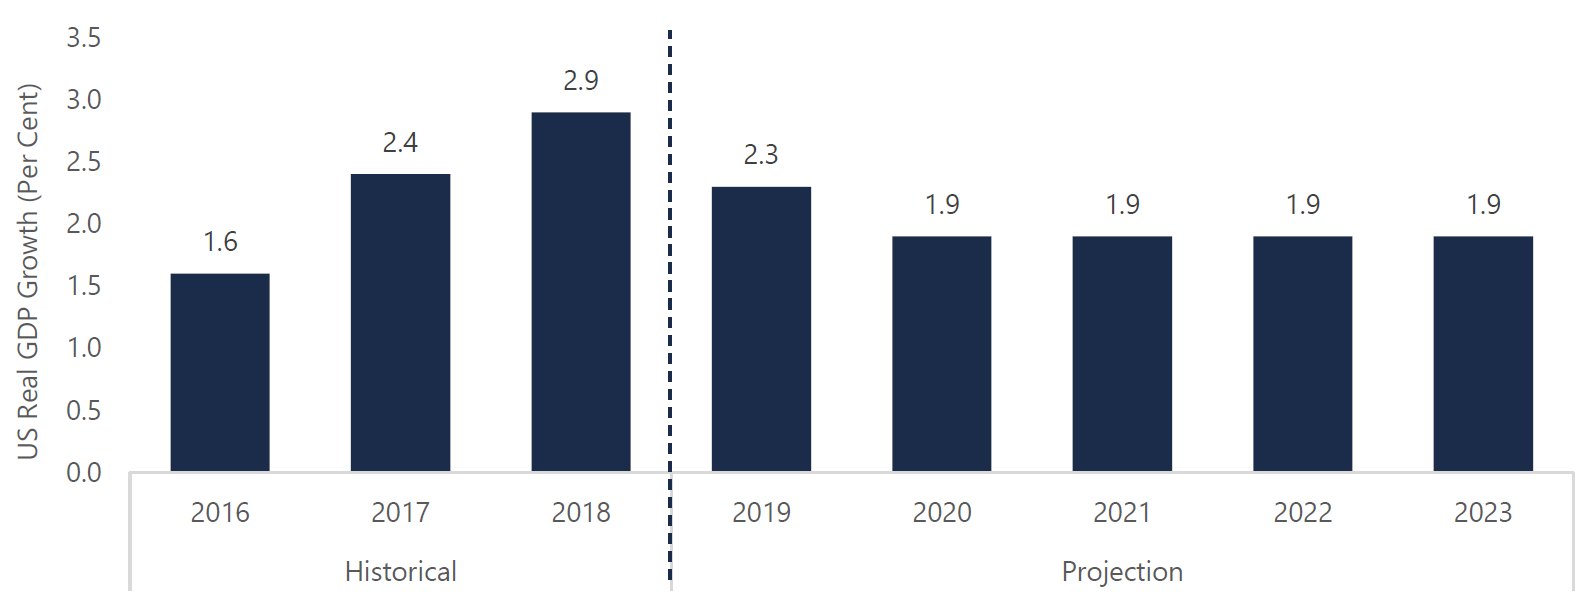
The US economy posted strong growth in 2018, with real GDP rising 2.9 per cent. However, the pace of growth moderated in the second and third quarters of 2019 reflecting slower business investment and exports. The US labour market remained very tight with the unemployment rate reaching its lowest point in 50 years,[8] while solid employment growth and improved wage gains continue to support strong increases in personal consumption.
The US Federal Reserve lowered the federal funds rate for the first time since the 2008 recession, reducing the rate three times since July to a 1.5-1.75 per cent range. The US central bank cited trade policy uncertainty, slower global demand and low inflation as the main reasons for its decision to lower the policy interest rate, and also signalled that any future rate cuts would be dependent on the economy’s performance.[9]
Going forward, US growth is projected to moderate, with real GDP rising 2.3 per cent in 2019 and 1.9 per cent annually over the 2020-23 period. The trade dispute between the US and China is expected to continue holding back economic growth next year, while both monetary and fiscal policy should provide some offsetting stimulus.
US economy expected to moderate as trade uncertainty continues
Source: US Bureau of Economic Analysis and FAO.
Accessible version
This chart shows the historical and projected US real GDP growth rates from 2016 to 2023. The US economy grew by 1.6 per cent in 2016, 2.4 per cent in 2017 and 2.9 per cent in 2018. US real GDP growth is expected to grow at 2.3 per cent in 2019, and 1.9 per cent each year from 2020 to 2023.
China
China’s economic growth slowed in 2018 as household spending and domestic investment weakened.[10] In 2019, real GDP growth could slow further as external demand for Chinese goods continues to be impacted by US tariffs and global economic trends.
Earlier in the year, China responded to the economic slowdown with fiscal stimulus and a devaluation of its currency. Policymakers are expected to introduce further fiscal support if slowing capital investment and the trade dispute with the US continue to hold back economic activity.
Canadian growth to slow in 2019
Canadian real GDP growth to slow in 2019
Source: Statistics Canada and FAO.
Accessible version
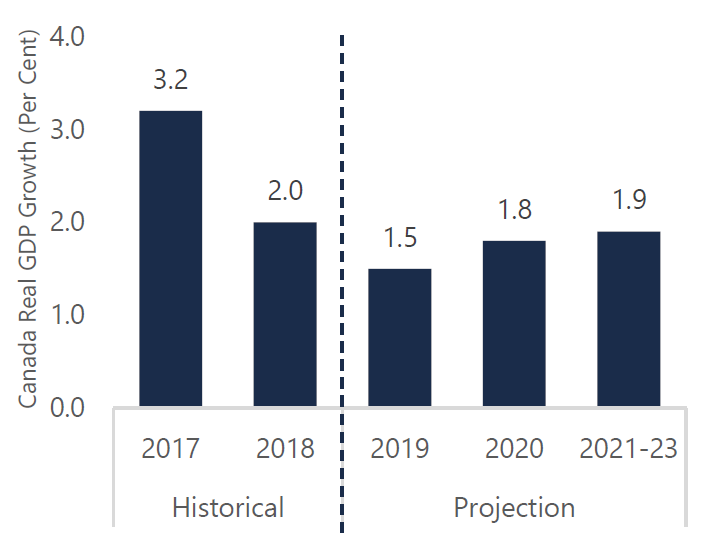
This chart shows the historical and projected Canadian real GDP growth rates from 2017 to 2023. The Canadian economy grew by 3.2 per cent in 2017 and 2.0 per cent in 2018. Canadian real GDP is expected to grow at 1.5 per cent in 2019, 1.8 per cent in 2020 and 1.9 per cent from 2021 to 2023.
In 2018, Canadian real GDP increased by 2.0 per cent, down significantly from a 3.2 per cent gain in 2017, due to weaker household consumption and residential construction. While Canada’s economy rebounded from a slow start to 2019, growth is expected to soften in the second half of the year as a temporary boost in exports dissipates. Overall growth in 2019 is expected to moderate to 1.5 per cent largely due to modest growth in business investment and exports.
Over the 2021-23 outlook, real GDP is expected to increase by an average of 1.9 per cent annually, supported by a steady labour market, stable energy sector output and improved trade conditions.
Interest rates to rise gradually
Interest rate increases to pause until 2021
Source: Statistics Canada and FAO.
Accessible version
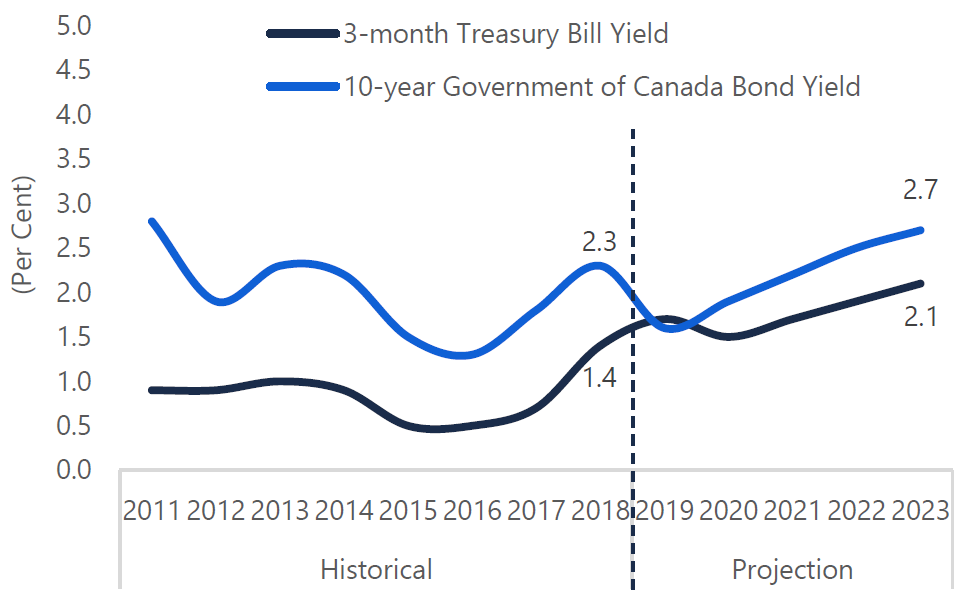
This chart shows the historical and projected 3-month Treasury bill rate and the 10-year Government of Canada bond yield from 2011 to 2023. The 3-month Treasury bill rate was 1.4 per cent in 2018 and is expected to rise to 2.1 per cent by 2023. The 10-year Government of Canada bond yield was 2.3 per cent in 2018 and is expected rise to 2.7 per cent by 2023.
In contrast to other central banks, including the US Federal Reserve, the Bank of Canada has not adjusted its policy interest rate[11] since October 2018, when it raised the rate by 25 basis points to 1.75 per cent. In its October 2019 Monetary Policy Report, the Bank cited a healthy labour market, steady growth in consumer spending and a recovery in housing activity as positive signs for the Canadian economy, which it projected to grow near potential in 2020 and 2021.[12] With inflation projected to hover around the Bank’s target of 2 per cent,[13] future interest rate decisions will depend on the resilience of the Canadian economy in an environment of slower global growth and ongoing trade conflicts.
Based on the latest policy position of the Bank of Canada and recent trends in Canadian treasury bill and bond yields, the FAO outlook incorporates a modest but gradual rise in interest rates over the outlook.
Ontario’s economic growth has slowed
Ontario’s economy grew at a solid pace over the 2014 to 2018 period, with real GDP growth averaging 2.4 per cent annually, supported by strong gains in household spending and residential construction. However, the province’s growth began to falter at the turn of the year, reflecting the impact of global trade uncertainty on exports and investment, and modestly higher interest rates, which tempered household spending and the housing market. While the trade sector provided a boost to growth in mid-2019, Ontario’s domestic demand – household spending, government expenditures and business investment – recorded almost no growth from the third quarter of 2018 through the second quarter of 2019.
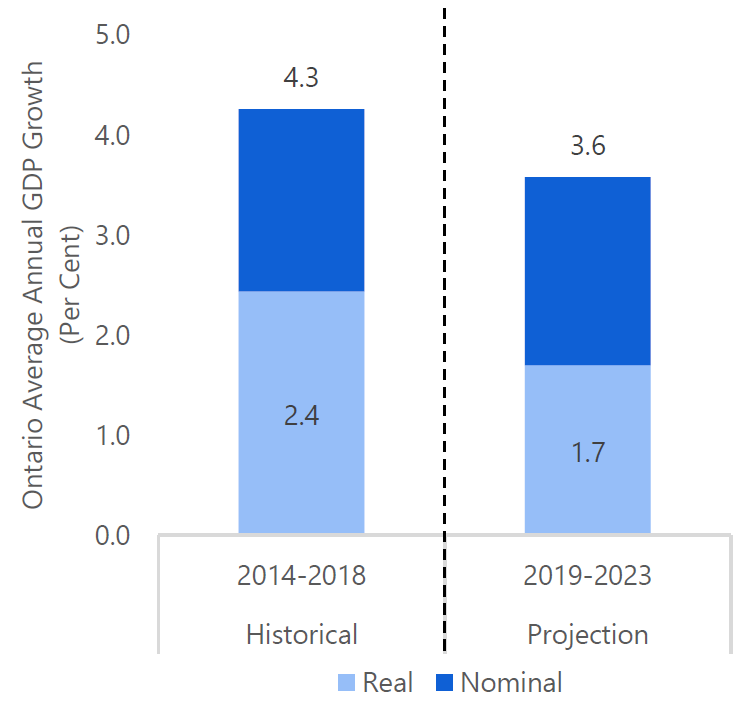
Going forward, elevated levels of household debt are expected to hold back consumer spending, while an uncertain global environment will weigh on exports and investment. The Ontario government’s plan to restrain program spending will also contribute to an outlook for relatively modest economic growth. Overall, the FAO is projecting real GDP growth will average 1.7 per cent annually over the outlook, compared to 2.4 per cent over the previous five years.
Slower GDP growth over outlook
Source: Statistics Canada and FAO.
Accessible version
This chart shows Ontario’s average annual nominal and real GDP growth from 2014 to 2018 and from 2019 to 2023. Nominal and real GDP growth averaged 4.3 per cent and 2.4 per cent respectively from 2014 to 2018. The FAO’s outlook on average nominal and real GDP growth is 3.6 per cent and 1.7 per cent, respectively, from 2019 to 2023.
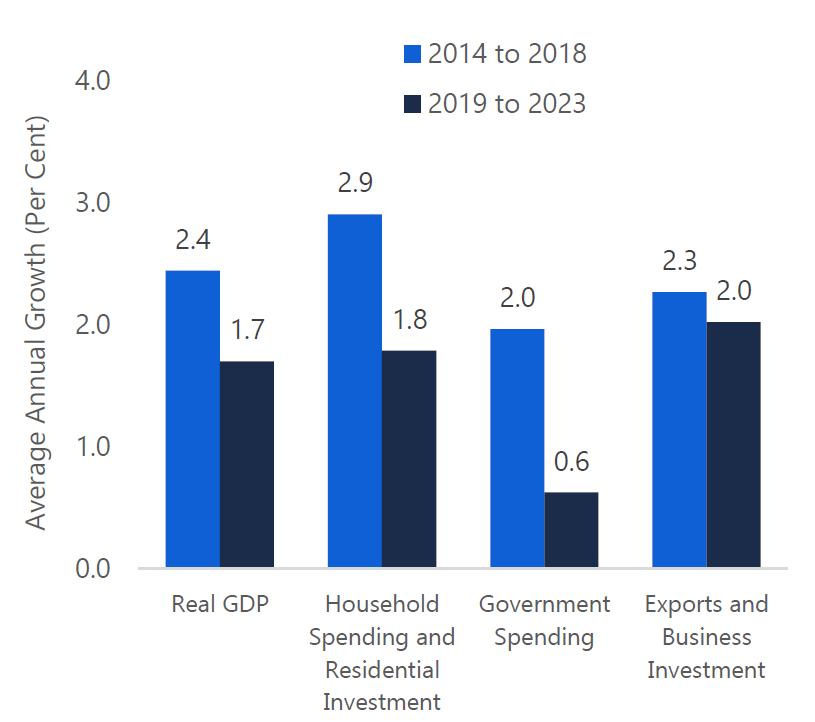
Growth across sectors expected to be slower
Source: Statistics Canada and FAO.
Accessible version
This chart shows average annual growth rates from 2014 to 2018 and from 2019 to 2023 for four categories: (1) Ontario real GDP, (2) household spending and residential investment, (3) government spending and (4) exports and business investment. Real GDP grew at an annual rate of 2.4 per cent from 2014 to 2018 and is expected to grow at 1.7 per cent from 2019 to 2023. Household spending and residential investment grew at an annual rate of 2.9 per cent from 2014 to 2018 and are expected to grow at 1.8 per cent from 2019 to 2023. Government spending grew at an annual rate of 2.0 per cent from 2014 to 2018 and is expected to grow at 0.6 per cent from 2019 to 2023. Exports and business investment grew at an annual rate of 2.3 per cent from 2014 to 2018 and is expected to grow at an annual rate of 2.0 per cent from 2019 to 2023.
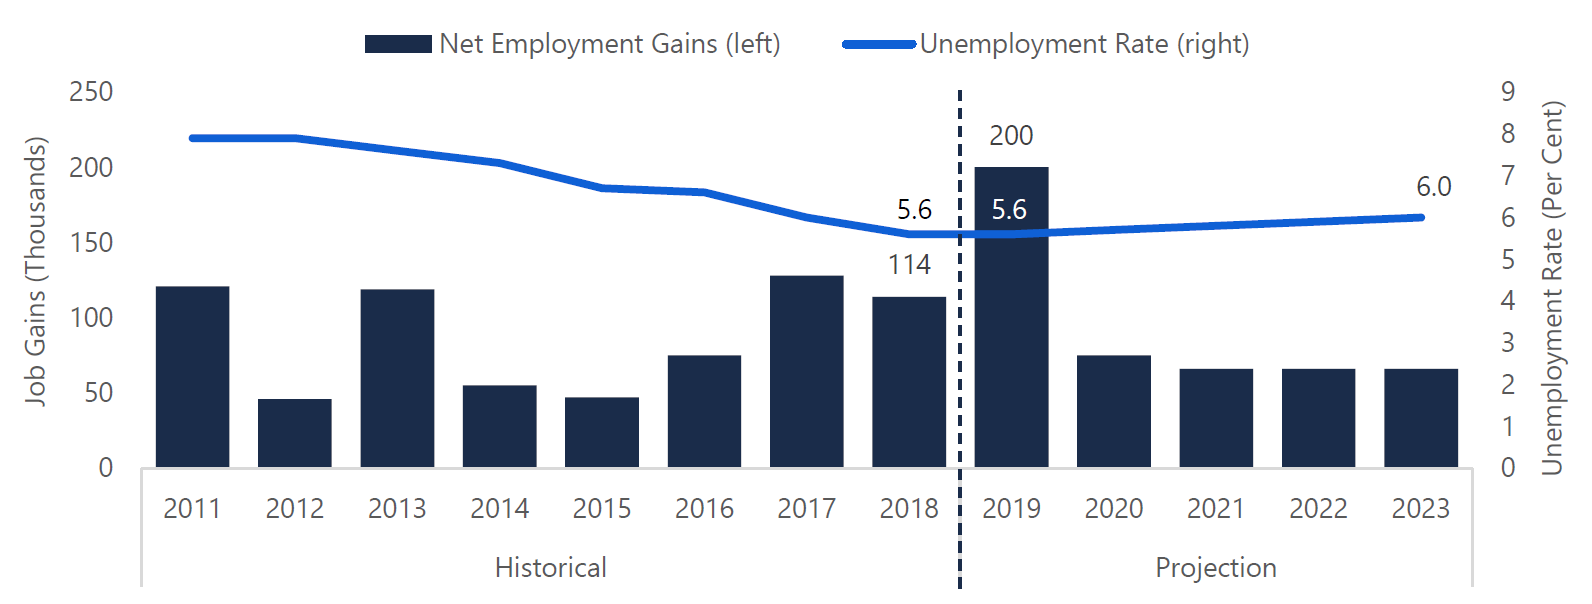
Employment gains to continue over outlook
Ontario’s labour market performed well in 2018 and 2019, with strong employment growth lowering the annual unemployment rate to 5.6 per cent, the lowest rate since the late 1980s. The FAO projects a net gain of 200,000 jobs in 2019, which would be the largest increase in the level of employment on record.[14] The strong pace of employment growth encouraged a record number of people to enter the job market in 2019, which resulted in an increase in Ontario’s overall labour force participation rate for only the second time in the past 10 years.
Over the 2020-23 outlook period, employment growth is expected to average 0.9 per cent annually while the unemployment rate will remain relatively low.
Job gains to moderate, unemployment rate to rise gradually
Source: Statistics Canada and FAO.
Accessible version
This chart shows the historical and projected net employment gains and unemployment rate from 2011 to 2023. The chart shows that the unemployment rate has been declining since 2011, reaching 5.6 per cent in 2018. The unemployment rate is projected at 5.6 per cent in 2019 and increases slightly to 6.0 per cent in 2023. Net employment gains were 114,000 in 2018. Net employment gains are expected to increase to 200,000 in 2019 and fall to 74,000 in 2020 then 66,000 each year from 2021 to 2023.
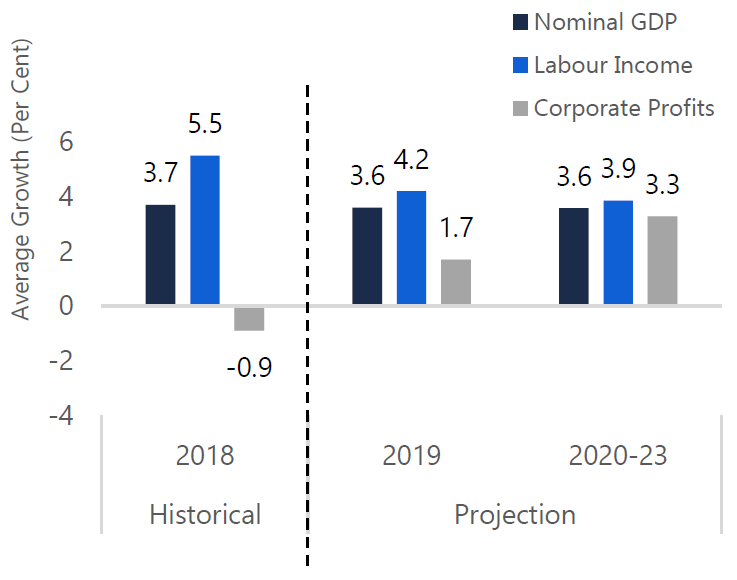
Economy-wide incomes to slow
Labour income growth to moderate
Source: Statistics Canada and FAO.
Accessible version
This chart shows the historical and projected growth rates for Ontario’s nominal GDP, labour income and corporate profits in 2018, 2019 and from 2020 to 2023. Nominal GDP grew at 3.7 per cent in 2018 and is projected to grow at 3.6 per cent in 2019 and 3.6 per cent from 2020 to 2023. Labour income grew at 5.5 per cent in 2018 and is projected to grow at 4.2 per cent in 2019 and 3.9 per cent from 2020 to 2023. Corporate profits declined by 0.9 per cent in 2018 and are projected to grow at 1.7 per cent in 2019 and 3.3 per cent from 2020 to 2023.
Labour income in Ontario increased by a robust 5.5 per cent in 2018, marking the second consecutive year of strong growth amid a tight labour market. In contrast, corporate profits[15] declined in 2018 reflecting a difficult trade environment and a challenging competitive landscape for businesses.
Over the outlook, corporate profits are expected to recover steadily, while labour income gains are projected to continue, but at a more moderate pace. Nominal GDP growth is projected to average 3.6 per cent per year over the outlook.
Key Risks
Ontario’s economy faces several domestic and global risks that could negatively impact growth and the government’s fiscal plan.
High Household Debt
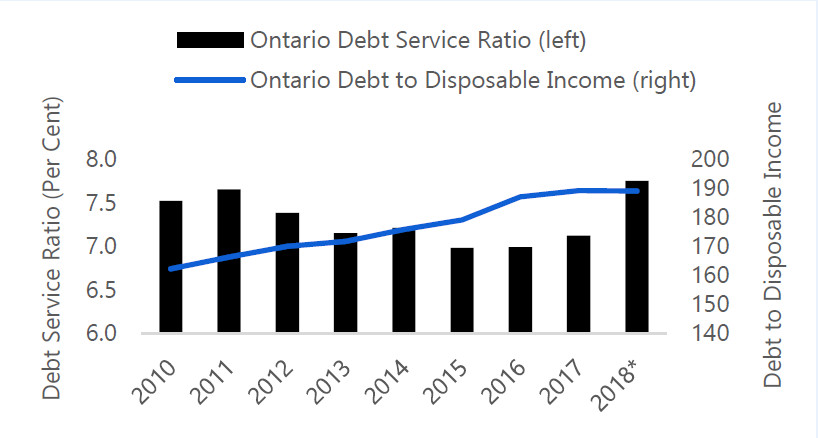
Source: Statistics Canada. * Ministry of Finance Estimate for debt to disposable income.
Accessible version
This chart shows the Ontario debt service ratio and the Ontario debt to disposable income ratio from 2010 to 2018. Ontario’s debt service ratio was 7.5 per cent in 2010 and fell to 7.0 per cent in 2015 before increasing to 7.8 per cent by 2018. Ontario’s debt to disposable income ratio was 162.2 per cent in 2010 and increased to 189.0 per cent by 2018. The chart highlights that the debt to disposable income ratio in 2018 is a Ministry of Finance Estimate.
- Total household debt in Ontario was 189 per cent of disposable income in 2018. The debt service ratio increased in 2018, as households spent a higher portion of their disposable income on interest payments.
- Moderate employment and wage growth and rising interest on debt payments are expected to constrain household spending over the outlook.
- Households are vulnerable to a steeper-than-expected rise in interest rates, which would lead to higher debt service payments and force reductions in discretionary spending.
Trade Uncertainty
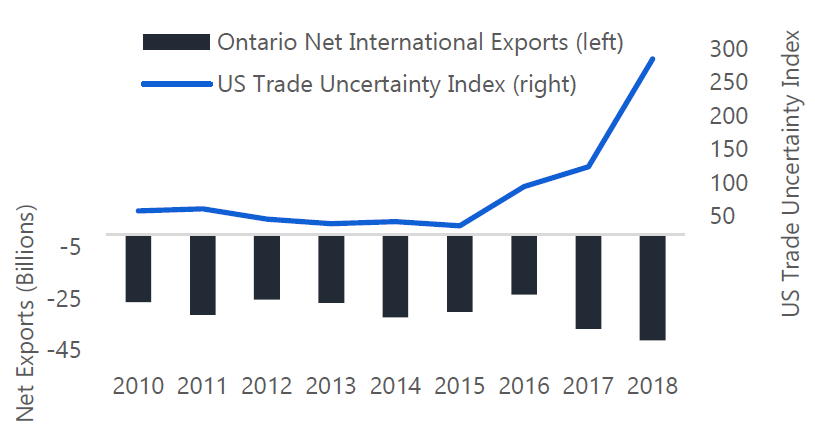
Source: Statistics Canada and “Measuring Economic Policy Uncertainty” by Scott R. Baker, Nicholas Bloom and Steven J. Davis at www.PolicyUncertainty.com.
Accessible version
This chart shows Ontario’s historical nominal net international exports in billions of dollars and the US Trade Uncertainty Index from 2010 to 2018. Net international exports in Ontario were -$26.0 billion in 2010 and declined to -$41.2 billion by 2018. The US Trade Uncertainty Index was 58.3 in 2010 and increase sharply to 284.8 by 2018.
- Ontario’s economy is highly dependent on trade, with international exports and imports representing about 34 and 39 per cent of nominal GDP, respectively.
- Uncertainty related to US trade policy has risen sharply in the past few years, reflecting the replacement of NAFTA with the new and yet-to-be ratified CUSMA,[16] as well as the introduction of new US tariffs, most significantly on imports from China.
- Ontario’s real international exports have lagged overall economic growth in recent years, declining by 0.4 per cent on average annually in 2017 and 2018, in contrast to average annual gains of 5.1 per cent during 2010 to 2016.
Subdued Business Investment
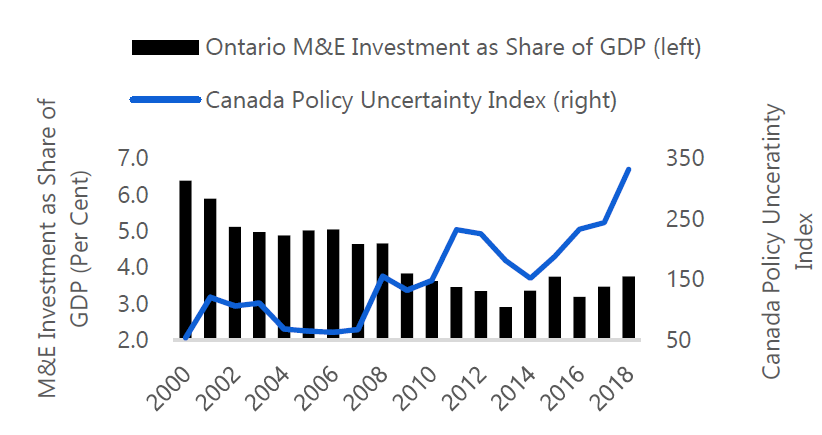
Source: Statistics Canada and “Measuring Economic Policy Uncertainty” by Scott R. Baker, Nicholas Bloom and Steven J. Davis at www.PolicyUncertainty.com.
Accessible version
This chart shows the historical shares of machinery and equipment investment in nominal GDP in Ontario and the Canada Policy Uncertainty Index from 2000 to 2018. The Ontario share was 6.4 per cent in 2000 and declined to 3.8 per cent by 2018. The Canada Policy Uncertainty Index was 53 in 2000 and increased to 332 by 2018.
- Machinery and equipment (M&E) investment is essential to increase production capacity, boost competitiveness and support stronger export growth.
- However, Ontario’s M&E investment accounted for just 3.4 per cent of nominal GDP from 2010 to 2018, down from an average of 5.0 per cent between 2000 and 2009.
- Rising uncertainty in the trade and business environment, coupled with a decline in relative competitiveness in the wake of US tax reform,[17] could continue to hold back business investment in Ontario.
3 | Fiscal Outlook
Overview
The FAO projects Ontario’s budget deficit will increase to $8.5 billion in 2019-20, up from $7.4 billion last year, marking the third consecutive year of higher deficits. Despite significant spending restraint this year, government policy measures slowed revenue growth even further, widening the 2019-20 deficit.
Under the FAO’s baseline projection,[18] Ontario’s budget would improve rapidly over the outlook, with an almost balanced budget in 2021-22 and a large $8.7 billion surplus by 2023-24. This dramatic improvement in the budget balance over the next four years is driven primarily by the government’s plan to significantly restrain program spending.
In contrast, the government’s 2019 Ontario Economic Outlook and Fiscal Review (also referred to as the Fall Economic Statement or FES), forecasts a modest improvement in the budget with the deficit declining to $4.4 billion by 2021-22. Significantly, the government’s fiscal plan[19] incorporates provisions for unannounced tax cuts and new spending programs that delay the achievement of a balanced budget and result in higher provincial debt.
FAO projects a balanced budget in two years, excluding unannounced policies

Source: Ontario Public Accounts, 2019 Ontario Economic Outlook and Fiscal Review and FAO.
* Budget balance is presented before the reserve.
Accessible version
This chart compares the historical, medium-term outlook, and projection of Ontario’s budget balance based on the 2019 Fall Economic Statement and the FAO baseline projection from the fiscal years 2016-17 to 2023-24, in billions of dollars. The chart shows that the historical budget balance was -$2.4 billion in 2016-17, -$3.7 billion in 2017-18 and -$7.4 billion in 2018-19. The medium-term outlook portion of the chart shows that the 2019 Fall Economic Statement expects the budget balance to be -$8.0 billion in 2019-20, -$5.7 billion in 2020-21 and -$4.4 billion in 2021-22. Under the FAO baseline projection, the budget balance Is expected to be -$8.5 billion in 2019-20, -$5.5 billion in 2020-21, -$0.6 billion in 2021-22, $3.7 billion in 2022-23 and $8.7 billion in 2023-24. The budget balance is presented without the reserve.
The government’s fiscal plan hinges on significantly limiting the growth in program spending in order to deliver new tax cuts while still balancing the budget. However, based on the FAO’s analysis, the demand for public services will exceed the government’s planned program spending by approximately $5 billion by 2021-22, after accounting for the government’s measures to cut costs. There is a significant risk that the fiscal plan will not provide sufficient resources to meet future ongoing demand for key public services.
Revenue Outlook
The FAO projects Ontario’s total revenues will increase by a weak 0.8 per cent in 2019-20, following a modest gain of 2.1 per cent in 2018-19. The relatively weak revenue growth over the past two years – averaging just 1.4 per cent – reflects the impact of recent policy changes combined with slower economic growth.
Over the next four years, the FAO projects total revenue growth will improve, averaging 3.7 per cent per year, but will remain below the average annual gains of 4.6 per cent over the 2013-14 to 2017-18 period. Overall, the FAO’s revenue projection has improved since the spring outlook, reflecting the 2018-19 Public Accounts, which reported $2.9 billion in higher revenues than previously expected.[20]
Moderate revenue growth expected over outlook
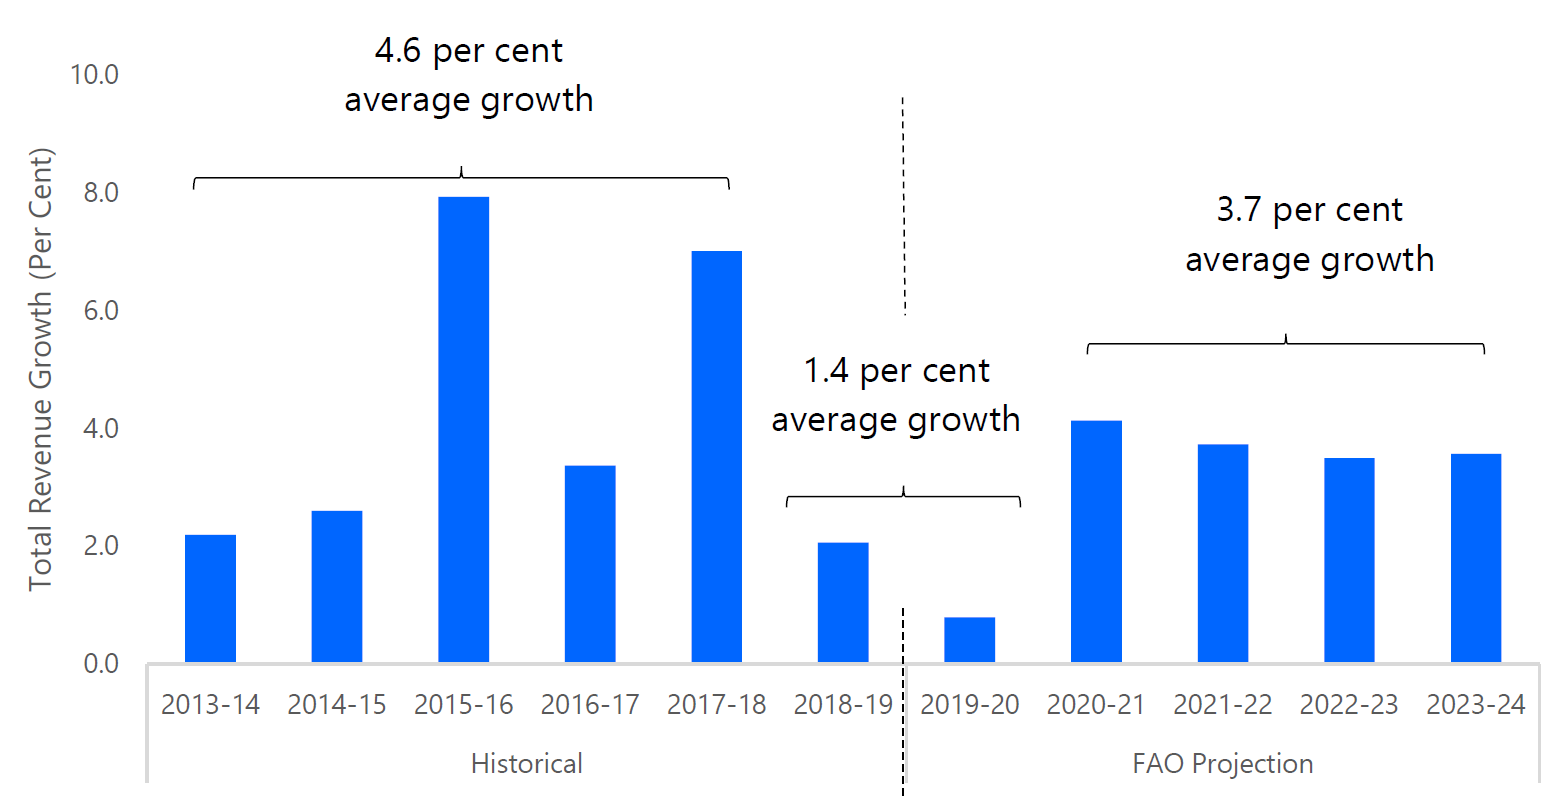
Source: Ontario Public Accounts, 2019 Ontario Economic Outlook and Fiscal Review and FAO.
Accessible version
This chart shows total government revenue growth in Ontario over the 2013-14 to 2023-24 period. The chart highlights that total revenues grew by an average of 4.6 percent annually over the 2013-14 to 2017-18 period. Total revenues are projected to grow by an average of 1.4 per cent annually over the 2018-19 to 2019-20 period and 3.7 per cent annually over the 2020-21 to 2023-24 period.
Growth in tax revenues expected to moderate
Slowing economic growth to dampen tax gains
Source: Ontario Public Accounts, 2019 Ontario Economic Outlook and Fiscal Review and FAO.
Accessible version
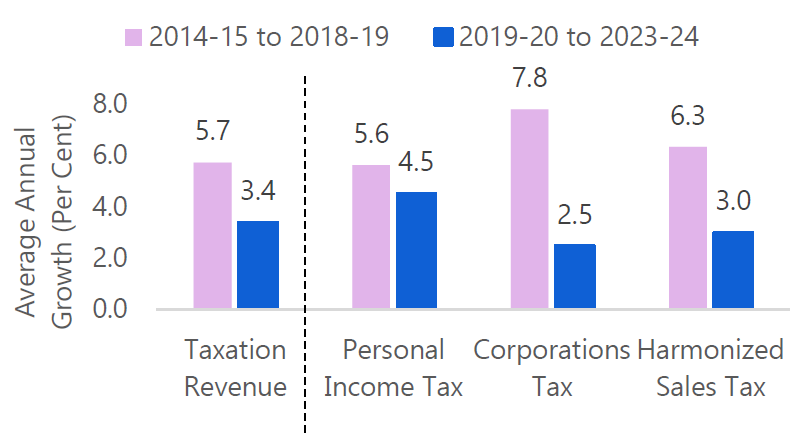
This chart shows average annual growth rates for taxation revenues, personal income tax, corporations tax and harmonized sales tax over the 2014-15 to 2018-19 and 2019-20 to 2023-24 periods. Over the 2014-15 to 2018-19 period, taxation revenue grew by 5.7 per cent, personal income tax grew by 5.6 per cent, corporations tax grew by 7.8 per cent and harmonized sales tax grew by 6.3 per cent. Over the 2019-20 to 2023-24 period, taxation revenue is projected to grow by 3.4 per cent, personal income tax is projected to grow by 4.5 per cent, corporations tax is projected to grow at 2.5 per cent and harmonized sales tax is projected to grow by 3.0 per cent.
After several years of strong economic gains, slower growth over the outlook is expected to dampen revenue increases, particularly from taxation sources. Over the next five years, the FAO projects average annual tax revenue growth of just 3.4 per cent, slower than the 5.7 per cent average gain during 2014-15 to 2018-19.[21] Slower growth is projected across all three major tax revenue sources.
The impact of slower economic growth on overall revenues is compounded by recent policy measures introduced over the past year. In total, these measures would reduce revenue by $4.2 billion in 2019-20 and by an average of $3.4 billion over the remainder of the outlook.[22] These revenue policy changes include cancelling the cap and trade program,[23] reversing a number of tax measures included in the 2018 budget,[24] introducing the Low-income Individuals and Families Tax (LIFT) credit,[25] and paralleling the federal changes to the corporate income tax.[26]
The government’s revenue outlook includes unannounced tax cuts
Revenue impact of unannounced tax policy changes
Source: FAO.
Accessible version
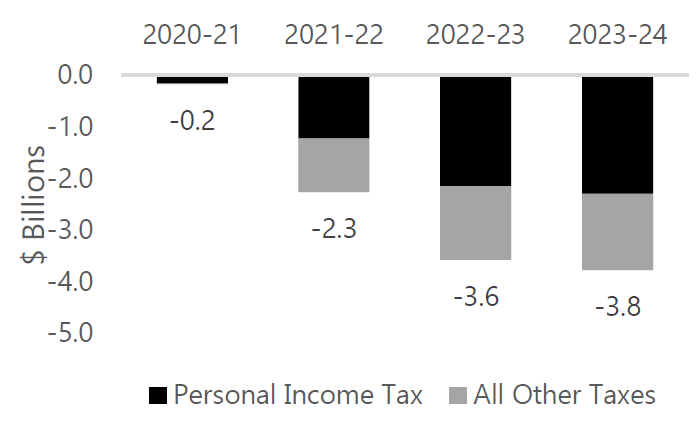
This chart shows changes in personal income tax revenues and all other taxation revenues due to implied future unannounced tax policy changes between 2020-21 and 2023-24 in billions of dollars. The chart shows that projected future tax policy changes would reduce revenue by $0.2 billion in 2020-21, $2.3 billion in 2021-22, $3.6 billion in 2022-23 and $3.8 billion in 2023-24.
In the 2019 Fall Economic Statement, the government projected total revenue would reach $165.4 billion by 2021-22, about $2 billion lower than the FAO’s projection. This is largely the result of lower taxation revenue.
The lower tax revenue forecast in the government’s projection is mainly due to the inclusion of unannounced tax cuts, starting in 2021-22.[27] While the government has not provided details on design or implementation, the FAO estimates that the tax cuts assumed in the government’s forecast will reduce revenues by about $2.3 billion in 2021-22, growing to about $3.8 billion by 2023-24.
| Revenue Source | Assumption | Forecast |
|---|---|---|
| Taxation Revenue | Grows with key economic drivers including labour income, corporate profits, household spending and GDP. Incorporates announced policy changes, including the Low-income Individuals and Families Tax credit. Excludes unannounced policy changes. | Averages 3.4 per cent over 2019-20 to 2023-24. |
| Federal Transfers | Based on legislated growth rates and economic forecasts for Ontario and Canada as well as government projections for smaller transfer programs. | Averages 2.8 per cent over 2019-20 to 2023-24. |
| Government Business Enterprises (GBEs) | Based on government projections from the 2019 Ontario Budget and 2019 Ontario Economic Outlook and Fiscal Review. | Averages 6.2 per cent over 2019-20 to 2023-24. |
| Other Revenue | Based on government projections from the 2019 Ontario Budget and 2019 Ontario Economic Outlook and Fiscal Review. | Averages 1.1 per cent over 2019-20 to 2023-24. |
Expense Outlook
In the 2019 Fall Economic Statement, the government projected total spending would grow by 1.8 per cent per year on average during the 2019-20 to 2021-22 period. The growth in total spending reflects 1.6 per cent average annual growth in program spending combined with a 3.9 per cent average annual increase in interest on debt payments.
Higher program spending compared to the 2019 budget
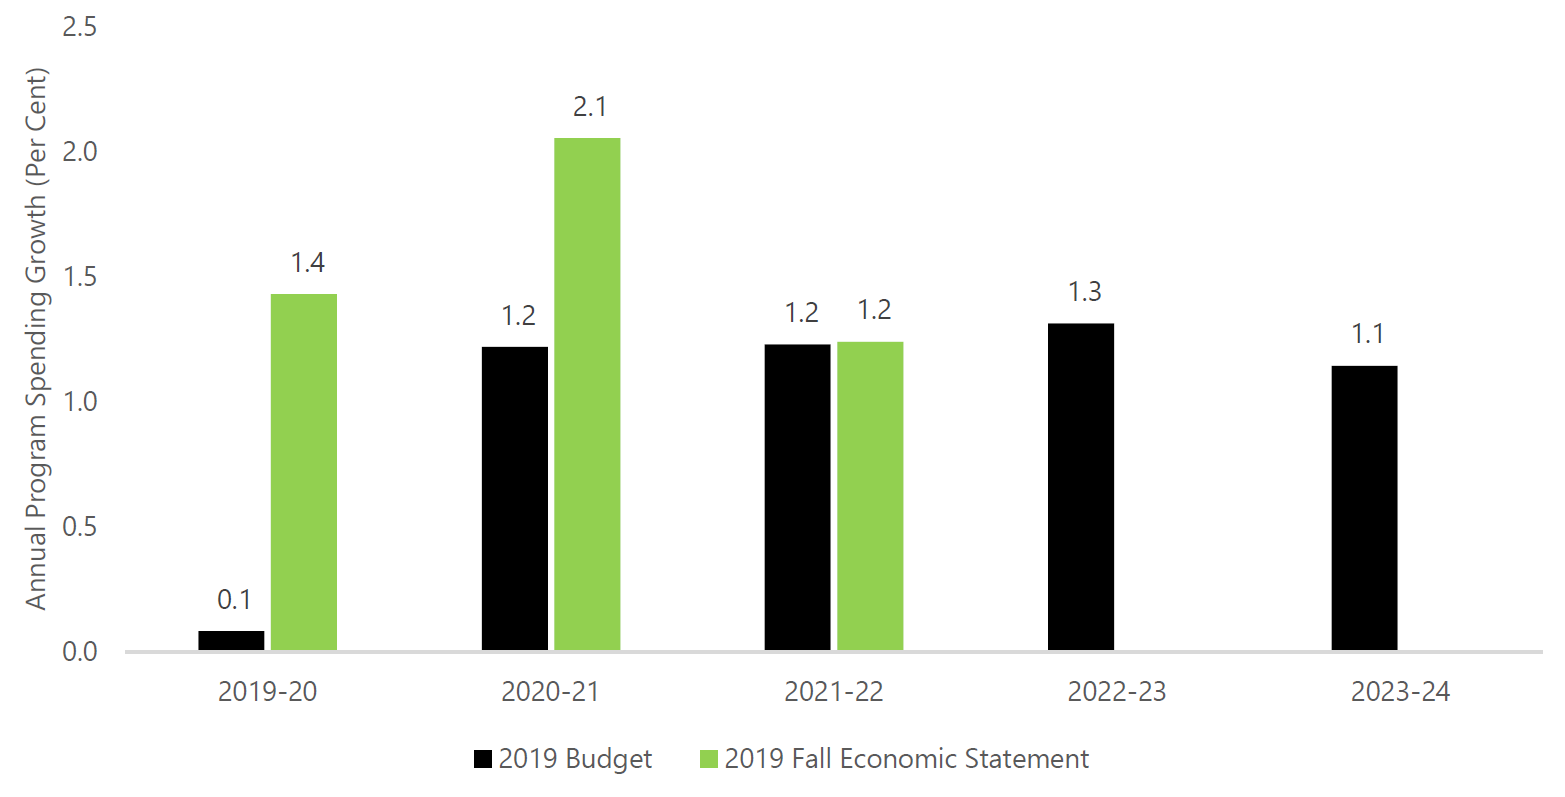
The 2019 Fall Economic Statement raised overall program spending growth in 2019-20 and 2020-21 compared to the 2019 budget.[28] For 2021-22, program spending is planned to increase by 1.2 per cent, unchanged from the 2019 budget.
The government did not update its program spending projection beyond 2021-22 in the Fall Economic Statement. However, based on the Fall Economic Statement combined with spending growth assumed in the 2019 budget outlook, program spending would be expected to grow at an average annual rate of 1.4 per cent over the full five-year outlook.[29]
Since the 2019 Ontario Budget, the government has announced further changes to a number of previously announced policies, particularly for social services.[30] In addition, the Fall Economic Statement included higher spending allocations for the Health sector due to greater-than-anticipated demand for health services, and for Education due to higher funding for childcare programs.
Program spending growth remains modest, despite upward revisions
Source: 2019 Ontario Budget, 2019 Ontario Economic Outlook and Fiscal Review and FAO.
Accessible version
This chart shows the annual program spending growth under the 2019 Budget and the 2019 Fall Economic Statement from 2019-20 to 2023-24. Under the 2019 Budget, program spending growth is expected to be 0.1 per cent in 2019-20, 1.2 per cent in 2020-21, 1.2 per cent in 2021-22, 1.3 per cent in 2022-23 and 1.1 per cent in 2023-24. Under the 2019 Fall Economic Statement, program spending growth is expected to be 1.4 per cent in 2019-20, 2.1 per cent in 2020-21 and 1.2 per cent in 2021-22.
Spending restraint remains over the medium term
For 2019-20, the government increased its planned spending in the Health, Education, and Children’s and Social Services sectors.[31] Despite these higher funding allocations, planned spending in 18 out of 24 ministries is lower in 2019-20 compared to actual spending in 2018-19. Program spending in Colleges and Universities, Energy, Northern Development and Mines, Municipal Affairs and Housing, and Indigenous Affairs is expected to decline by a combined $1.7 billion this fiscal year compared to 2018-19. For additional details, see Appendix Table 4.
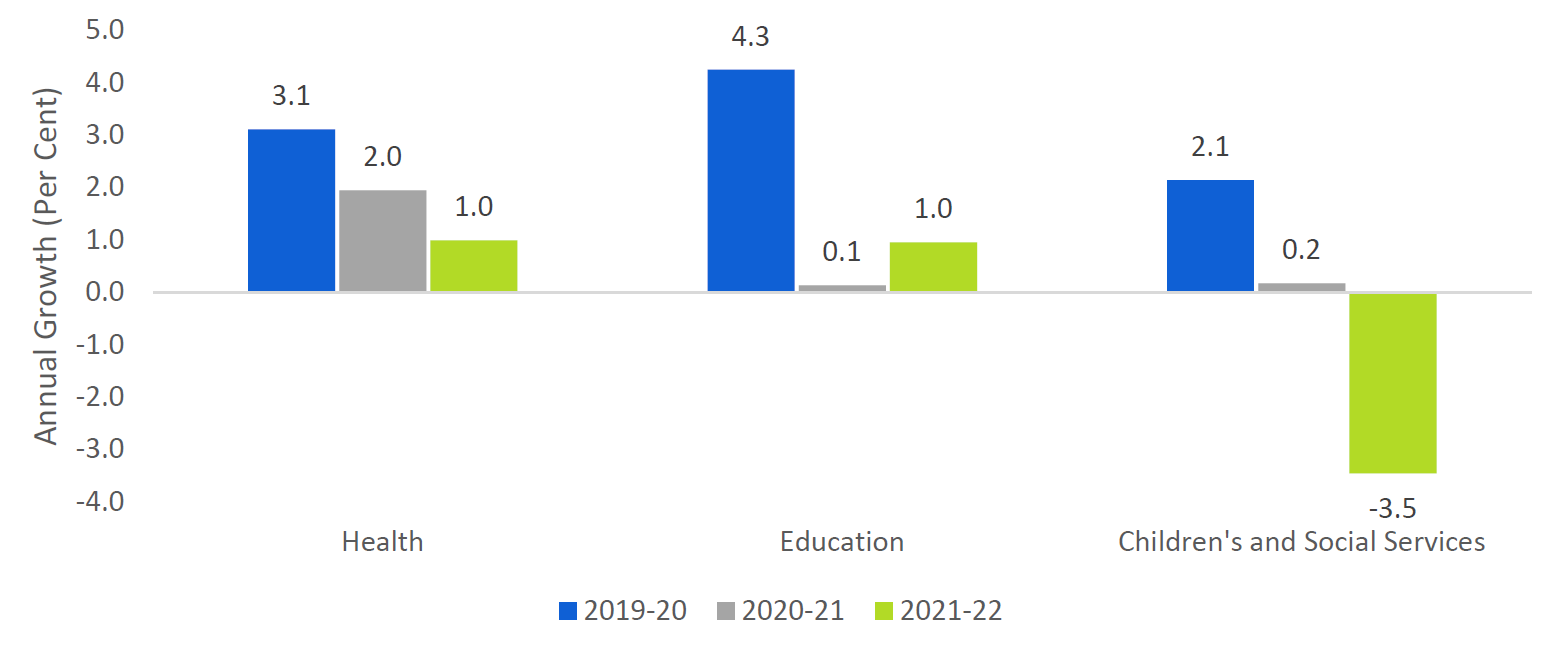
Beyond 2019-20, the Fall Economic Statement increasingly limits spending growth in the three largest sectors.
The Fall Economic Statement increasingly limits spending growth over the outlook
Source: 2019 Ontario Budget, 2019 Ontario Economic Outlook and Fiscal Review and FAO.
Accessible version
This chart shows a comparison between annual spending growth for the health, education and children’s and social services sectors in the 2019-20, 2020-21 and 2021-22 fiscal years. Spending growth in the health sector is expected to be 3.1 per cent in 2019-20, 2.0 per cent in 2020-21 and 1.0 per cent in 2021-22. Spending growth in the education sector is expected to be 4.3 per cent in 2019-20, 0.1 per cent in 2020-21 and 1.0 per cent in 2021-22. Spending growth in the children’s and social services sector is expected to be 2.1 per cent in 2019-20, 0.2 per cent in 2020-21 and -3.5 per cent in 2021-22.
To restrain program spending growth over the medium term, the government is implementing a variety of measures, including:
- consolidation of the province’s Local Health Integration Networks (LHINs) and other provincial health agencies into Ontario Health,[32] integration of supply chains, reforming OHIP+ to cover only children and youth without pre-existing drug plans, and restricting base hospital operating funding growth to less than one per cent annually over the outlook;[33]
- increasing class sizes for students in grade 4 through 12 and expanding e-learning for secondary school students; and
- transforming the delivery of children’s and social services, including social assistance, developmental services and youth justice services.
Additional cost savings required to achieve spending plan
Over the 2019-20 to 2021-22 period, Ontario’s population is expected to increase by over 750,000 people (or 5.3 per cent)[34] while the share of seniors in Ontario’s total population will also rise, placing additional demands on the health care system. During the same period, consumer prices are projected to increase by a cumulative 6.2 per cent, raising the cost of purchasing goods and services and putting upward pressure on public sector wages.
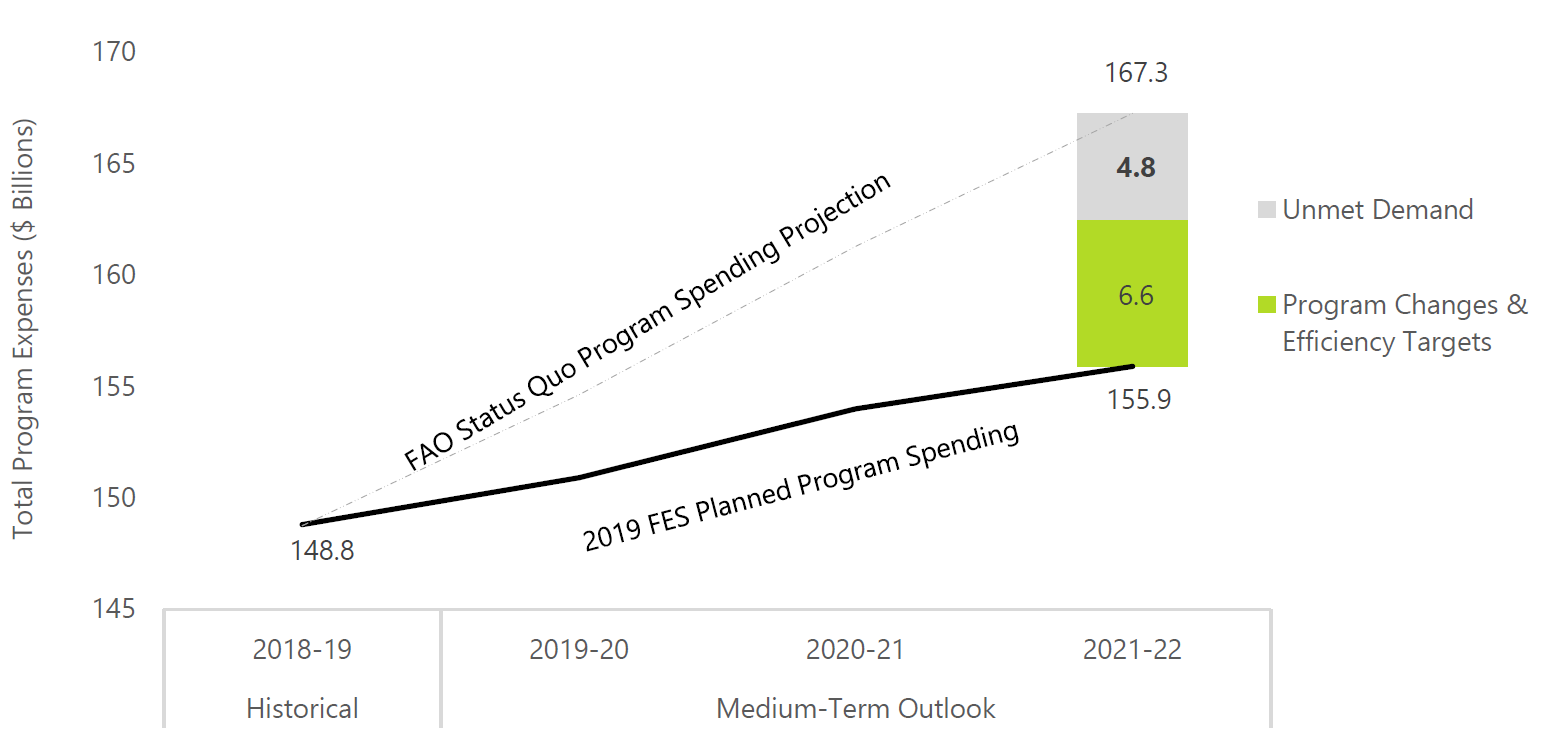
The FAO’s “status quo” projection for program spending reflects these underlying cost drivers and suggests that in the absence of policy changes, program spending would need to increase to $167.3 billion by 2021-22 in order to maintain the current mix and quality of Ontario’s public services.
In contrast, based on the Fall Economic Statement, the government plans to increase program spending to $155.9 billion by 2021-22, or $11.4 billion less than the FAO’s status quo projection.
Over the past 18 months, the Ontario government has announced a broad range of program changes and efficiency targets intended to achieve cost savings that lower program spending.[35] In addition, the government recently passed Bill 124,[36] which limits public sector compensation growth to an average annual increase of 1.0 per cent, providing further cost savings.[37]
In total, the government’s policy changes and wage restraint could amount to $6.6 billion of potential cost savings if successfully implemented. This suggests that the demand for public services will exceed the government’s planned program spending by approximately $4.8 billion by 2021-22, after accounting for the government’s cost-saving measures.[38]
Demand for public services exceeds the government’s planned spending by $4.8 billion in 2021-22
Source: FAO analysis of data from Treasury Board Secretariat.
Accessible version
This chart shows the historical and projected total program expenses in billions of dollars under the FAO status quo projection and the 2019 Fall Economic Statement from 2018-19 to 2021-22. In the 2018-19 fiscal year, total program expenses were $148.8 billion. Under the FAO status quo projection, program spending is expected to increase to $167.3 billion by 2021-22 and under the 2019 Fall Economic Statement, program spending is expected to increase to $155.9 billion. The chart highlights that $6.6 billion of this difference in projected program spending can be attributed to program changes and efficiency targets and the remaining $4.8 billion is unmet demand.
In the absence of $5 billion in higher spending to fund the expected demand for public services, the government could:
- announce additional program changes that would reduce costs;
- identify and achieve further efficiency gains in the delivery of public services; or
- restrict access or underfund current programs, which could affect the quality of existing public services.
It is unclear to what extent the Province will rely on these various options to achieve its spending targets, or if the existing program changes and efficiency measures will produce the cost savings anticipated in the government’s fiscal plan.
However, if the government achieves its spending plan, program spending per person would be reduced by $1,070 (approximately 10 per cent) by 2023-24, compared to 2018-19.
The government plans to reduce spending per person by $1,070 over five years
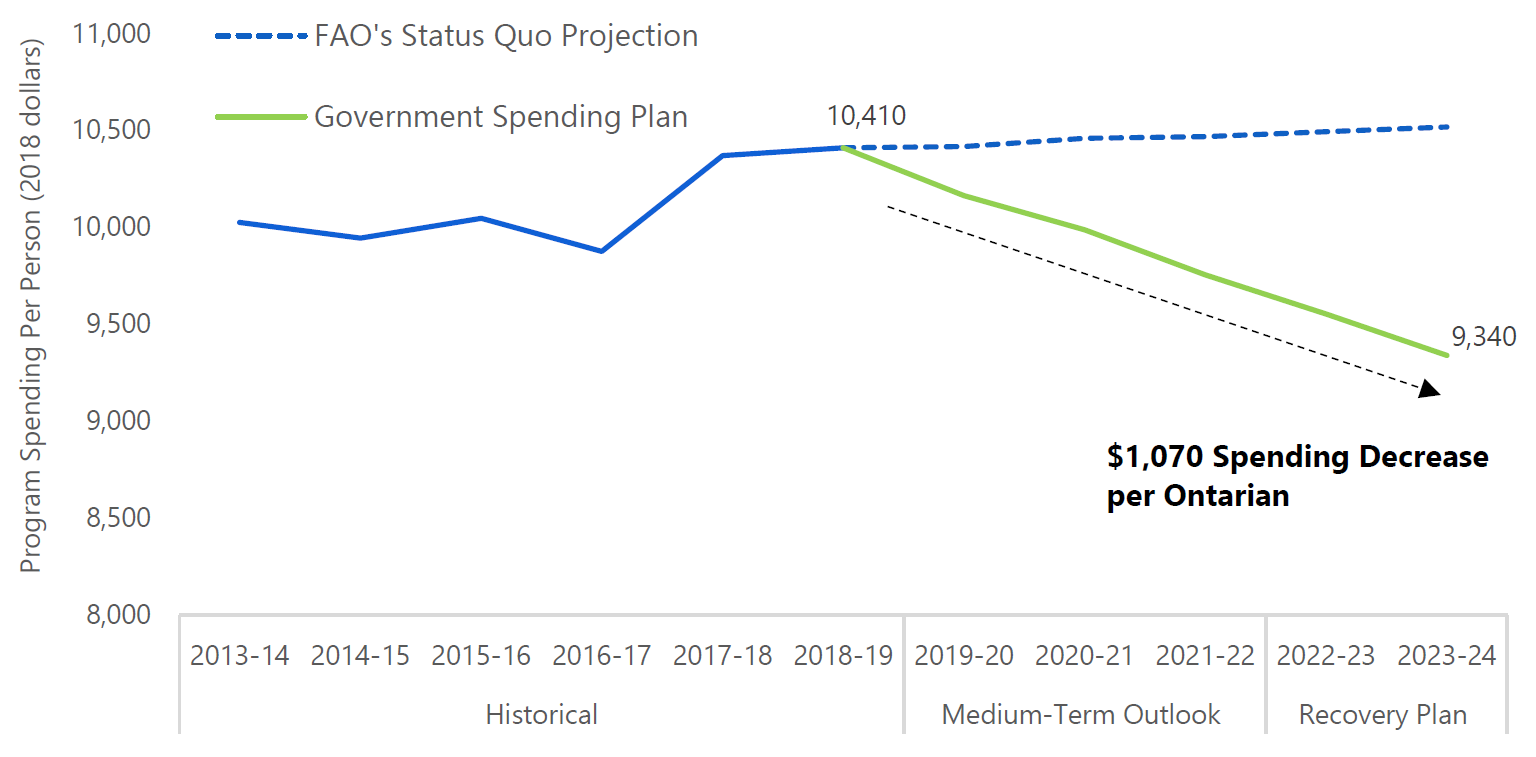
Note: Estimates for program spending in 2022-23 and 2023-24 are based on program spending growth rates from the 2019 Ontario Budget.<
Source: Ontario Public Accounts, 2019 Ontario Budget, 2019 Ontario Economic Outlook and Fiscal Review and FAO.
Accessible version
This chart shows the historical and projected program spending per person in 2018 dollars according to the government’s spending plan and the FAO status quo projection from the fiscal years 2013-14 to 2023-24. The chart shows that the program spending per person was $10,025 in 2013-14, $9,945 in 2014-15, $10,046 in 2015-16, $9,876 in 2016-17, $10,370 in 2017-18 and $10,410 in 2018-19. Under the 2019 Fall Economic Statement, program spending is projected to gradually fall to $9,340 by 2023-24. Under the FAO status quo projection, program spending is projected to increase to $10,518 by 2023-24. The chart highlights that program spending is expected to decrease by $1070 per Ontarian by 2023-24.
The government’s budget plan comes with risks
The Fall Economic Statement reaffirmed the government’s commitment to balance the budget by 2023-24 in order to put Ontario’s finances “… on a path towards fiscal sustainability.”[39] The government’s plan to balance the budget relies primarily on spending restraint, while also incorporating measures that reduce the growth of existing tax revenue sources. The extent to which the government’s fiscal plan will deliver a sustainable improvement to Ontario’s finances depends on the success of the government’s transformational changes to public services, particularly in the areas of health and education.
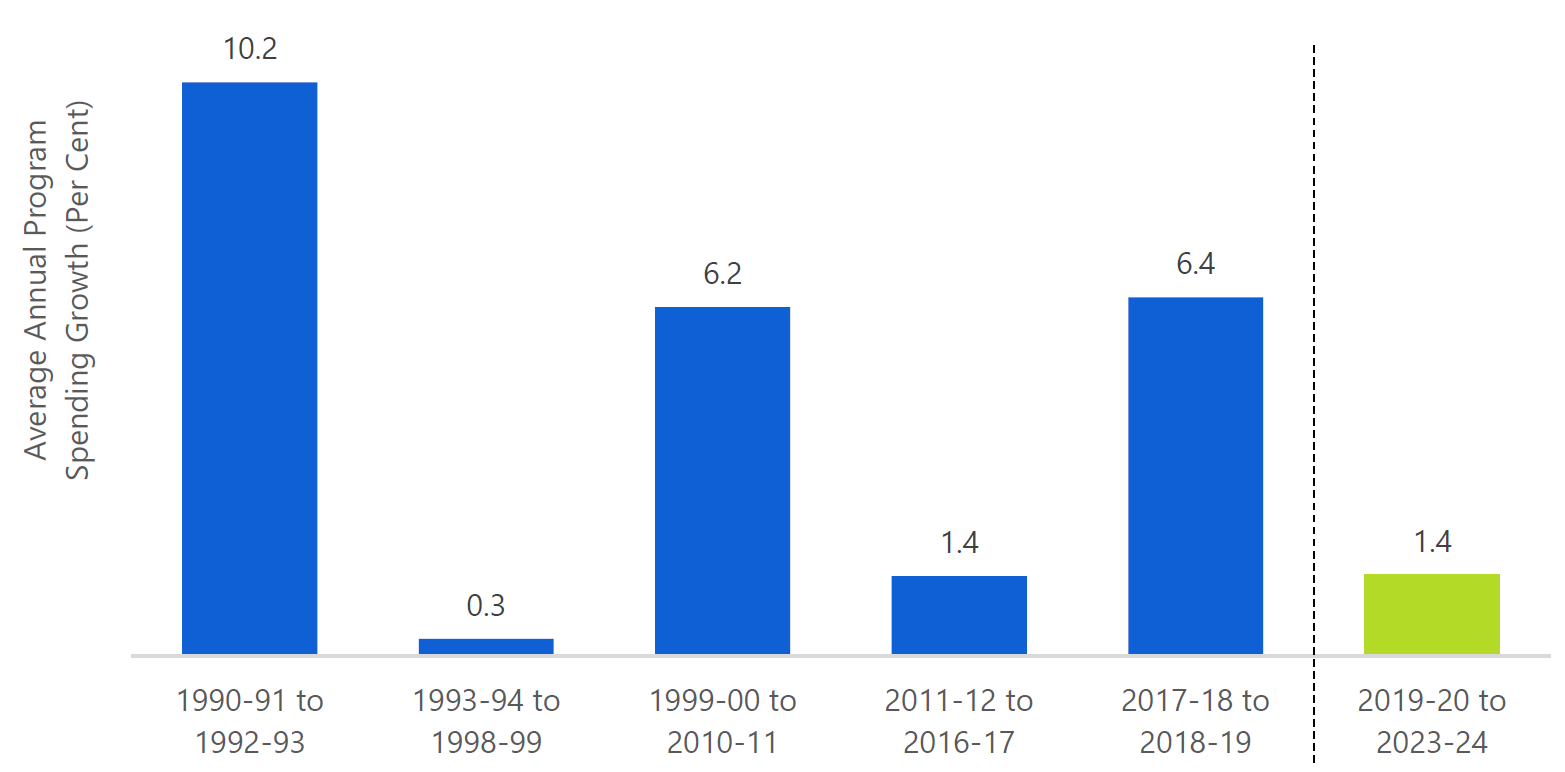
Transformational changes to public services that lead to permanent efficiency gains are possible but have generally been difficult to achieve.[40] Furthermore, while the reduction or elimination of government programs is also an option, this has proven challenging to implement and sustain.
As a result, governments have often relied on temporary measures to manage and restrain public spending. However, temporary measures can result in a “catch-up” period where additional spending is used to address built-up budgetary pressures.
Historically, periods of spending restraint were followed by “catch-up” periods
Note: Pre-2009 data is from Statistics Canada table 385-0001.
Source: Statistics Canada, 2019 Ontario Budget, 2019 Ontario Economic Outlook and Fiscal Review and FAO.
Accessible version
This chart shows the average annual program spending growth over the 1990-91 to 2023-24 period. Average annual program spending growth was 10.2 per cent over the 1990-91 to 1992-93 period, 0.3 per cent over the 1993-94 to 1998-99 period, 6.2 per cent over the 1990-00 to 2010-11 period, 1.4 per cent over the 2011-12 to 2016-17 period and 6.4 per cent over the 2017-18 to 2018-19 period. Average annual program spending growth is projected to be 1.4 per cent over the 2019-20 to 2023-24 period.
Avoiding a period of “catch-up” spending beyond the medium-term outlook will depend on how the current government achieves cost reductions, and the extent to which transformational changes to public services permanently improve efficiency.[41]
Impact of Implementing Unannounced Measures
In the FAO’s baseline projection, unannounced measures incorporated in the Fall Economic Statement and 2019 budget are excluded because they are not reflected in current legislation and have not been formally proposed by the government. On this basis, the FAO projects that the Ontario budget would reach a large $8.7 billion surplus by 2023-24, achieved primarily through spending restraint.
If the government were to implement the unannounced measures, the FAO estimates that the budget balance would deteriorate by $3.0 billion in 2021-22, $4.9 billion in 2022-23 and $5.6 billion in 2023-24.
| 2019-20 | 2020-21 | 2021-22 | 2022-23 | 2023-24 | |
|---|---|---|---|---|---|
| Budget Balance – FAO Baseline (Excluding unannounced measures) |
-8.5 | -5.5 | -0.6 | 3.7 | 8.7 |
| Impact of implementing unannounced measures* | -0.1 | -3.0 | -4.9 | -5.6 | |
| Budget Balance including unannounced measures | -8.5 | -5.5 | -3.6 | -1.1 | 3.2 |
| Budget Balance – 2019 Fall Economic Statement | -8.0 | -5.7 | -4.4 | ||
| Net debt – FAO Baseline (Excluding unannounced measures) |
354.3 | 366.1 | 372.2 | 372.8 | 368.9 |
| Net debt to GDP (Per Cent) | 39.9 | 39.8 | 39.0 | 37.8 | 36.1 |
| Impact of implementing unannounced measures* | 0.1 | 3.1 | 7.9 | 13.5 | |
| Net debt including unannounced measures | 354.3 | 366.2 | 375.3 | 380.7 | 382.4 |
| Net debt to GDP (Per Cent) | 39.9 | 39.8 | 39.4 | 38.6 | 37.4 |
| Net debt – 2019 Fall Economic Statement | 353.7 | 365.8 | 375.7 | ||
| Net debt to GDP (Per Cent) | 40.0 | 40.1 | 39.8 | ||
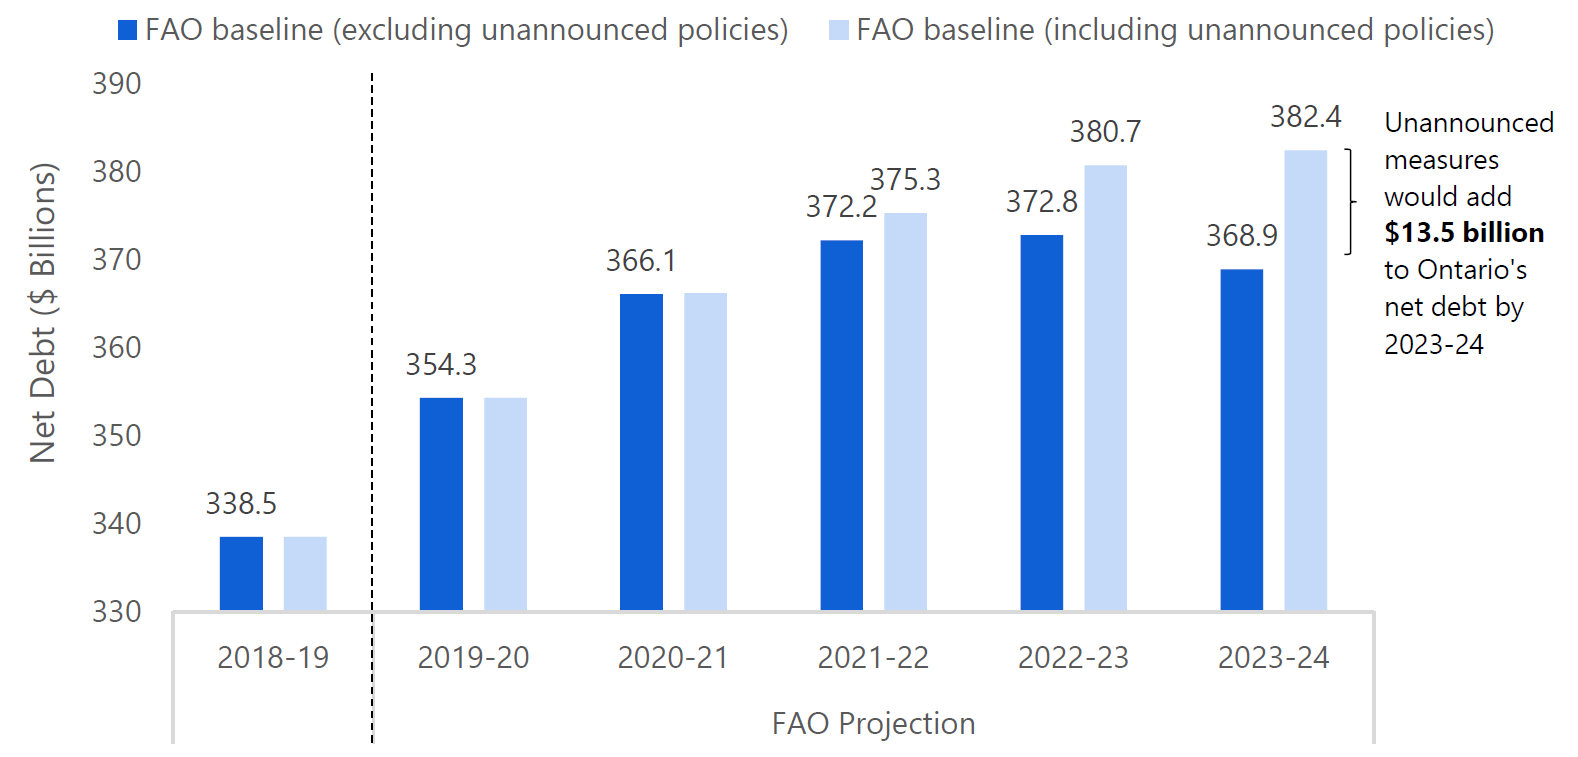
Based on the FAO’s projections, if the government achieves its plan of significantly restraining program spending, it would create enough fiscal capacity to allow the government to introduce the unannounced tax and spending measures and still achieve a balanced budget by 2023-24. The FAO estimates that implementing the government’s unannounced measures would result in a gradual decline in the deficit over the outlook, and a surplus of $3.2 billion by 2023-24. Implementing the unannounced measures would also result in an additional $13.5 billion in net debt by 2023-24.
Unannounced measures would add $13.5 billion to Ontario’s net debt by 2023-24
Source: 2019 Ontario Economic Outlook and Fiscal Review and FAO.
Accessible version
This chart shows a comparison of Ontario’s historical and projected net debt from 2018-19 to 2023-24 based on the FAO baseline including and excluding unannounced policies in billions of dollars. Under the FAO baseline excluding unannounced policies, net debt was $338.5 billion in 2018-19 and is projected to be $354.3 billion in 2019-20, $366.1 billion in 2020-21, $372.2 billion in 2021-22, $372.8 billion in 2022-23 and $368.9 billion in 2023-24. Under the FAO baseline including unannounced policies, net debt was $338.5 billion in 2018-19 and is projected to be $354.3 billion in 2019-20, $366.2 billion in 2020-21, $375.3 billion in 2021-22, $380.7 billion in 2022-23 and $382.4 billion in 2023-24. The chart highlights that the unannounced measures would add $13.5 billion to Ontario’s net debt by 2023-24.
Budget Sensitivities
Changes in Ontario’s current revenue or expense policies, as well as external factors, can have a significant impact on Ontario’s budget balance. In the table below, the FAO provides estimates of the sensitivity of Ontario’s fiscal position to potential changes across several key policy areas, including tax policy, federal transfers, expenditure policy and economic risks. For example:
- For tax policy, if the government were to permanently increase personal income tax (PIT) revenue by 10 per cent or around $500 per tax filer, starting in 2019-20, the budget deficit would fall by $3.7 billion in the first year and by $5.2 billion in 2023-24.
- For expenditure policy, if the government were to decrease the growth rate of program spending by 0.5 percentage point for each year, or $2.3 billion on average over the projection, the budget deficit would decrease by $4.4 billion by 2023-24.
- If Ontario’s effective interest rate on its borrowing were to decrease by 1 percentage point, beginning in 2019-20, the deficit would decline by $0.5 billion in 2019-20 and $1.7 billion in 2023-24.
| Change in Budget Balance in: | ||
|---|---|---|
| Change Beginning in 2019-20 | 2019-20 | 2023-24 |
| Tax Policy | ||
| A sustained 10 per cent increase in Personal Income Tax revenues ($500 per tax filer in 2019-20) over the projection | +$3.7 billion | +$5.2 billion |
| A sustained 1 percentage point increase in the general Corporations Tax rate over the projection | +$1.1 billion | +$1.6 billion |
| A sustained 1 percentage point increase in the HST rate over the projection | +$3.6 billion | +$4.7 billion |
| Federal Transfers | ||
| A sustained 1 percentage point increase in the annual growth of the Canada Health Transfer over the projection | +$0.2 billion | +$1.0 billion |
| A sustained 1 percentage point increase in the annual growth of the Canada Social Transfer over the projection | +$0.1 billion | +$0.4 billion |
| Expenditure Policy | ||
| A sustained 0.5 percentage point decrease in the growth rate of total program spending over the projection | +$0.8 billion | +$4.4 billion |
| A sustained 1 percentage point decrease in the growth rate of health spending over the projection | +$0.6 billion | +$3.9 billion |
| A sustained 1 percentage point decrease in the growth rate of social assistance over the projection | +$0.1 billion | +$0.6 billion |
| Borrowing Costs | ||
| A sustained 1 percentage point decrease in Ontario’s effective borrowing rate over the projection | +$0.5 billion | +$1.7 billion |
4 | Appendices
Forecast Tables
| (Per Cent Growth) | 2017a | 2018a | 2019f | 2020f | 2021f | 2022f | 2023f | Average* |
|---|---|---|---|---|---|---|---|---|
| Nominal GDP | ||||||||
| FAO – Fall 2019 | 4.6 | 3.7 | 3.6 | 3.5 | 3.6 | 3.6 | 3.6 | 3.6 |
| 2019 Ontario FES | – | – | 3.4 | 3.3 | 3.3 | 3.6 | – | 3.4 |
| Consensus** | – | – | 3.7 | 3.7 | 3.7 | 3.9 | 3.9 | 3.8 |
| Labour Income | ||||||||
| FAO – Fall 2019 | 4.6 | 5.5 | 4.2 | 4.0 | 3.8 | 3.8 | 3.8 | 3.9 |
| 2019 Ontario FES | – | – | 4.3 | 4.0 | 3.7 | 3.8 | – | 4.0 |
| Corporate Profits | ||||||||
| FAO – Fall 2019 | 2.7 | -0.9 | 1.7 | 2.7 | 3.4 | 3.5 | 3.5 | 3.0 |
| 2019 Ontario FES | – | – | 0.6 | 0.6 | 2.7 | 3.9 | – | 2.0 |
| Household Consumption | ||||||||
| FAO – Fall 2019 | 5.2 | 4.4 | 3.7 | 3.7 | 3.7 | 3.7 | 3.7 | 3.7 |
| 2019 Ontario FES | – | – | – | – | – | – | – | – |
| (Per Cent Growth) | 2017a | 2018a | 2019f | 2020f | 2021f | 2022f | 2023f | Average* |
|---|---|---|---|---|---|---|---|---|
| Real GDP | ||||||||
| FAO – Fall 2019 | 2.9 | 2.2 | 1.7 | 1.7 | 1.7 | 1.7 | 1.7 | 1.7 |
| 2019 Ontario FES | – | – | 1.4 | 1.5 | 1.5 | 1.9 | – | 1.6 |
| Consensus** | – | – | 1.6 | 1.7 | 1.7 | 1.9 | 1.8 | 1.7 |
| Real GDP Components | ||||||||
| Household Consumption | 4.1 | 2.5 | 1.9 | 1.9 | 1.9 | 1.9 | 1.9 | 1.9 |
| Residential Investment | 0.6 | -3.3 | -5.3 | 2.8 | 2.4 | 2.3 | 2.3 | 0.9 |
| Business Investment*** | 8.4 | 6.3 | -2.6 | 0.9 | 2.8 | 2.5 | 2.5 | 1.2 |
| Government (Consumption and Investment) | 2.8 | 4.0 | 1.6 | 0.4 | 0.4 | 0.4 | 0.3 | 0.6 |
| Exports | 0.4 | 0.9 | 2.6 | 2.0 | 2.0 | 2.0 | 2.0 | 2.1 |
| Imports | 3.1 | 1.6 | 1.2 | 1.5 | 1.8 | 1.9 | 1.9 | 1.7 |
| 2017a | 2018a | 2019f | 2020f | 2021f | 2022f | 2023f | |
|---|---|---|---|---|---|---|---|
| Employment (Per Cent Growth) | |||||||
| FAO – Fall 2019 | 1.8 | 1.6 | 2.8 | 1.0 | 0.9 | 0.9 | 0.9 |
| 2019 Ontario FES | 1.8 | 1.6 | 2.6 | 1.2 | 1.0 | 1.1 | – |
| Unemployment Rate (Per Cent) | |||||||
| FAO – Fall 2019 | 6.0 | 5.6 | 5.6 | 5.7 | 5.8 | 5.9 | 6.0 |
| 2019 Ontario FES | 6.0 | 5.6 | 5.6 | 5.5 | 5.5 | 5.5 | – |
| Labour Force (Per Cent Growth) | |||||||
| FAO – Fall 2019 | 1.2 | 1.2 | 2.7 | 1.1 | 1.0 | 1.0 | 0.9 |
| 2019 Ontario FES | – | – | – | – | – | – | – |
| Population Growth (Per Cent) | |||||||
| FAO – Fall 2019 | 1.4 | 1.7 | 1.8 | 1.8 | 1.6 | 1.5 | 1.4 |
| 2019 Ontario FES | – | – | – | – | – | – | – |
| CPI Inflation (Per Cent Growth) | |||||||
| FAO – Fall 2019 | 1.7 | 2.4 | 1.9 | 2.0 | 2.0 | 2.0 | 2.0 |
| 2019 Ontario FES | 1.7 | 2.4 | 2.0 | 2.0 | 1.9 | 1.9 | – |
| Canada Real GDP (Per Cent Growth) | |||||||
| FAO – Fall 2019 | 3.2 | 2.0 | 1.5 | 1.8 | 1.9 | 1.9 | 1.9 |
| 2019 Ontario FES | – | – | – | – | – | – | – |
| U.S. Real GDP (Per Cent Growth) | |||||||
| FAO – Fall 2019 | 2.4 | 2.9 | 2.3 | 1.9 | 1.9 | 1.9 | 1.9 |
| 2019 Ontario FES | 2.4 | 2.9 | 2.3 | 1.7 | 1.8 | 1.9 | – |
| Canadian Dollar (Cents US) | |||||||
| FAO – Fall 2019 | 77.1 | 77.2 | 76.0 | 76.5 | 76.7 | 76.9 | 77.1 |
| 2019 Ontario FES | 77.1 | 77.2 | 75.4 | 76.3 | 77.0 | 77.9 | – |
| Three-month Treasury Bill Rate (Per Cent) | |||||||
| FAO – Fall 2019 | 0.7 | 1.4 | 1.7 | 1.5 | 1.7 | 1.9 | 2.1 |
| 2019 Ontario FES | 0.7 | 1.4 | 1.6 | 1.5 | 1.5 | 1.8 | – |
| 10-year Government Bond Rate (Per Cent) | |||||||
| FAO – Fall 2019 | 1.8 | 2.3 | 1.6 | 1.9 | 2.2 | 2.5 | 2.7 |
| 2019 Ontario FES | 1.8 | 2.3 | 1.5 | 1.6 | 2.1 | 2.5 | – |
| ($ Millions) | 2018–19 Actual ($) | 2019–20 FES ($) | Y/Y Change ($) | Y/Y Growth (Per Cent) |
|---|---|---|---|---|
| Ministry | ||||
| Health and Long-Term Care | 61,904 | 63,831 | 1,927 | 3.1 |
| Education* | 30,425 | 31,702 | 1,277 | 4.2 |
| Treasury Board Secretariat (Base) | 1,346 | 1,640 | 294 | 21.8 |
| Contingency Fund (Total) | 0 | 549 | 549 | – |
| Transportation | 4,718 | 5,126 | 408 | 8.6 |
| Children, Community and Social Services | 16,862 | 17,223 | 361 | 2.1 |
| Infrastructure | 513 | 550 | 37 | 7.1 |
| Francophone Affairs | 6 | 6 | -0 | -3.3 |
| Executive Offices | 38 | 38 | -1 | -1.3 |
| Seniors and Accessibility | 52 | 51 | -1 | -2.3 |
| Labour, Training and Skills Development | 307 | 293 | -14 | -4.6 |
| Natural Resources and Forestry | 716 | 699 | -17 | -2.4 |
| Solicitor General | 2,681 | 2,645 | -36 | -1.4 |
| Heritage, Sport, Tourism and Culture Industries | 1,562 | 1,512 | -51 | -3.2 |
| Government and Consumer Services | 1,757 | 1,687 | -70 | -4.0 |
| Environment, Conservation and Parks | 682 | 606 | -76 | -11.1 |
| Board of Internal Economy | 371 | 288 | -84 | -22.5 |
| Attorney General | 1,714 | 1,604 | -110 | -6.4 |
| Economic Development, Job Creation and Trade | 922 | 773 | -149 | -16.1 |
| Agriculture, Food and Rural Affairs | 1,066 | 880 | -186 | -17.5 |
| Finance | 1,637 | 1,450 | -187 | -11.4 |
| Indigenous Affairs | 290 | 72 | -218 | -75.1 |
| Municipal Affairs and Housing | 1,479 | 1,112 | -368 | -24.8 |
| Energy, Northern Development and Mines | 5,721 | 5,179 | -543 | -9.5 |
| Colleges and Universities | 11,984 | 11,369 | -615 | -5.1 |
| Interest on Debt | 12,384 | 12,905 | 521 | 4.2 |
| Total Expense | 161,135 | 163,785 | 2,650 | 1.6 |
| ($ Billions) | 2016a | 2017a | 2018a | 2019f | 2020f | 2021f | 2022f | 2023f |
|---|---|---|---|---|---|---|---|---|
| Revenue | ||||||||
| Personal Income Tax | 30.7 | 32.9 | 35.4 | 36.8 | 38.5 | 40.3 | 42.2 | 44.1 |
| Sales Tax | 24.8 | 25.9 | 27.8 | 27.9 | 29.0 | 30.0 | 31.1 | 32.2 |
| Corporations Tax | 14.9 | 15.6 | 16.6 | 15.8 | 16.5 | 17.2 | 17.9 | 18.8 |
| All Other Taxes | 24.1 | 25.3 | 25.7 | 26.4 | 27.3 | 28.1 | 28.8 | 29.5 |
| Total Taxation Revenue | 94.3 | 99.7 | 105.5 | 106.9 | 111.3 | 115.7 | 119.9 | 124.6 |
| Transfers from Government of Canada | 24.5 | 24.9 | 25.1 | 25.5 | 26.6 | 27.2 | 28.0 | 28.8 |
| Income from Government Business Enterprise | 5.6 | 6.2 | 5.5 | 5.8 | 6.3 | 6.9 | 7.1 | 7.4 |
| Other Non-Tax Revenue | 16.3 | 19.9 | 17.6 | 16.7 | 17.1 | 17.6 | 18.1 | 18.6 |
| Total Revenue | 140.7 | 150.6 | 153.7 | 154.9 | 161.3 | 167.3 | 173.2 | 179.3 |
| Expense | ||||||||
| Health Sector | 56.2 | 59.1 | 61.9 | 63.8 | 65.1 | 65.7 | 66.7 | 68.4 |
| Education Sector | 26.6 | 27.3 | 28.7 | 30.0 | 30.0 | 30.3 | 30.3 | 30.4 |
| Children’s and Social Services Sector | 15.7 | 16.3 | 16.9 | 17.2 | 17.3 | 16.7 | 16.3 | 16.2 |
| Other* | 33.0 | 39.7 | 41.2 | 39.9 | 41.7 | 42.6 | 43.6 | 43.4 |
| Total Program Expense | 131.5 | 142.4 | 148.8 | 150.9 | 154.1 | 155.3 | 156.9 | 158.4 |
| Interest on Debt | 11.7 | 11.9 | 12.4 | 12.6 | 12.7 | 12.7 | 12.5 | 12.2 |
| Total Expense | 143.2 | 154.3 | 161.1 | 163.5 | 166.8 | 167.9 | 169.4 | 170.6 |
| Budget Balance** | -2.4 | -3.7 | -7.4 | -8.5 | -5.5 | -0.6 | 3.7 | 8.7 |
| ($ Billions) | 2016a | 2017a | 2018a | 2019f | 2020f | 2021f | 2022f | 2023f |
|---|---|---|---|---|---|---|---|---|
| Budget Balance | -2.4 | -3.7 | -7.4 | -8.5 | -5.5 | -0.6 | 3.7 | 8.7 |
| Accumulated Deficit | 205.9 | 209.0 | 216.6 | 225.2 | 230.6 | 231.2 | 227.5 | 218.7 |
| Net Debt | 314.1 | 323.8 | 338.5 | 354.3 | 366.1 | 372.2 | 372.8 | 368.9 |
| Net Debt to GDP (Per Cent) | 39.6 | 39.2 | 39.6 | 39.9 | 39.8 | 39.0 | 37.8 | 36.1 |
Footnotes
[1] The government’s spending plan is based on updated program spending by sector from the “2019 Ontario Economic Outlook and Fiscal Review” (referred to as the Fall Economic Statement or FES) combined with program spending growth assumed in the 2019 Ontario Budget for 2022-23 and 2023-24.
[2] The FAO’s baseline projection also excludes any unannounced revenue or spending measures included in the government’s fiscal plan.
[3] In the Fall Economic Statement, the government projected a budget deficit of $8.0 billion for 2019-20 before the reserve or a $9.0 billion deficit including the reserve.
[4] See Assessing the Impact of an Economic Downturn on Ontario’s Finances, FAO, June 2019, for an assessment of the impact of an economic downturn on the Province’s fiscal position.
[5] World Economic Outlook, International Monetary Fund, October 2019. In its World Economic Outlook from April 2019 and October 2018, the IMF forecasted annual world economic growth of 3.3 per cent and 3.7 per cent in 2019, respectively.
[6] Ibid.
[7] World Economic Outlook, International Monetary Fund, October 2019.
[8] In September 2019, the US unemployment rate was 3.5 per cent, the lowest rate since August 1969.
[9] Transcript of Chair Powell’s Press Conference, Federal Open Market Committee, October 30, 2019.
[10] World Economic Outlook, International Monetary Fund, October 2019.
[11] The policy interest rate is the “target for the overnight rate," which is the rate at which major Canadian financial institutions can borrow from one another.
[12] Monetary Policy Report, Bank of Canada, October 2019.
[13] Ibid.
[14] A 200,000 net job gain would represent the largest increase in the level of Ontario employment on record for Statistics Canada’s Labour Force Survey, going back to 1976. Notably, a relatively large 40 per cent of the jobs created in 2019 were among the self-employed, more than twice its historical average contribution.
[15] Statistics Canada refers to corporate profits as the “net operating surplus of corporations” in the System of National Accounts.
[16] NAFTA and CUSMA refer to the North American Free Trade Agreement and the Canada-United States-Mexico Agreement, respectively.
[17] In 2018, the US introduced tax reforms, which included a significant reduction in corporate income tax rates and allowed the immediate write-off of certain capital investments.
[18] Incorporates the FAO’s revenue outlook and adopts the government’s plans to restrain program spending growth. Unannounced revenue or spending measures included in the government’s fiscal plan are excluded from the FAO’s baseline projection.
[19] As laid out in the 2019 Ontario Budget, updated for new revenue and spending information from the 2019 Fall Economic Statement from 2019-20 to 2021-22.
[20] Three revenue sources accounted for most of the $2.9 billion increase in 2018-19: corporations tax was $1.4 billion higher than expected due to revenue from prior-year tax returns; personal income tax was $0.4 billion higher, reflecting stronger employment and wage growth; and income from government business enterprises was $0.6 billion above expectations. See Understanding Ontario’s 2018-19 Deficit, FAO, October 2019, for more details.
[21] All average annual growth rates in this report are calculated using the year before the first indicated year as the base. For example, average annual tax revenue growth of 3.4 per cent during 2014-15 to 2018-19 is calculated using 2013-14 as the base year.
[22] See page 14 of the 2019 Spring Economic and Budget Outlook, FAO, May 2019.
[23] The loss of cap and trade revenue is partially offset by lower expenses from related programs. See the FAO’s Cap and Trade report, October 2018.
[24] Tax changes in the 2018 budget included the elimination of the personal income tax (PIT) surtax and associated adjustments to PIT brackets and rates, and changes to the application of the small business limit and the Employer Health Tax exemption. See the FAO’s 2018 Fall Economic and Budget Outlook.
[25] See Comparing the LIFT Credit to a Minimum Wage Increase, FAO, April 2019.
[26] These changes include paralleling the accelerated capital cost allowance measure introduced by the federal government (referred to as the “Ontario Job Creation Investment Incentive” by the Ontario government).
[27] These unannounced tax policy changes include reductions in personal income tax and other taxes beginning in 2021-22 and were also incorporated into the 2019 budget’s revenue outlook. See page 15 of the FAO’s 2019 Spring Economic and Budget Outlook for more details.
[28] Although the Fall Economic Statement reported an overall increase in program spending of $0.8 billion in 2019-20, spending by year-end may be lower. The FAO’s “Expenditure Monitor 2019-20: Q2” reported that through the first six months of the fiscal year the overall program spending authority was unchanged from the 2019 budget plan.
[29] The FAO estimates that program spending excluding new unannounced spending measures would grow by 1.3 per cent over the full five-year outlook.
[30] The Fall Economic Statement announced additional changes to the Ontario Autism Program, the Transition Child Benefit, Ontario Works, and Ontario Disability Support. See 2019 Fall Economic Statement, page 159 for details.
[31] Children’s and Social Services sector received $637 million or 48 per cent of the total new allocated spending in the 2019 Fall Economic Statement.
[32] The integration of LHINs and five health agencies will commence on December 2, 2019 while the Trillium Gift of Life Network will integrate later. See Government of Ontario News Release: Ontario Taking Next Steps to Integrate Health Care System, November 2019.
[33] See page 15, Expenditure Estimates 2019-20: Ministry of Health and Long-Term Care, FAO, May 2019.
[34] See Table 1 of Ontario Population Projections, 2018-2046, Ministry of Finance.
[35] Program changes include adjustments to program entitlements, reductions or elimination of existing programs, and changes to the way existing public services are delivered (e.g., larger class sizes). Efficiency targets include measures that aim to improve the delivery of public services without impacting service access or quality. The FAO estimates that these measures could produce $5.0 billion in cost savings by 2021-22. See page 19 of the the 2019 Spring Economic and Budget Outlook, FAO, May 2019 for details on program changes and efficiency measures announced in the 2019 Ontario Budget.
[36] See Bill 124, Protecting a Sustainable Public Sector for Future Generations Act, 2019.
[37] The FAO estimates that Bill 124 could result in additional cost savings of $1.6 billion by 2021-22.
[38] This estimated unmet demand is smaller than the $5.9 billion the FAO estimated in the 2019 spring outlook, primarily due to the introduction of Bill 124.
[39] 2019 Fall Economic Statement, p. 5.
[40] See the Ontario Auditor General’s review of eHealth, the Province’s effort to digitize health records, or the Auditor General of Canada’s report on the Federal government’s attempt to centralize pay services.
[41] The FAO’s upcoming Long-Term Budget Outlook will assess the implications of this question.