


1. Summary
This Economic and Budget Outlook report provides the FAO’s projection of the Ontario government’s fiscal position over the 2022-23 to 2027-28 period. The report also compares the FAO’s budget outlook to the government’s plan presented in the 2023 Ontario Budget from 2022-23 to 2025-26 and describes the FAO’s updated economic outlook. The FAO’s revenue and program spending projections are based on current and announced government policies.
Ontario’s economic growth to slow
Ontario’s economy rebounded rapidly from the pandemic, with real GDP rising by 5.2 per cent in 2021 and 3.7 per cent in 2022. Elevated inflation, high interest rates and a weaker global environment are expected to slow Ontario’s economic growth to 0.8 per cent in 2023, before recovering to average annual growth of 2.0 per cent over the rest of the outlook.
Revenue growth to moderate, while FAO outlook is below the 2023 budget projection
Strong revenue growth of 6.5 per cent is projected in 2022-23, following the exceptional 12.2 per cent increase in 2021-22. Weakening economic activity will moderate revenue growth to 2.0 per cent in 2023-24, before it recovers close to historical average rates over the rest of the outlook. The FAO’s revenue forecast is $3.4 billion lower than the government's outlook in 2022-23, and $4.2 billion lower by 2025-26 due to the FAO’s less optimistic projection of inflation-driven revenue increases in the near term.
Program spending outlook below government forecast
The FAO projects that the Province will spend $183.6 billion on programs in 2022-23, an increase of $13.2 billion (7.7 per cent) from the previous year. From 2022-23 to 2025-26, the government’s spending plan is $5.6 billion higher on average in each year compared to the FAO’s projection. This results in a cumulative $22.6 billion in excess funds that the FAO estimates are not required to support the cost of current programs and announced commitments. The $22.6 billion in excess funds is an increase of $10.8 billion from the FAO’s Winter EBO and reflects new funding added by the Province in the 2023 Ontario Budget.
Going forward, the Province could use the $22.6 billion in excess funds to introduce new programs, enhance existing programs or address spending pressures that could materialize. Alternatively, if the Province decides not to use the $22.6 billion in excess funds, then these funds would be applied to improve the budget balance and reduce the Province’s net debt.
Growing budget surpluses projected over the outlook
The FAO projects a budgetary surplus of $0.5 billion in 2022-23, compared to the 2023 budget’s projected $2.2 billion deficit. Rising budget surpluses are expected over the outlook, as revenue growth exceeds program spending increases. By 2025-26, the FAO projects a $10.6 billion surplus compared to the government’s $4.4 billion surplus.
Budget surpluses would improve Ontario’s fiscal sustainability
If these projected surpluses were used to pay down public debt, Ontario’s debt burden (as measured by the net debt-to-GDP ratio) would decline for an unprecedented seven consecutive years to 31.8 per cent by 2027-28, and the lowest ratio since 2008-09. The interest on debt-to-revenue ratio, a measure of budget flexibility, is projected to decline to a record low of 5.5 per cent by 2027-28, indicating the government will have a larger share of revenues available for program spending.
2. Budget and Debt Outlook
FAO projects growing budget surpluses
Following a budget surplus of $2.1 billion in 2021-22, the FAO projects that Ontario will post a $0.5 billion surplus in 2022-23. The FAO expects improving budget surpluses over the outlook, growing from $3.0 billion in 2023-24 to $16.4 billion in 2027-28, as revenue growth is projected to outpace growth in spending under current government policies and announced commitments.
The FAO’s projection of a budget surplus in 2022-23 contrasts with the government’s $2.2 billion deficit projection in the 2023 Ontario Budget. The FAO’s $2.7 billion higher projected budget balance compared to the government’s is comprised of:
- $5.5 billion lower program spending;
- $3.4 billion lower revenue; and
- $0.5 billion lower debt-interest payments.
By 2025-26, the last year of the 2023 budget outlook, the government projects a $4.4 billion budget surplus. In contrast, the FAO expects Ontario to record a surplus of $10.6 billion.
Figure 2.1 FAO projects growing budget surpluses over the outlook
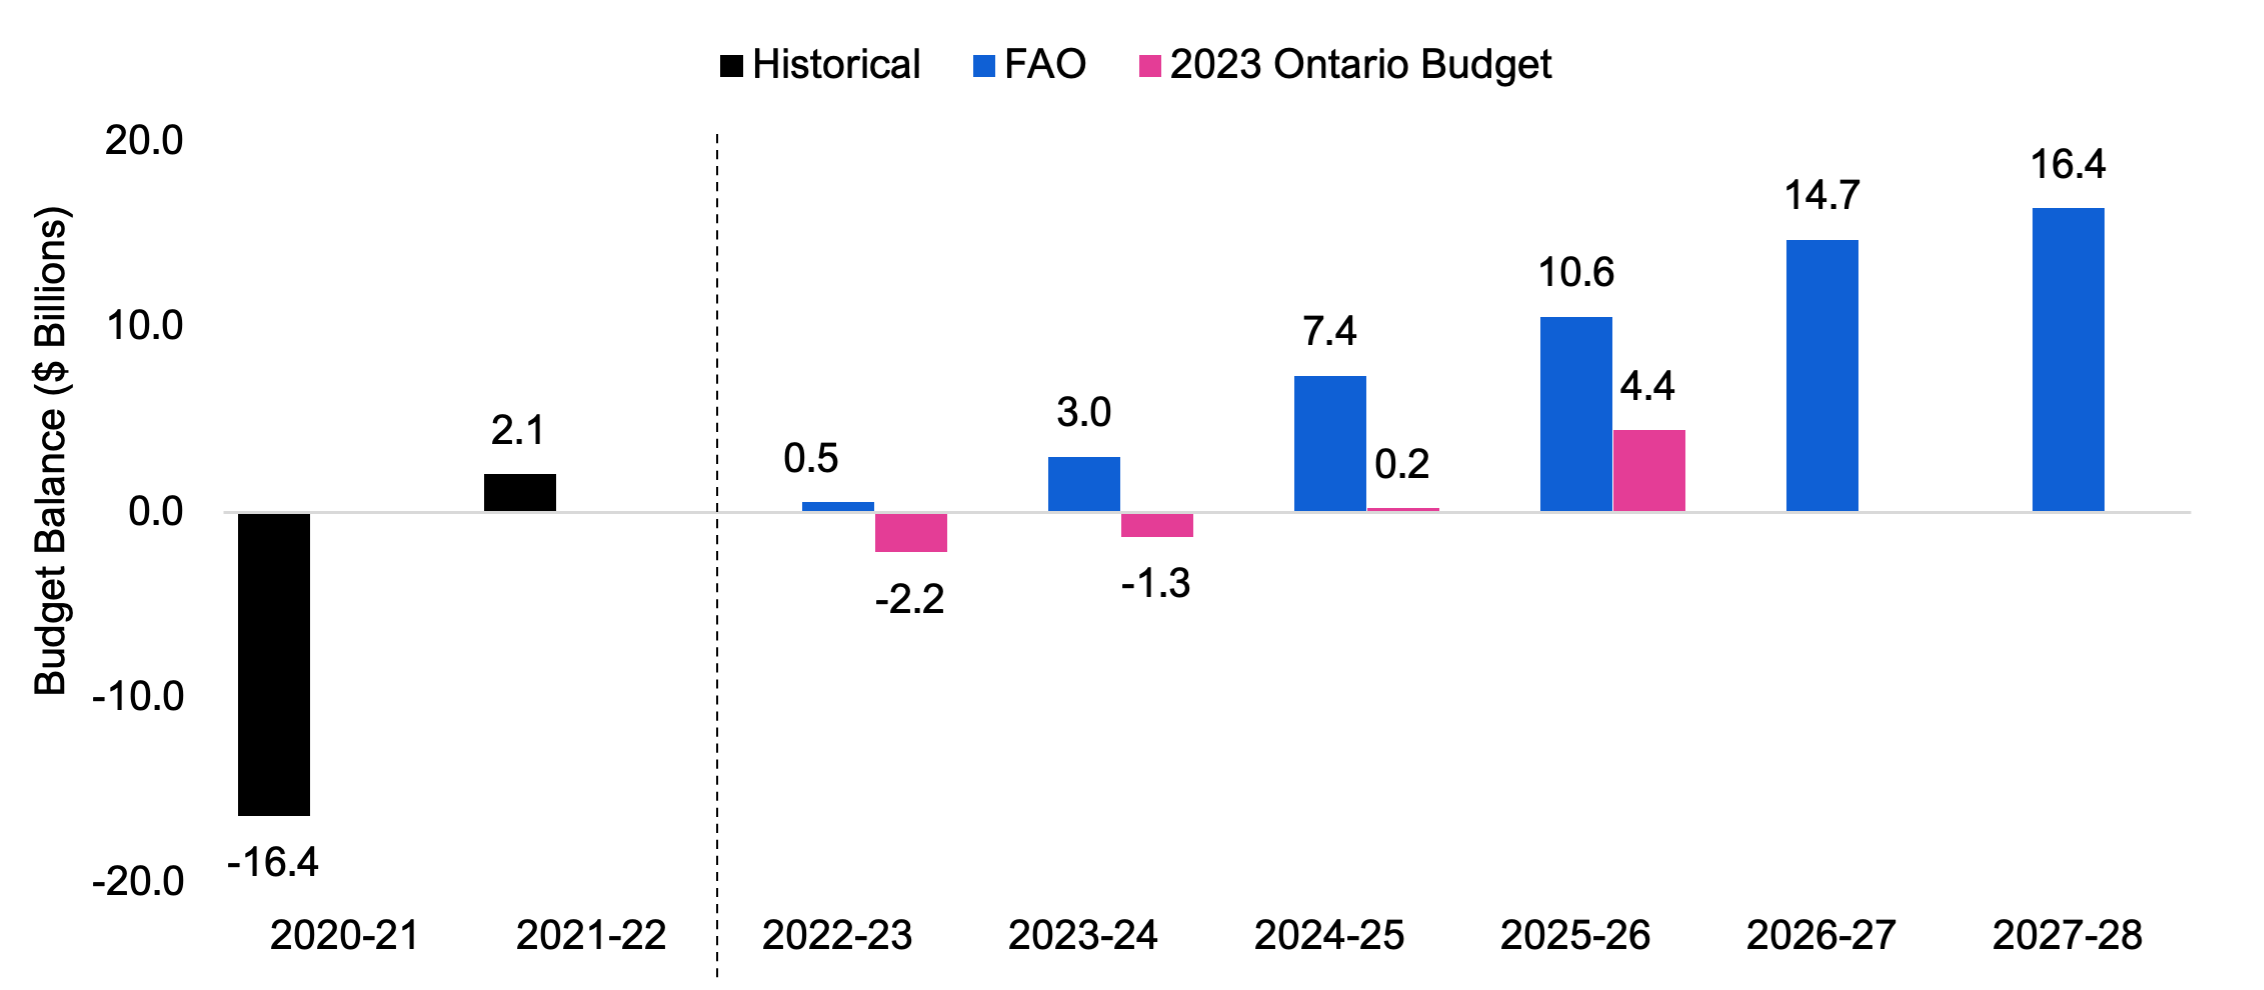
Note: The budget balance from the 2023 Ontario Budget is shown after the reserve.
Source: Ontario Public Accounts, 2023 Ontario Budget and FAO
However, if the government makes future policy announcements, such as new tax cuts, spending initiatives or a combination of both, the FAO’s budget projection would deteriorate. The FAO’s economic and budget outlook also faces significant risks – see Chapter 6 for a discussion.
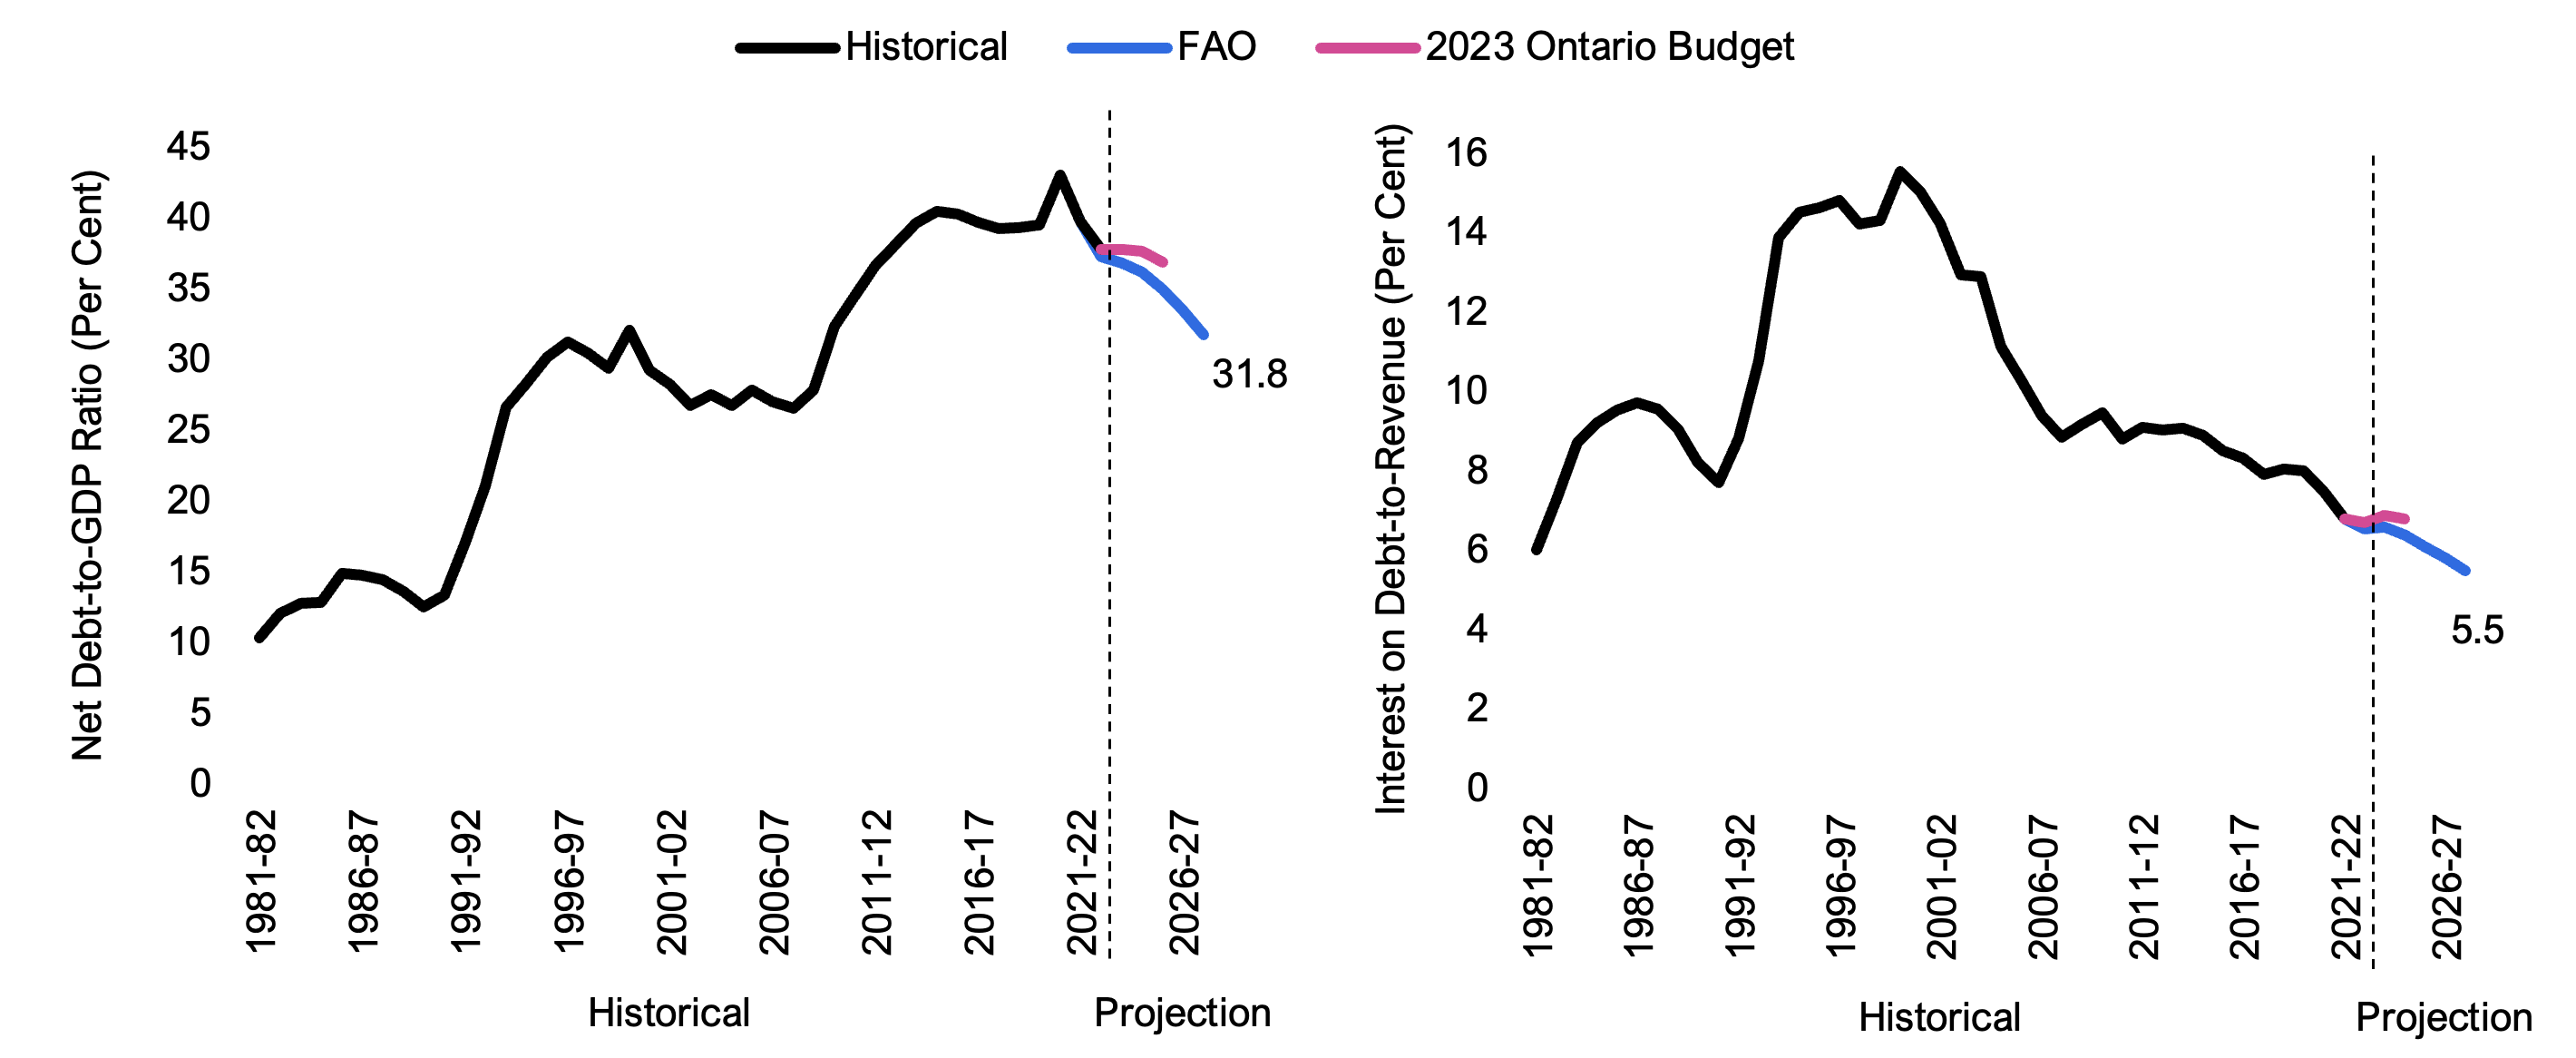
Budget surpluses would improve Ontario’s fiscal sustainability indicators
Net debt as a share of GDP is a fiscal sustainability indicator that provides information on the ability of the government to raise funds to service its debt obligations.[1] The Province’s net debt-to-GDP ratio is projected to decline from 39.8 per cent in 2021-22 to 35.0 per cent in 2025-26, 1.9 percentage points below the government’s projection in the 2023 budget. With the economy expected to grow faster than the increase in debt, the FAO projects the net debt-to-GDP ratio to decline to 31.8 per cent by 2027-28 – the lowest ratio since 2008-09 and well below the government’s target of 40.0 per cent.[2]
The ratio of interest on debt-to-revenue is a fiscal sustainability indicator of budgetary flexibility – a higher ratio indicates that the government has a smaller share of revenue available to spend on key programs such as health care or education. Ontario’s debt interest payments as a share of revenues are projected to decline from 6.8 per cent in 2021-22 to 6.1 per cent in 2025-26, below the government’s projection of 6.7 per cent. By 2027-28, this ratio is projected to fall to 5.5 per cent – the lowest share on record going back to the early 1980s. Despite higher interest rates,[3] the projection for interest on debt as a share of revenues is expected to remain below the government’s target of 7.5 per cent in the medium term.[4]
Figure 2.2 Ontario’s fiscal sustainability indicators to improve and remain below government targets
Source: Ontario Public Accounts, 2023 Ontario Budget and FAO
3. Revenue Outlook
FAO projects weak revenue growth in 2023-24
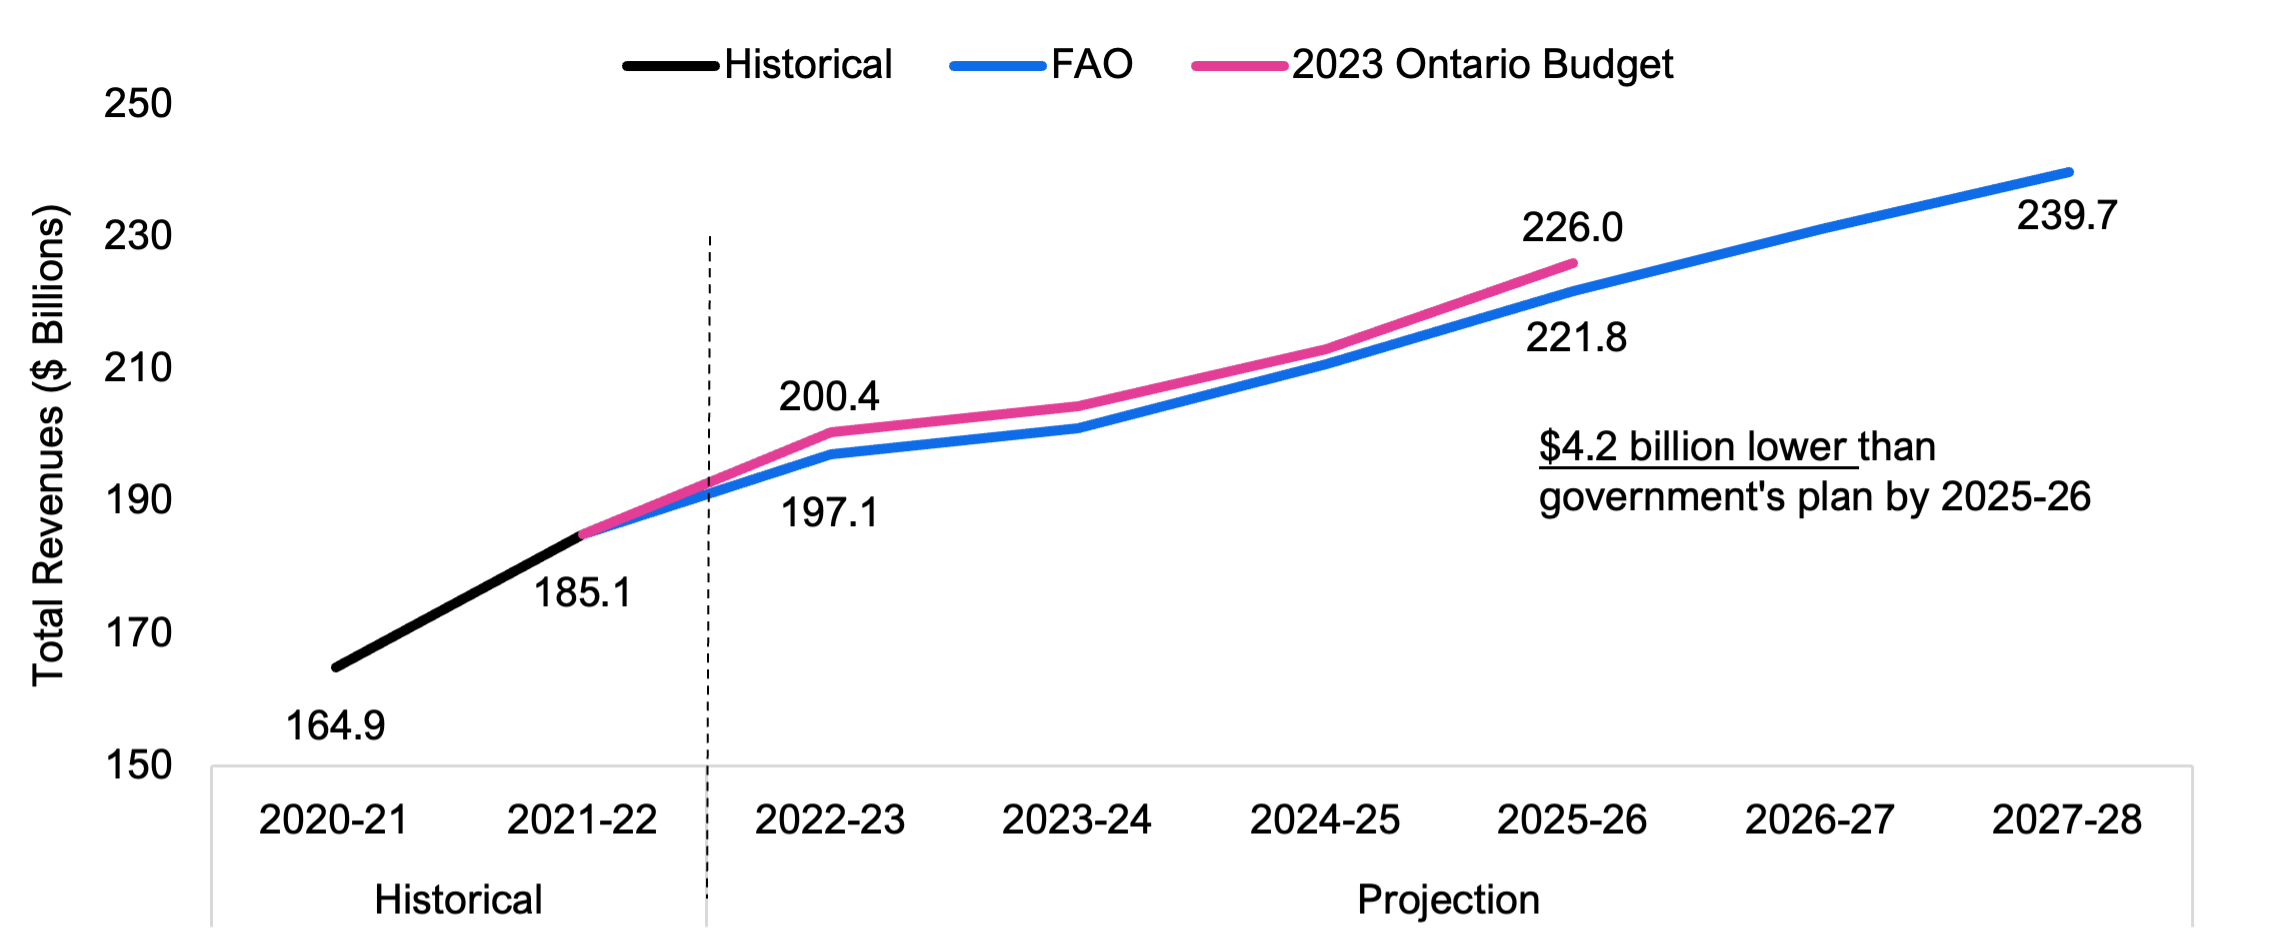
Following a historically strong revenue increase of 12.2 per cent (+$20.2 billion) in 2021-22, total revenue growth is projected to moderate to 6.5 per cent (+$12.0 billion) in 2022-23, easing further to 2.0 per cent (+$4.0 billion) in 2023-24. The slowdown in revenue growth over this period reflects weaker economic growth as labour income gains moderate and corporate profits decline, the loss of one-time revenue, and the impact of previously announced measures.[5] Over the entire outlook, total revenue is projected to grow by an average annual rate of 4.4 per cent as the economy recovers to trend growth in the out-years.[6]
FAO’s revenue projection is lower than the government’s
The FAO’s revenue projection is lower than the 2023 Ontario Budget outlook – $3.4 billion lower in 2022-23 and growing to a gap of $4.2 billion by 2025-26. Tax revenues make up almost all of the difference between the FAO outlook compared to the government’s projection.
Figure 3.1 Revenue growth to moderate after post-pandemic surge
Source: Ontario Public Accounts, 2023 Ontario Budget and FAO
The FAO's lower revenue outlook compared to the government’s is due to different assumptions on how the relationships between tax revenue and economic drivers behave in the current high inflation economic environment. These assumptions largely impact personal income tax and corporations tax revenues.
- Labour income growth is a key driver of personal income tax. While the FAO and government outlooks for labour income are similar in 2022-23, the FAO expects lower growth in personal income tax of 7.7 per cent in that year compared to the government’s 13.0 per cent.
- Similarly, despite having comparable projections for corporate profits in 2022-23, the government expects stronger growth of 10.7 per cent in corporations tax compared to the FAO’s 6.6 per cent.
Figure 3.2 FAO projects a more moderate relationship between tax revenue and economic drivers than the government in 2022-23
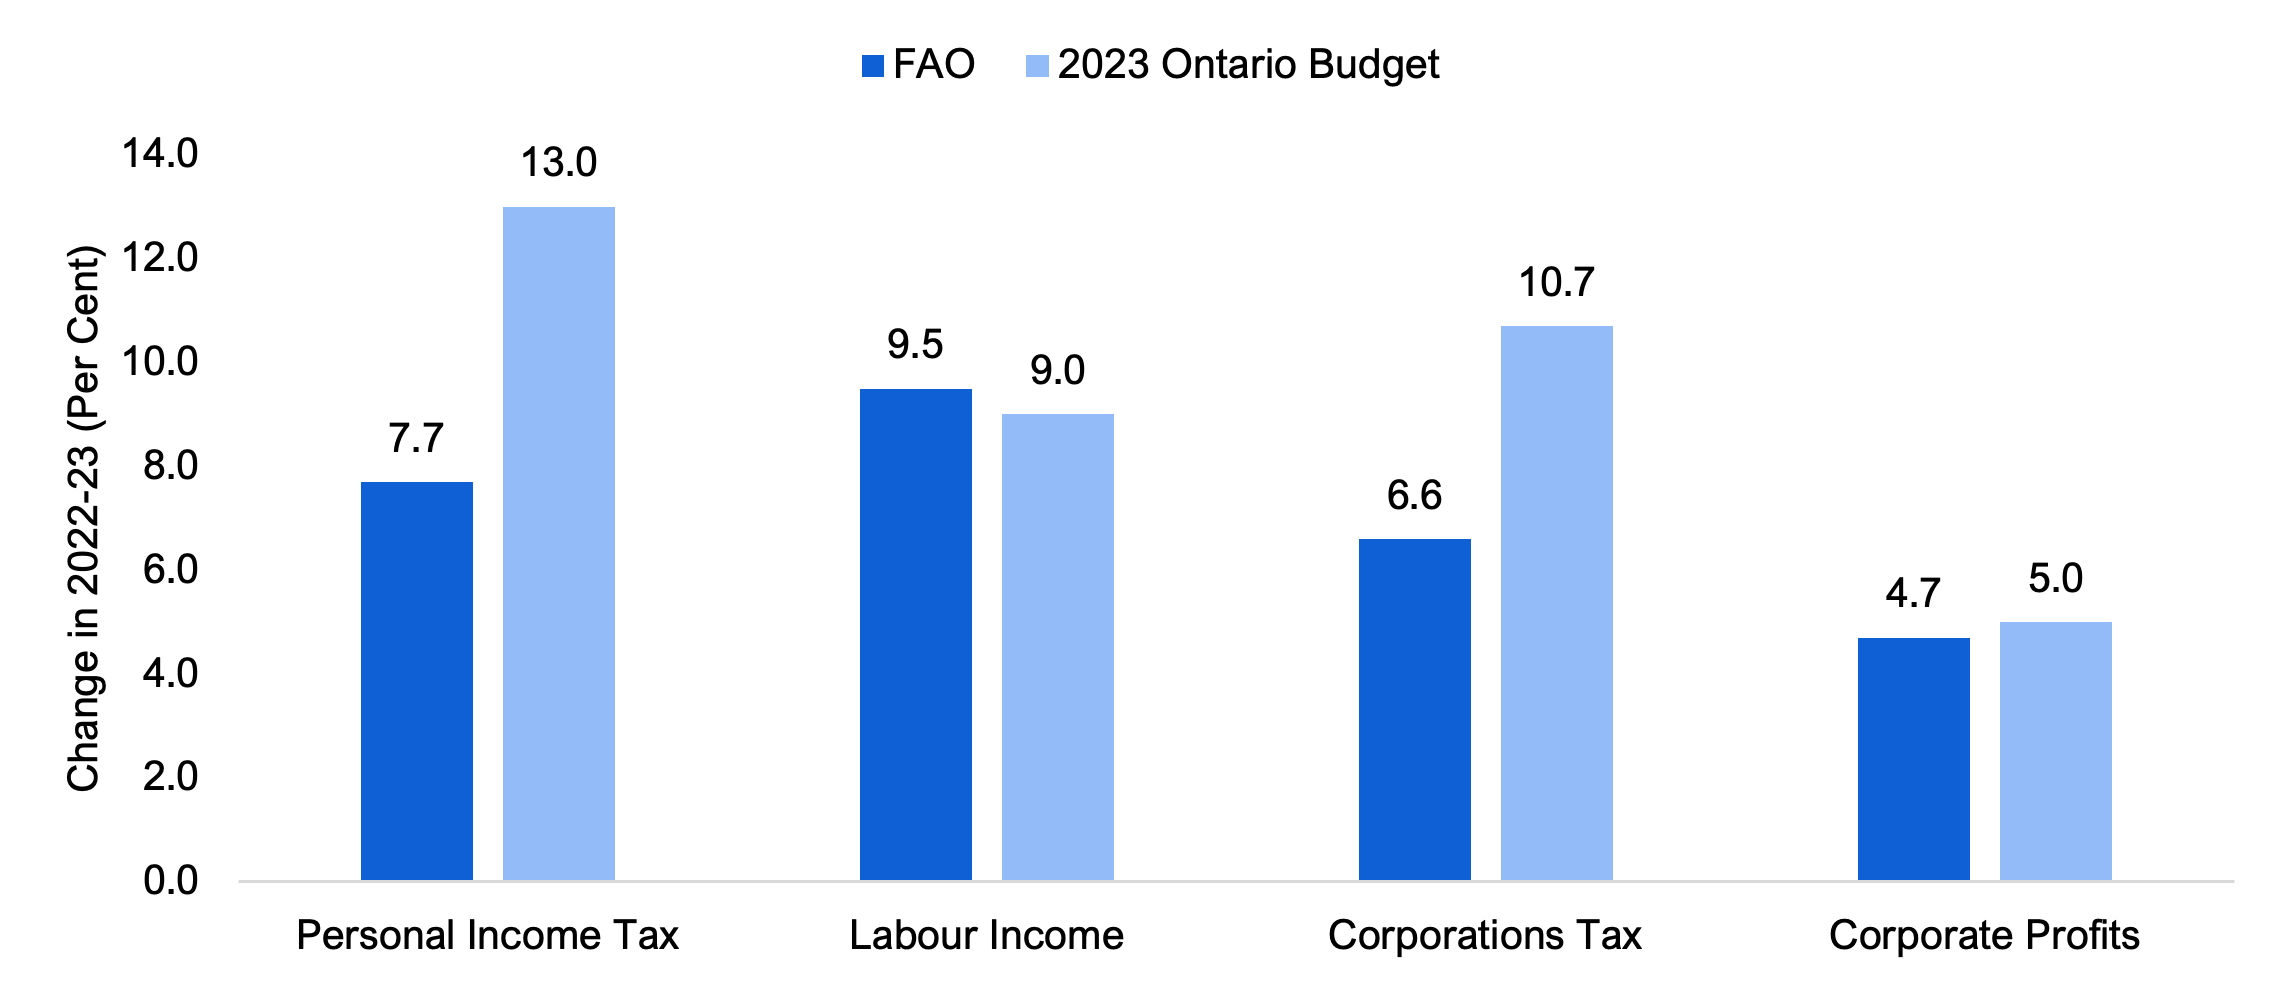
Note: Shows growth in labour income and corporate profits in 2022.
Source: 2023 Ontario Budget, Ontario Economic Accounts and FAO
In the last two fiscal years, revenue growth was stronger than what both the FAO and the government expected.[7] This was driven in part by elevated inflation, which lifted revenues higher than what the underlying economic activity would suggest. The FAO’s current outlook projects that some of this strength will continue into 2022-23, although to a lesser extent than the government’s projection. If the inflationary impact on revenues is stronger than assumed by the FAO in 2022-23, this could boost revenues over the entire outlook. Alternatively, the inflationary impact on revenues could be weaker than expected in 2022-23, lowering the outlook.
4. Program Spending Outlook
FAO’s program spending projection is lower than the government’s
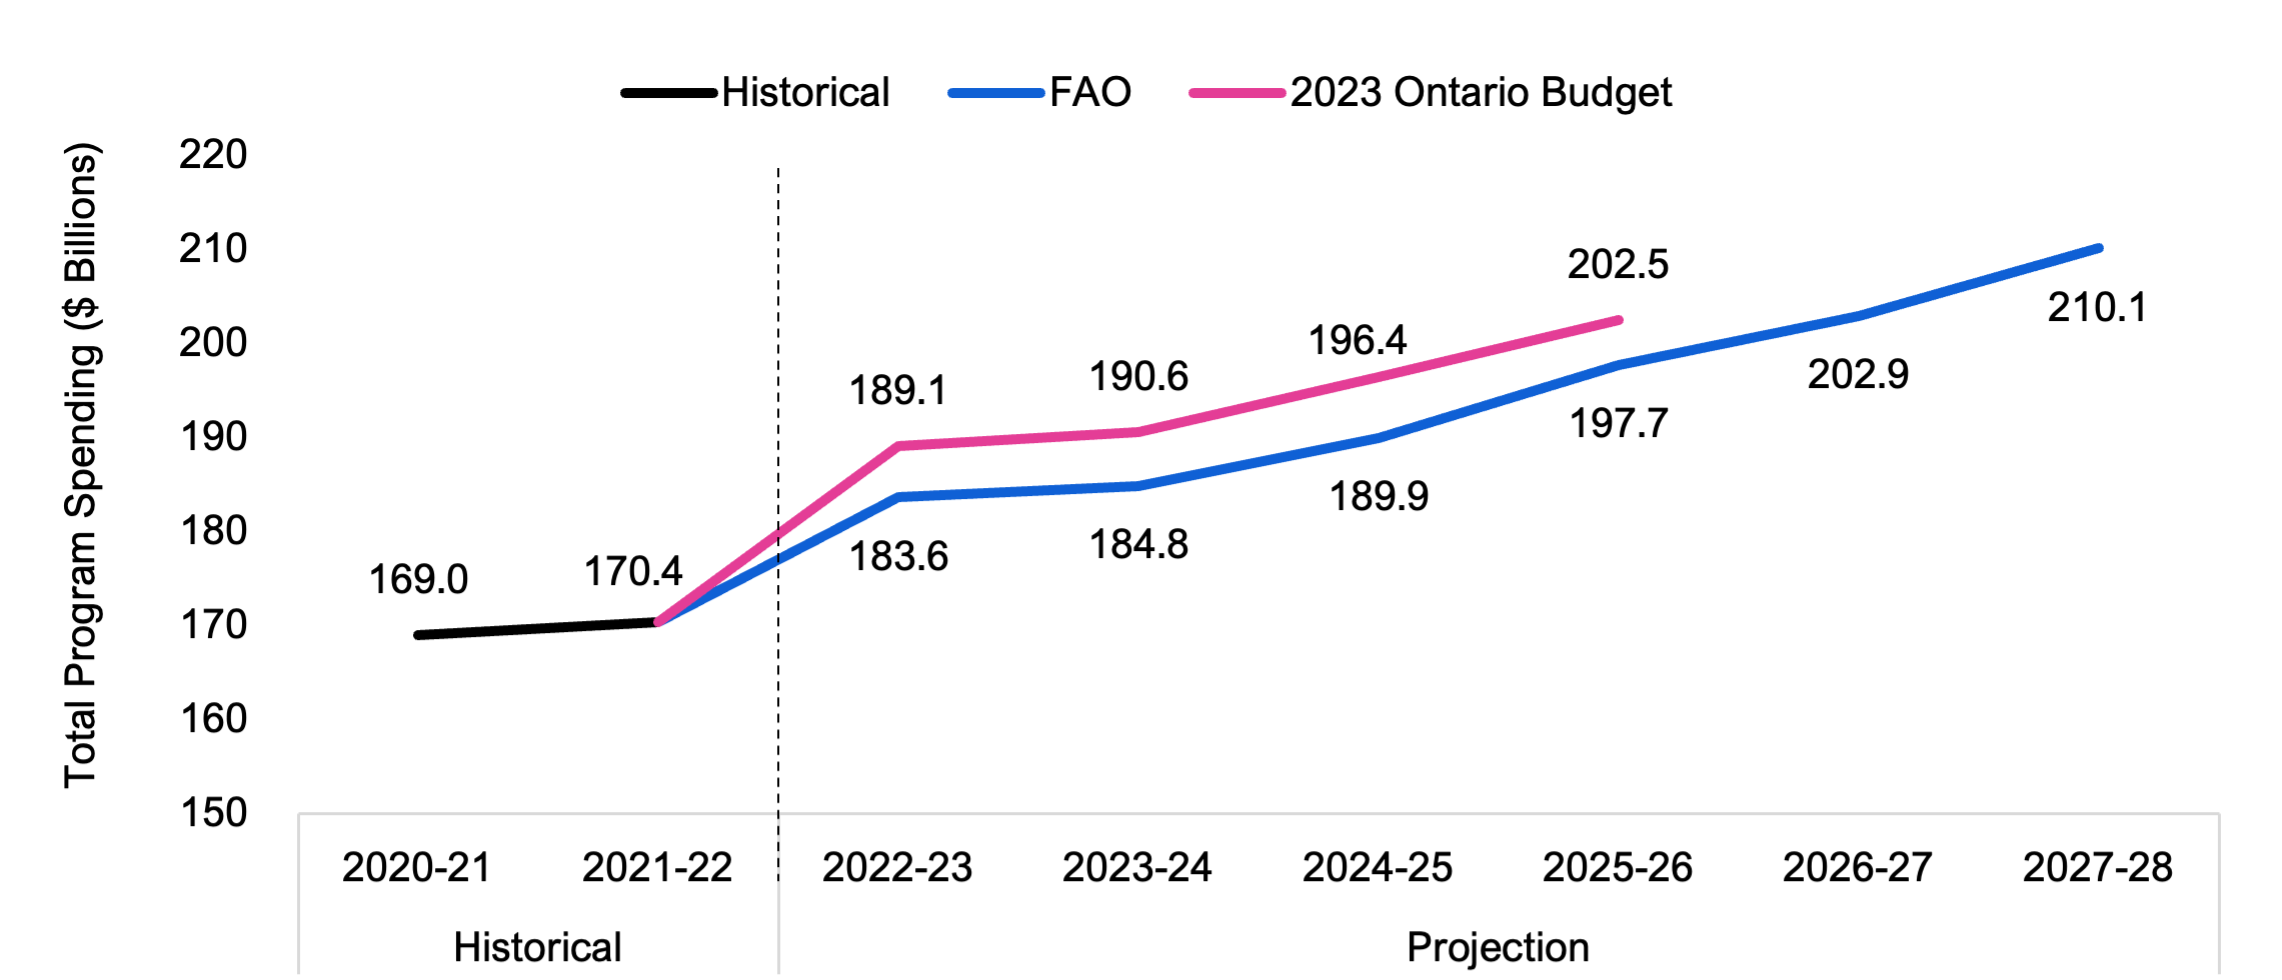
The FAO projects that the Province will spend $183.6 billion on programs in 2022-23, an increase of $13.2 billion (7.7 per cent) from the previous year. By 2027-28, the FAO projects program spending will reach $210.1 billion, with an average annual growth rate of 3.6 per cent over the six-year period from 2021-22.[8]
In contrast, from 2022-23 to 2025-26, the government’s spending plan is $5.6 billion higher on average in each year compared to the FAO’s projection. This results in a cumulative $22.6 billion in excess funds that the FAO estimates are not required to support the cost of current programs and announced commitments.
Going forward, the Province could use the $22.6 billion in excess funds to introduce new programs, enhance existing programs or address spending pressures that could materialize, such as higher than expected wage settlements (see Chapter 6). Alternatively, if the Province decides not to use the $22.6 billion in excess funds, then these funds would be applied to improve the budget balance and reduce the Province’s net debt.
Figure 4.1 FAO’s program spending projection is lower than the government’s through 2025-26
Source: FAO analysis of the 2023 Ontario Budget and information provided by the Ministry of Finance.
Health and ‘other programs’ sectors account for most of the excess funds
By sector, the FAO projects that there are excess funds in health (net $4.4 billion over four years), postsecondary education ($1.1 billion) and ‘other programs’ ($17.9 billion). The significant excess funds in the ‘other programs’ sector is largely due to the contingency fund, which is typically used to fund new programs, enhance existing programs or address spending pressures that materialize.[9] The FAO does not include the government’s contingency fund in its program spending forecast as the purpose of the funds have not yet been announced.
Of the three remaining sectors, the FAO estimates small funding shortfalls in justice (net $0.5 billion over four years), children’s and social services ($0.2 billion) and education ($0.1 billion). These shortfalls mean that the Province has not allocated sufficient funds in these sectors to support the cost of current programs and announced commitments over the four-year period. To address these shortfalls, the Province could use the excess funds identified by the FAO in the other sectors.
| Sector | Program Spending Difference, Province vs. FAO, $ millions | ||||
|---|---|---|---|---|---|
| 2022-23 | 2023-24 | 2024-25 | 2025-26 | Total | |
| Health | 1,304 | 384 | 1,835 | 921 | 4,444 |
| Education | 136 | -216 | 129 | -141 | -92 |
| Postsecondary Education | 233 | 248 | 251 | 321 | 1,052 |
| Children's and Social Services | 278 | 274 | -50 | -685 | -182 |
| Justice | 200 | -204 | -193 | -322 | -519 |
| Other Programs* | 3,370 | 5,323 | 4,525 | 4,654 | 17,872 |
| Total Program Spending Difference | 5,521 | 5,809 | 6,498 | 4,748 | 22,575 |
What has changed since the FAO’s Winter EBO?
The FAO’s estimate that the Province has allocated $22.6 billion in excess funds over four years, from 2022-23 to 2025-26, is an increase of $10.8 billion from the FAO’s excess funds projection in the Winter EBO. The change is due to the Province adding $27.8 billion in new funding to the 2023 Ontario Budget spending plan, of which the FAO estimates that:
- $11.3 billion is for new measures and program changes, including $6.3 billion in one-time expenses in 2022-23,[10] enhanced funding for the Skills Development Fund, changes to the Guaranteed Annual Income System (GAINS) program,[11] funding for the new Ontario Made Manufacturing Investment Tax Credit, and new health sector program changes;[12]
- $5.7 billion is to fund updated estimates for the cost of current programs and announced commitments, largely in the ‘other programs’ and postsecondary education sectors; and
- $10.8 billion is new funding added to the Province’s spending plan that is not required to support the cost of current programs and announced commitments.
5. Economic Outlook
Short-term global economic outlook remains weak
After the global economy grew by 3.4 per cent in 2022, the International Monetary Fund (IMF) projects that growth will slow to 2.8 per cent in 2023.[13] Emerging market and developing economies are projected to maintain a similar pace of growth at 3.9 per cent in 2023 compared to 4.0 per cent in 2022, while advanced economies, especially the United Kingdom and the euro area, will experience a sharp slowdown in economic activity due to further tightening of monetary policy.
Risks to the global economic outlook remain skewed to the downside. Elevated inflation has been slow to decline and will likely stay above the target of most central banks for much of 2023. Higher interest rates have exposed financial vulnerabilities, particularly in some US regional commercial banks, resulting in renewed recession concerns, stricter lending standards, and weaker consumer and business confidence. On the upside, the full reopening of China has begun to boost global trade and labour markets have remained tight in advanced economies, supporting wage growth and household spending. By 2024, a mild recovery in economic activity is expected in most countries and the global economy is projected to grow by an average annual rate of 3.0 per cent over the 2023 to 2028 period, slightly slower than the 3.4 per cent average growth observed after the 2007-08 global financial crisis and before the 2020 pandemic.
Figure 5.1
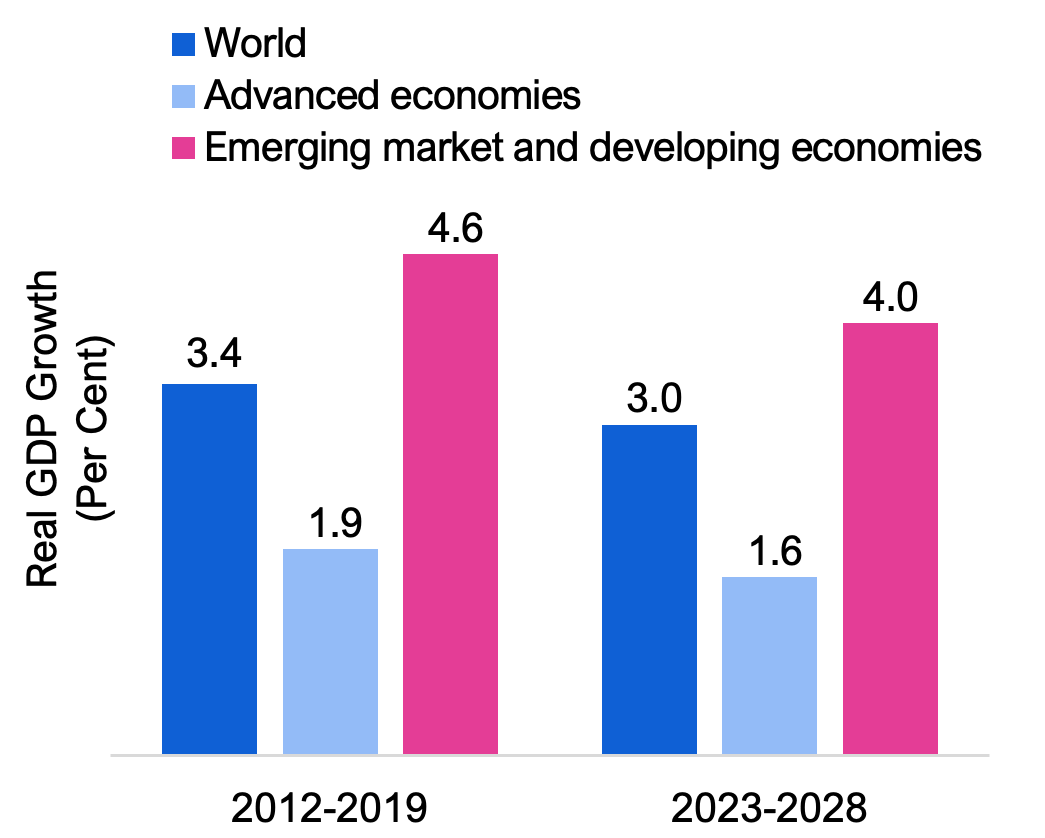
Global economic growth projected to moderate
Source: International Monetary Fund.
Ontario outlook: inflation and economic growth to slow
Since peaking at 7.9 per cent in June 2022, Ontario’s year-over-year inflation rate has fallen to 4.2 per cent in April 2023. Inflation rates in most categories have declined from their peaks in mid-2022, with inflation in goods falling at a faster rate than services. Among the major CPI product groups, inflation in food prices was the highest at 8.0 per cent, followed by health and personal care (6.3 per cent), and alcohol and tobacco (4.8 per cent).[14]
Annual CPI inflation is still expected to remain above historical averages in 2023 at 3.6 per cent and moderate to an average of close to two per cent over the rest of the outlook as the economy fully adjusts to higher interest rates.
Figure 5.2
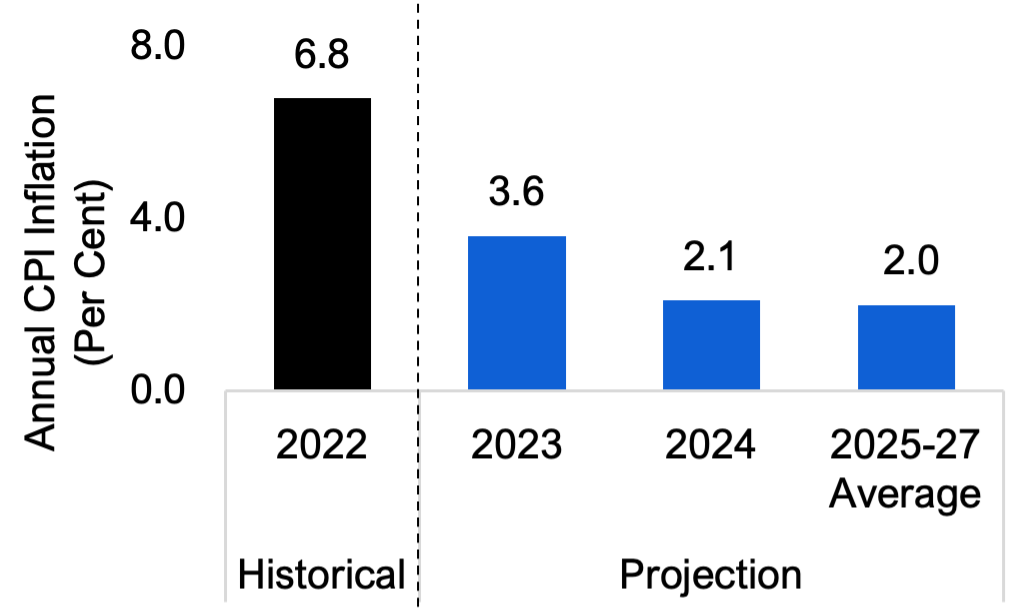
Ontario’s inflation rate projected to moderate gradually over the next two years
Source: Statistics Canada and FAO.
In line with most private sector economists, the FAO projects that short-term interest rates will stay above long-term rates in 2023, which has historically indicated the possibility of weak economic growth. As inflation eases closer to the Bank’s two per cent target, short-term interest rates are projected to fall below long-term rates by 2025.
Ontario’s real GDP growth to slow from historic highs
Ontario’s real GDP advanced by 3.7 per cent in 2022, following 5.2 per cent growth in 2021, marking the strongest two-year increase in more than 20 years. However, the pace of economic growth moderated throughout 2022, as elevated inflation, rising interest rates and the weaker global environment increasingly weighed on household and business sector activity.
Figure 5.3
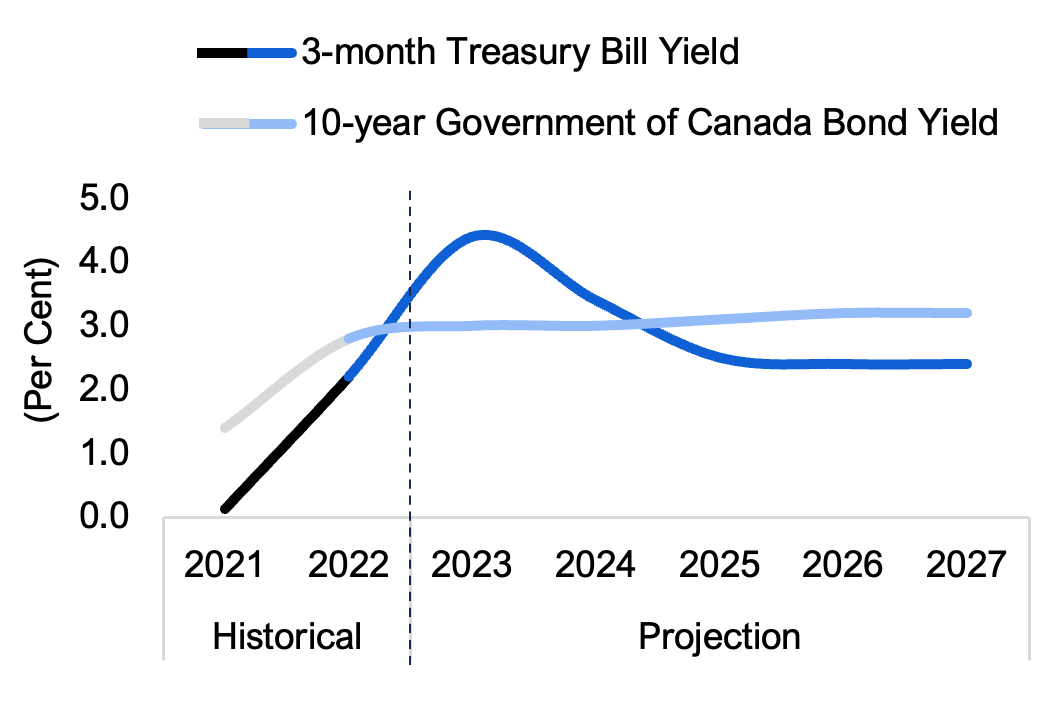
Short-term interest rates to remain high in 2023 and 2024
Source: Statistics Canada and FAO.
The pace of Ontario’s economic growth is projected to slow sharply to 0.8 per cent in 2023, reflecting the impact of higher interest rates on consumer spending and the housing market. Residential investment is projected to decline for the second consecutive year, while high borrowing costs and expectations of weaker sales growth[15] slow business investment.
Economic growth is projected to improve to 1.5 per cent in 2024 and an average of 2.0 per cent over the 2025 to 2027 period as inflation declines and the impact of high interest rates subsides, helping to bolster household spending. Supply chain improvements, new investment in manufacturing plants and recovery in consumer demand in Canada and the United States are expected to support a moderate rebound in Ontario’s exports. However, certain risks to the outlook could result in a slower pace of economic growth – see discussion in Chapter 6.
Figure 5.4
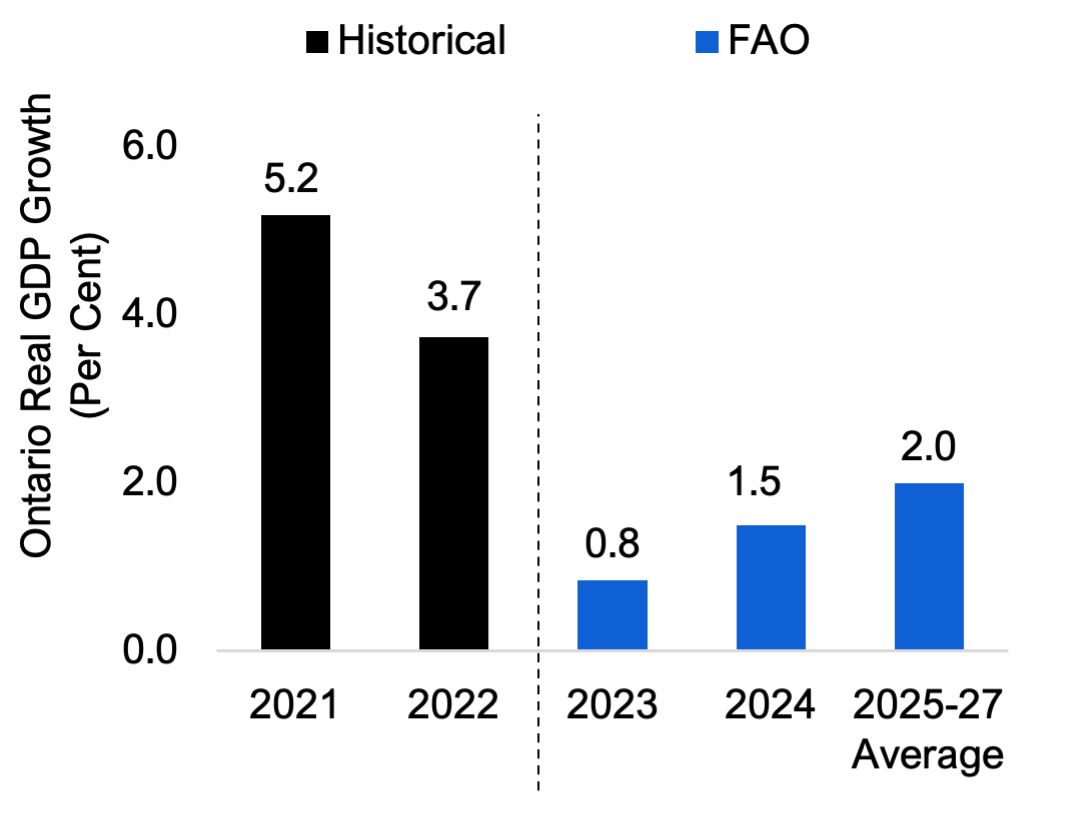
Ontario’s economic growth to slow in 2023
Source: Ontario Economic Accounts and FAO.
Ontario’s job market expected to slow
Ontario's strong post-pandemic job creation continued in 2022, with employment increasing by 338,300 jobs (or 4.6 per cent). Combined with the robust rise in 2021, this was the strongest two-year period of job gains on record.[16] The annual unemployment rate in the province dropped to 5.6 per cent in 2022, the same as the pre-pandemic rate observed in 2019.
Ontario’s labour market performance remained strong in early 2023, with April recording the seventh consecutive month of job growth and the unemployment rate falling to 4.9 per cent.
Over the rest of the year, job vacancies are expected to continue to decline, and the annual unemployment rate is projected to increase slightly to an average of 5.7 per cent in 2023. In 2024, the unemployment rate is projected to rise to 6.3 per cent as strong labour force growth outpaces job gains. The unemployment rate is projected to average 6.1 per cent over the remainder of the outlook.
Figure 5.5
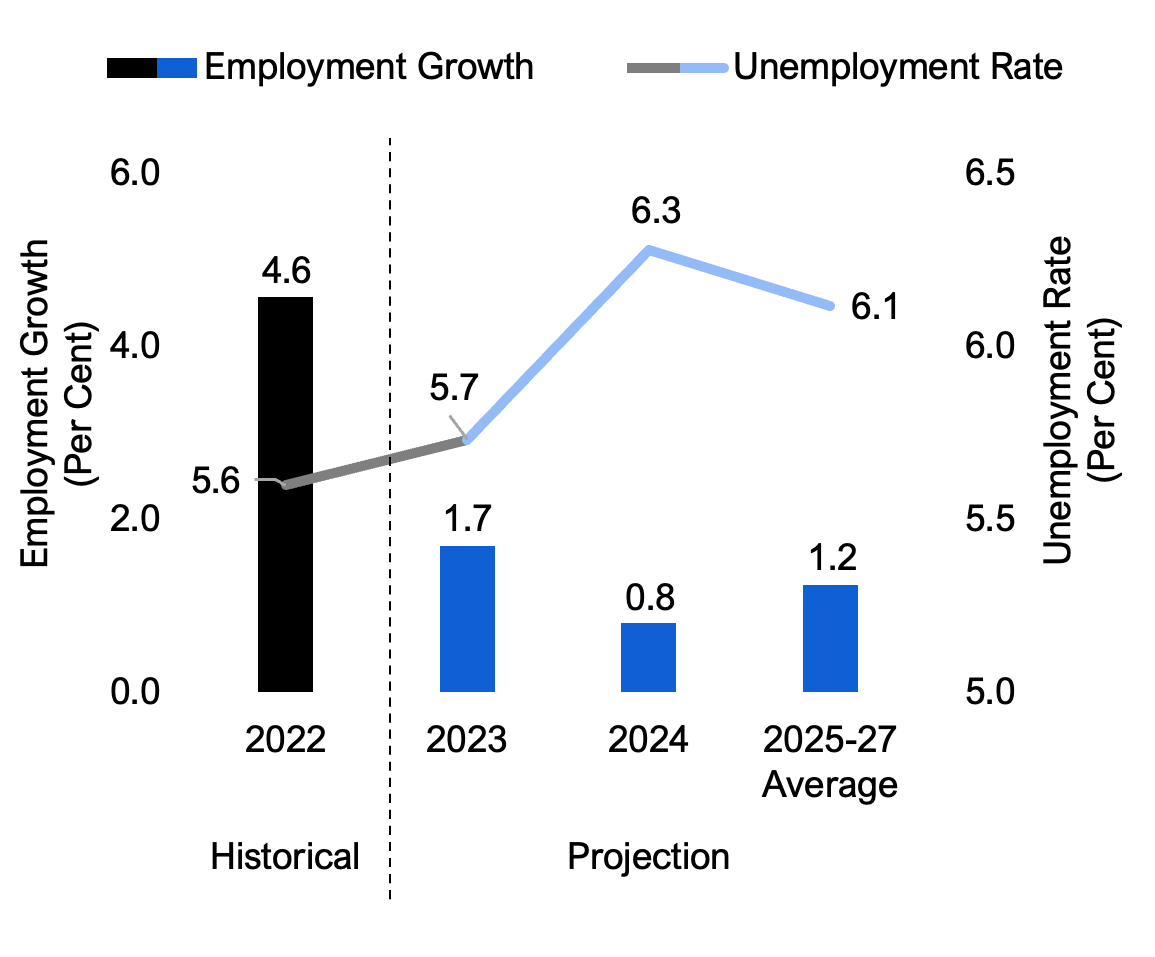
Unemployment rate expected to rise in 2024
Source: Statistics Canada and FAO.
Ontario’s nominal GDP growth to moderate
Following two years of exceptional gains, Ontario’s nominal GDP growth is projected to moderate to 3.1 per cent in 2023. Labour income growth is expected to soften as employers cut back on hiring and wage expense, while corporate profits are projected to decline as businesses face weaker sales growth and high interest on debt.
Nominal GDP growth is expected to improve to 3.5 per cent in 2024 and recover to an average annual rate of 4.0 per cent over the 2025-to-2027 period.
Figure 5.6
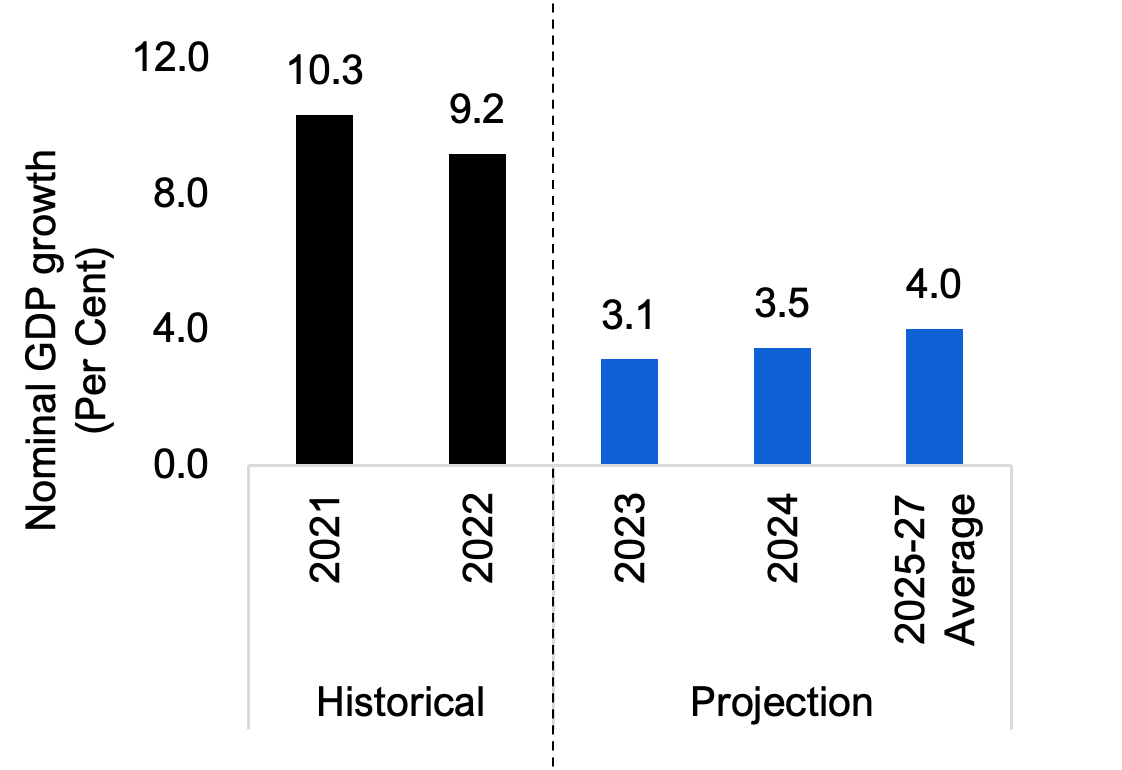
Ontario’s nominal GDP growth to moderate in 2023 and 2024
Source: Ontario Economic Accounts and FAO.
6. Risks to the Economic and Budget Outlook
Economic and budget uncertainties
Ontario’s economic growth was resilient in 2022, but numerous domestic and global factors pose both downside and upside risks to the FAO’s economic outlook.
- Inflation could prove more persistent than expected, prompting further interest rate increases from the Bank of Canada. Higher borrowing costs are adding financial stress to households, with one-third of mortgages facing higher payments as of May 2023 compared to February 2022.[17] Additional interest rate increases could cause the slowdown in Ontario’s economic outlook to last longer than anticipated and put further pressure on the housing market and household spending.
- Economic growth in the United States has moderated amid the debt-ceiling deliberations and recent turbulence in the financial sector. The Federal Reserve has also taken a more aggressive stance against inflation than the Bank of Canada, raising the Federal Funds Rate by an additional 75 basis points in 2023 to the 5.00-5.25 per cent range. If the US economy experiences a recession, this would create a setback to Ontario’s exports of intermediate and manufactured goods.
- Russia’s war in Ukraine has been protracted, with mounting fiscal costs, geopolitical tensions, and impacts on global energy prices and inflation. This continues to overshadow the recovery in global trade and international investment.
- On the upside, resilience in Ontario’s consumer spending and the tight labour market could last longer than expected, improving Ontario’s economic outlook from the sharp slowdown projected in 2023. Several economic indicators improved in the first quarter of 2023 and the housing market has stabilized for the past few months after declining for most of 2022. In addition, Ontario’s population growth has exceeded expectations, with the first quarter of 2023 marking the fastest year-over-year growth since 1972.[18] If these conditions persist, economic and revenue growth could outpace the FAO’s projection.
Ontario’s budget outlook is subject to the same risks affecting the economic outlook, in addition to various other uncertainties. The following notable risks to the budget outlook could result in a material change to the FAO’s forecast:
- High inflation could place significant upward pressure on public sector wages. For example, over 60,000 education workers recently signed collective agreements that provided average annual wage increases of 4.5 per cent over four years.[19]
- The legal challenge to Bill 124.[20] On November 29, 2022, the Ontario Superior Court of Justice ruled that Bill 124, which limits base salary increases for most provincial employees to one per cent per year for a period of three years, was in violation of the Canadian Charter of Rights and Freedoms and was declared to be void and of no effect. While the government has appealed this decision, some public sector employees have already been awarded retroactive compensation. For example, an arbitration decision recently awarded Ontario Nurses’ Association members in hospitals additional wage increases of 0.75 per cent in 2020, 1.0 per cent in 2021 and 2.0 per cent in 2022. The FAO’s program spending forecast includes the impact of publicly announced retroactive compensation decisions; however, any new retroactive compensation decisions would increase the FAO’s program spending forecast.
- Any new announcements to revenue or spending programs would change the FAO’s budget outlook.
Budget sensitivities
To illustrate the impact of potential policy changes on Ontario’s fiscal projection, the FAO estimated the sensitivity of key budget indicators to changes in three main policy areas: tax revenues, federal transfers, and program expenditures. For each policy item, Table 6.1 provides an estimate of the 2023-24 and 2027-28 change in the budget balance, the total change in net debt by 2027-28, and the change in the net debt-to-GDP ratio in 2027-28.
| Change in budget balance in: | Change in Net Debt by 2027-28 | Change in Net Debt-to-GDP Ratio by 2027-28 | ||
|---|---|---|---|---|
| 2023–24 | 2027–28 | |||
| Tax Policy* | ||||
| Increasing/decreasing annual income taxes payable by $500 for the average taxpayer | +/-$4.7 billion | +/-$6.4 billion | +/-$27.7 billion | +/- 2.2 ppt |
| A one percentage point increase/decrease to the 11.5 per cent provincial corporate tax rate | +/-$2.2 billion | +/-$3.0 billion | +/-$12.9 billion | +/- 1.0 ppt |
| A one percentage point increase/decrease to the 8 per cent provincial HST rate | +/-$4.6 billion | +/-$6.1 billion | +/-$26.6 billion | +/- 2.1 ppt |
| Federal Transfers | ||||
| A sustained one percentage point increase/decrease in the growth rate of the Canada Health Transfer | +/-$0.2 billion | +/-$1.2 billion | +/-$ 3.4 billion | +/- 0.3 ppt |
| A sustained one percentage point increase/decrease in the growth rate of the Canada Social Transfer | +/-$0.1 billion | +/-$0.4 billion | +/-$1.1 billion | +/- 0.1ppt |
| A $1 billion increase/decrease in federal transfers ** | +/-$1.0 billion | +/-$1.2 billion | +/-$5.6 billion | +/- 0.5 ppt |
| Program Spending | ||||
| A permanent $1 billion program spending change ** | +/-$1.0 billion | +/-$1.2 billion | +/-$5.6 billion | +/- 0.5 ppt |
| A sustained one percentage point change in the growth rate of health sector spending over the projection | +/-$0.8 billion | +/-$5.1 billion | +/-$14.1 billion | +/- 1.1 ppt |
| A sustained one percentage point change in the growth rate of education sector spending over the projection | +/-$0.4 billion | +/-$2.2 billion | +/-$6.3 billion | +/- 0.5 ppt |
| A sustained one percentage point change in Ontario public sector salaries and wages over the projection | +/-$0.5 billion | +/-$3.2 billion | +/-$9.0 billion | +/- 0.7 ppt |
7. Appendix
| (Per Cent Growth) | 2021a | 2022a | 2023f | 2024f | 2025f-2027f Average* |
|---|---|---|---|---|---|
| Nominal GDP | |||||
| FAO | 10.3 | 9.2 | 3.1 | 3.5 | 4.0 |
| 2023 Ontario Budget** | 10.3 | 9.4 | 2.8 | 3.6 | 4.6 |
| Labour Income | |||||
| FAO | 9.2 | 9.5 | 5.0 | 4.0 | 3.9 |
| 2023 Ontario Budget** | 9.2 | 9.0 | 5.1 | 4.2 | 4.4 |
| Corporate Profits | |||||
| FAO | 13.7 | 4.7 | -8.1 | 2.3 | 5.5 |
| 2023 Ontario Budget** | 13.7 | 5.0 | -8.2 | -0.5 | 9.2 |
| Household Consumption | |||||
| FAO | 7.3 | 12.6 | 5.3 | 4.4 | 4.0 |
| 2023 Ontario Budget | 7.3 | 12.6 | 5.1 | 4.1 | 4.3 |
| 2021a | 2022a | 2023f | 2024f | 2025f-2027f Average* | |
|---|---|---|---|---|---|
| Real GDP (Per Cent Growth) | |||||
| FAO | 5.2 | 3.7 | 0.8 | 1.5 | 2.0 |
| 2023 Ontario Budget** | 5.2 | 3.7 | 0.2 | 1.3 | 2.5 |
| Employment (Per Cent Growth) | |||||
| FAO | 5.2 | 4.6 | 1.7 | 0.8 | 1.2 |
| 2023 Ontario Budget | 5.2 | 4.6 | 0.5 | 1.0 | 1.7 |
| Unemployment Rate (Per Cent) | |||||
| FAO | 8.1 | 5.6 | 5.7 | 6.3 | 6.1 |
| 2023 Ontario Budget | 8.1 | 5.6 | 6.4 | 6.6 | 6.3 |
| CPI Inflation (Per Cent) | |||||
| FAO | 3.5 | 6.8 | 3.6 | 2.1 | 2.0 |
| 2023 Ontario Budget | 3.5 | 6.8 | 3.6 | 2.1 | 2.0 |
| 3-month Treasury Bill Rate (Per Cent) | |||||
| FAO | 0.1 | 2.3 | 4.4 | 3.4 | 2.4 |
| 2023 Ontario Budget | 0.1 | 2.3 | 4.3 | 3.3 | 2.5 |
| 10-year Government Bond Rate (Per Cent) | |||||
| FAO | 1.4 | 2.8 | 3.0 | 3.0 | 3.2 |
| 2023 Ontario Budget | 1.4 | 2.8 | 3.1 | 3.1 | 3.2 |
| ($ Billions) | 2020-21a | 2021-22a | 2022-23f | 2023-24f | 2024-25f | 2025-26f | 2026-27f | 2027-28f |
|---|---|---|---|---|---|---|---|---|
| Revenue | ||||||||
| Personal Income Tax | 40.3 | 46.8 | 50.3 | 54.0 | 56.6 | 59.3 | 61.8 | 64.3 |
| Annual Growth (Per Cent) | 6.9 | 15.9 | 7.7 | 7.4 | 4.7 | 4.7 | 4.3 | 4.1 |
| Sales Tax | 26.6 | 30.4 | 35.8 | 35.1 | 36.7 | 38.2 | 39.7 | 41.2 |
| Annual Growth (Per Cent) | -7.1 | 14.2 | 17.8 | -1.9 | 4.6 | 4.0 | 4.0 | 3.8 |
| Corporations Tax | 17.8 | 25.2 | 26.9 | 23.9 | 25.2 | 26.8 | 28.0 | 28.9 |
| Annual Growth (Per Cent) | 15.3 | 41.9 | 6.6 | -11.3 | 5.5 | 6.4 | 4.4 | 3.3 |
| All Other Taxes | 26.2 | 29.3 | 28.5 | 28.5 | 30.9 | 32.0 | 33.1 | 34.1 |
| Annual Growth (Per Cent) | -1.1 | 12.0 | -2.9 | -0.1 | 8.7 | 3.3 | 3.4 | 3.3 |
| Total Taxation Revenue | 110.9 | 131.7 | 141.5 | 141.4 | 149.4 | 156.2 | 162.5 | 168.6 |
| Annual Growth (Per Cent) | 2.4 | 18.8 | 7.5 | -0.0 | 5.6 | 4.5 | 4.1 | 3.7 |
| Transfers from Government of Canada | 33.9 | 30.6 | 31.1 | 34.3 | 35.5 | 37.1 | 39.0 | 40.6 |
| Annual Growth (Per Cent) | 33.6 | -9.8 | 1.6 | 10.4 | 3.3 | 4.7 | 5.0 | 4.0 |
| Income from Government Business Enterprise | 5.0 | 6.4 | 6.5 | 6.3 | 6.7 | 8.5 | 8.8 | 9.2 |
| Annual Growth (Per Cent) | -15.1 | 28.6 | 0.9 | -2.6 | 5.1 | 27.8 | 4.0 | 3.7 |
| Other Non-Tax Revenue | 15.1 | 16.3 | 18.0 | 19.0 | 19.2 | 20.0 | 20.7 | 21.4 |
| Annual Growth (Per Cent) | -8.8 | 8.4 | 10.0 | 5.5 | 1.4 | 3.9 | 3.7 | 3.4 |
| Total Revenue | 164.9 | 185.1 | 197.1 | 201.1 | 210.7 | 221.8 | 231.1 | 239.7 |
| Annual Growth (Per Cent) | 5.6 | 12.2 | 6.5 | 2.0 | 4.8 | 5.2 | 4.2 | 3.7 |
| Expense | ||||||||
| Health Sector | 69.5 | 75.7 | 78.5 | 80.6 | 82.4 | 86.7 | 90.5 | 95.1 |
| Annual Growth (Per Cent) | 9.0 | 9.0 | 3.6 | 2.7 | 2.2 | 5.2 | 4.4 | 5.1 |
| Education Sector* | 32.9 | 31.5 | 34.9 | 36.6 | 37.7 | 39.5 | 40.9 | 41.7 |
| Annual Growth (Per Cent) | 3.6 | -4.2 | 10.7 | 5.0 | 3.0 | 4.6 | 3.5 | 2.1 |
| Children's and Social Services Sector | 17.4 | 17.1 | 18.1 | 19.1 | 19.9 | 20.6 | 21.2 | 21.9 |
| Annual Growth (Per Cent) | 2.4 | -2.1 | 6.2 | 5.3 | 4.2 | 3.6 | 3.1 | 3.2 |
| Postsecondary Education Sector | 9.8 | 10.6 | 11.1 | 11.9 | 12.2 | 12.6 | 13.0 | 13.4 |
| Annual Growth (Per Cent) | -6.6 | 8.0 | 4.7 | 6.8 | 2.9 | 3.2 | 3.0 | 3.2 |
| Justice Sector | 4.8 | 4.9 | 5.3 | 5.6 | 5.6 | 5.6 | 5.8 | 5.9 |
| Annual Growth (Per Cent) | 2.8 | 4.1 | 7.2 | 4.8 | 0.3 | 0.0 | 3.9 | 1.5 |
| Other Programs* | 34.6 | 30.6 | 35.7 | 31.0 | 32.1 | 32.8 | 31.6 | 32.1 |
| Annual Growth (Per Cent) | 40.6 | -11.8 | 16.8 | -13.1 | 3.5 | 2.1 | -3.8 | 1.9 |
| Total Program Expense | 169.0 | 170.4 | 183.6 | 184.8 | 189.9 | 197.7 | 202.9 | 210.1 |
| Annual Growth (Per Cent) | 11.0 | 0.8 | 7.7 | 0.6 | 2.8 | 4.1 | 2.6 | 3.5 |
| Interest on Debt | 12.3 | 12.6 | 12.9 | 13.3 | 13.4 | 13.5 | 13.4 | 13.2 |
| Annual Growth (Per Cent) | -1.7 | 2.3 | 2.6 | 2.7 | 1.4 | 0.4 | -0.6 | -1.8 |
| Total Expense | 181.3 | 183.0 | 196.5 | 198.1 | 203.4 | 211.2 | 216.3 | 223.3 |
| Annual Growth (Per Cent) | 10.0 | 0.9 | 7.4 | 0.8 | 2.7 | 3.9 | 2.4 | 3.2 |
| Budget Balance | -16.4 | 2.1 | 0.5 | 3.0 | 7.4 | 10.6 | 14.7 | 16.4 |
| ($ Billions) | 2020–21a | 2021–22a | 2022–23f | 2023–24f | 2024-25f | 2025-26f | 2026-27f | 2027-28f |
|---|---|---|---|---|---|---|---|---|
| Budget Balance | -16.4 | 2.1 | 0.5 | 3.0 | 7.4 | 10.6 | 14.7 | 16.4 |
| Accumulated Deficit | 239.3 | 236.9 | 236.3 | 233.3 | 225.9 | 215.4 | 200.7 | 184.2 |
| Net Debt | 373.6 | 380.4 | 389.3 | 396.3 | 403.0 | 406.5 | 404.6 | 398.5 |
| Net Debt-to-GDP (Per Cent) | 43.1 | 39.8 | 37.3 | 36.8 | 36.2 | 35.0 | 33.4 | 31.8 |
| FAO Revenue Projection Changes, $ billions | ||||||
|---|---|---|---|---|---|---|
| 2022-23 | 2023-24 | 2024-25 | 2025-26 | 2026-27 | Total | |
| Winter EBO | 188.5 | 194.7 | 204.8 | 212.5 | 221.0 | - |
| New Government Measures | 0.0 | 0.1 | 0.0 | 0.0 | 0.0 | 0.2 |
| Forecast Updates | 8.5 | 6.3 | 5.9 | 9.3 | 10.0 | 40.1 |
| Total Changes | 8.5 | 6.4 | 6.0 | 9.3 | 10.1 | 40.2 |
| Spring EBO | 197.1 | 201.1 | 210.7 | 221.8 | 231.1 | - |
| FAO Program Spending Projection Changes, $ billions | ||||||
|---|---|---|---|---|---|---|
| 2022-23 | 2023-24 | 2024-25 | 2025-26 | 2026-27 | Total | |
| Winter EBO | 178.3 | 180.5 | 187.1 | 193.3 | 199.4 | - |
| New Government Measures | 6.5 | 2.0 | 1.3 | 1.5 | 1.3 | 12.6 |
| Forecast Updates | -1.2 | 2.3 | 1.6 | 3.0 | 2.2 | 7.9 |
| Total Changes | 5.3 | 4.3 | 2.9 | 4.4 | 3.5 | 20.5 |
| Spring EBO | 183.6 | 184.8 | 189.9 | 197.7 | 202.9 | - |
About this document
Established by the Financial Accountability Officer Act, 2013, the Financial Accountability Office (FAO) provides independent analysis on the state of the Province’s finances, trends in the provincial economy and related matters important to the Legislative Assembly of Ontario.
This report was prepared by Zohra Jamasi, Jay Park, Nicolas Rhodes and Matthew Stephenson, under the direction of Paul Lewis, Edward Crummey and Luan Ngo. Ben Segel-Brown, Michelle Gordon, Matthew Gurnham and Ava Rahbari contributed to this report.
The content of this report is based on information available to May 19, 2023. Background data used in this report are available upon request.
In keeping with the FAO’s mandate to provide the Legislative Assembly of Ontario with independent economic and financial analysis, this report makes no policy recommendations.
Graphical Descriptions
| Budget Balance ($ Billions) | |||
|---|---|---|---|
| Historical | FAO | 2023 Ontario Budget | |
| 2020-21 | -16.4 | ||
| 2021-22 | 2.1 | ||
| 2022-23 | 0.5 | -2.2 | |
| 2023-24 | 3.0 | -1.3 | |
| 2024-25 | 7.4 | 0.2 | |
| 2025-26 | 10.6 | 4.4 | |
| 2026-27 | 14.7 | - | |
| 2027-28 | 16.4 | - | |
| Net Debt-to-GDP Ratio (Per Cent) | Historical | FAO | 2023 Ontario Budget | |
|---|---|---|---|---|
| Historical | 1981-82 | 10.4 | ||
| 1982-83 | 12.1 | |||
| 1983-84 | 12.8 | |||
| 1984-85 | 12.9 | |||
| 1985-86 | 14.9 | |||
| 1986-87 | 14.8 | |||
| 1987-88 | 14.4 | |||
| 1988-89 | 13.6 | |||
| 1989-90 | 12.5 | |||
| 1990-91 | 13.4 | |||
| 1991-92 | 17.1 | |||
| 1992-93 | 21.1 | |||
| 1993-94 | 26.6 | |||
| 1994-95 | 28.3 | |||
| 1995-96 | 30.1 | |||
| 1996-97 | 31.2 | |||
| 1997-98 | 30.5 | |||
| 1998-99 | 29.4 | |||
| 1999-00 | 32.1 | |||
| 2000-01 | 29.3 | |||
| 2001-02 | 28.2 | |||
| 2002-03 | 26.8 | |||
| 2003-04 | 27.5 | |||
| 2004-05 | 26.8 | |||
| 2005-06 | 27.8 | |||
| 2006-07 | 27.1 | |||
| 2007-08 | 26.6 | |||
| 2008-09 | 27.8 | |||
| 2009-10 | 32.3 | |||
| 2010-11 | 34.5 | |||
| 2011-12 | 36.6 | |||
| 2012-13 | 38.2 | |||
| 2013-14 | 39.7 | |||
| 2014-15 | 40.5 | |||
| 2015-16 | 40.3 | |||
| 2016-17 | 39.7 | |||
| 2017-18 | 39.3 | |||
| 2018-19 | 39.4 | |||
| 2019-20 | 39.6 | |||
| 2020-21 | 43.1 | |||
| 2021-22 | 39.8 | |||
| Projection | 2022-23 | 37.3 | 37.8 | |
| 2023-24 | 36.8 | 37.8 | ||
| 2024-25 | 36.2 | 37.7 | ||
| 2025-26 | 35.0 | 36.9 | ||
| 2026-27 | 33.4 | - | ||
| 2027-28 | 31.8 | - | ||
| Interest on Debt to Revenue (Per Cent) | Historical | FAO | 2023 Ontario Budget | |
| Historical | 1981-82 | 6.0 | ||
| 1982-83 | 7.3 | |||
| 1983-84 | 8.7 | |||
| 1984-85 | 9.2 | |||
| 1985-86 | 9.5 | |||
| 1986-87 | 9.7 | |||
| 1987-88 | 9.6 | |||
| 1988-89 | 9.1 | |||
| 1989-90 | 8.2 | |||
| 1990-91 | 7.7 | |||
| 1991-92 | 8.8 | |||
| 1992-93 | 10.8 | |||
| 1993-94 | 13.9 | |||
| 1994-95 | 14.5 | |||
| 1995-96 | 14.6 | |||
| 1996-97 | 14.8 | |||
| 1997-98 | 14.2 | |||
| 1998-99 | 14.3 | |||
| 1999-00 | 15.5 | |||
| 2000-01 | 15.0 | |||
| 2001-02 | 14.2 | |||
| 2002-03 | 12.9 | |||
| 2003-04 | 12.9 | |||
| 2004-05 | 11.1 | |||
| 2005-06 | 10.3 | |||
| 2006-07 | 9.4 | |||
| 2007-08 | 8.9 | |||
| 2008-09 | 9.2 | |||
| 2009-10 | 9.5 | |||
| 2010-11 | 8.8 | |||
| 2011-12 | 9.1 | |||
| 2012-13 | 9.0 | |||
| 2013-14 | 9.1 | |||
| 2014-15 | 8.9 | |||
| 2015-16 | 8.5 | |||
| 2016-17 | 8.3 | |||
| 2017-18 | 7.9 | |||
| 2018-19 | 8.1 | |||
| 2019-20 | 8.0 | |||
| 2020-21 | 7.4 | |||
| 2021-22 | 6.8 | |||
| Projection | 2022-23 | 6.6 | 6.7 | |
| 2023-24 | 6.6 | 6.9 | ||
| 2024-25 | 6.4 | 6.8 | ||
| 2025-26 | 6.1 | - | ||
| 2026-27 | 5.8 | - | ||
| 2027-28 | 5.5 | - | ||
| Year | Total Revenues ($ Billions) | |||
|---|---|---|---|---|
| Historical | FAO | 2023 Ontario Budget | ||
| Historical | 2019-20 | 156.1 | ||
| 2020-21 | 164.9 | |||
| 2021-22 | 185.1 | |||
| Projection | 2022-23 | 197.1 | 200.4 | |
| 2023-24 | 201.1 | 204.4 | ||
| 2024-25 | 210.7 | 213.1 | ||
| 2025-26 | 221.8 | 226.0 | ||
| 2026-27 | 231.1 | - | ||
| 2027-28 | 239.7 | - | ||
| Change in 2022-23 (Per Cent) | ||
|---|---|---|
| FAO | 2023 Ontario Budget | |
| Personal Income Tax | 7.7 | 13.0 |
| Labour Income | 9.5 | 9.0 |
| Corporations Tax | 6.6 | 10.7 |
| Corporate Profits | 4.7 | 5.0 |
| Year | Program Spending ($ Billions) | |||
|---|---|---|---|---|
| Historical | FAO | 2023 Ontario Budget | ||
| Historical | 2020-21 | 169.0 | ||
| 2021-22 | 170.4 | |||
| Projection | 2022-23 | 183.6 | 189.1 | |
| 2023-24 | 184.8 | 190.6 | ||
| 2024-25 | 189.9 | 196.4 | ||
| 2025-26 | 197.7 | 202.5 | ||
| 2026-27 | 202.9 | - | ||
| 2027-28 | 210.1 | - | ||
| Year | Real GDP Growth (Per Cent) | ||
|---|---|---|---|
| World | Advanced economies | Emerging market and developing economies | |
| 2012-2019 | 3.4 | 1.9 | 4.6 |
| 2023-2028 | 3.0 | 1.6 | 4.0 |
| Historical | Projection | |||
|---|---|---|---|---|
| 2022 | 2023 | 2024 | 2025-2027 Average | |
| Annual CPI Inflation (Per Cent) | 6.8 | 3.6 | 2.1 | 2.0 |
| (Per Cent) | Historical | Projection | |||||
|---|---|---|---|---|---|---|---|
| 2021 | 2022 | 2023 | 2024 | 2025 | 2026 | 2027 | |
| 3-month Treasury Bill Yield | 0.1 | 2.2 | 4.4 | 3.4 | 2.5 | 2.4 | 2.4 |
| 10-year Government of Canada Bond Yield | 1.4 | 2.8 | 3.0 | 3.0 | 3.1 | 3.2 | 3.2 |
| Ontario Real GDP Growth (Per Cent) |
2021 | 2022 | 2023 | 2024 | 2025-2027 Average |
|---|---|---|---|---|---|
| Historical | 5.2 | 3.7 | |||
| FAO | 0.8 | 1.5 | 2.0 |
| Per Cent | Historical | FAO | ||
|---|---|---|---|---|
| 2022 | 2023 | 2024 | 2025-27 Average | |
| Employment Growth | 4.6 | 1.7 | 0.8 | 1.2 |
| Unemployment Rate | 5.6 | 5.7 | 6.3 | 6.1 |
| Year | Nominal GDP growth (Per Cent) | |
|---|---|---|
| Historical | 2021 | 10.3 |
| 2022 | 9.2 | |
| Projection | 2023 | 3.1 |
| 2024 | 3.5 | |
| 2025-27 Average | 4.0 | |
Footnotes
[1] For more information on fiscal sustainability indicators, see the FAO’s Long-term Budget Outlook: Assessing Ontario’s Fiscal Sustainability: 2021-2050 report.
[2] The 2023 Ontario Budget updated the target for the net debt-to-GDP ratio to stay below 40 per cent, compared to a target of 42 per cent in the 2022 Ontario Budget. See 2023 Ontario Budget, page 173.
[3] The impact of rising rates on interest on debt payments is mitigated in part by the term structure of Ontario’s debt, which in 2022-23 had an average term to maturity of 11.1 years. See 2023 Ontario Budget, page 171.
[4] The 2023 Ontario Budget updated the target for the interest on debt-to-revenue ratio to stay below 7.5 per cent, compared to a target of 8 per cent in the 2022 Ontario Budget. See 2023 Ontario Budget, page 173.
[5] Loss of one-time revenues include a reduction in time-limited COVID-19 related funding and payments to reflect higher tax assessments in 2021-22 and prior years. Measures that lower total revenue in 2022-23 announced in previous Ontario Budgets and Economic Outlook and Fiscal Reviews include the enhanced Low-income Individuals and Families Tax (LIFT) Credit and the reduction in the Gasoline and Fuel Tax.
[6] For information on changes to the FAO's revenue projection compared to the Winter EBO, see the appendix.
[7] For example, total revenue in 2021-22 was $185.1 billion, or 5.0 per cent higher than the FAO’s 2022 spring forecast, and 6.6 per cent higher than forecast in the 2022 Ontario Budget.
[8] For information on changes to the FAO’s spending projection compared to the Winter EBO, see the appendix.
[9] As of the 2023 Ontario Budget, there was $1.8 billion remaining in the contingency fund in 2022-23 and $4.0 billion in 2023-24. For 2024-25 and 2025-26, the Ministry of Finance has asserted that disclosure of the contingency fund balance would reveal a Cabinet record. The FAO has agreed not to disclose Cabinet record information as per paragraph 2(f) of Order in Council 1086/2022.
[10] Includes $5.0 billion for ongoing land and land-related claims with Indigenous communities and $1.3 billion for a “one-time investment” under Treasury Board Secretariat (see the 2023 Ontario Budget, p. 153).
[11] As proposed in the 2023 Ontario Budget (p. 81), the Ontario Guaranteed Annual Income Act was amended to expand eligibility for the GAINS program and also to adjust the benefit annually to inflation.
[12] See, Ontario Health Sector: 2023 Budget Spending Plan Review.
[13] World Economic Outlook, International Monetary Fund, April 2023.
[14] Year-over-year inflation rates as of April 2023.
[15] Business Outlook Survey - First Quarter of 2023, Bank of Canada, April 2023.
[16] For an update on Ontario’s labour market performance in 2022, see the FAO’s Ontario’s Labour Market in 2022 report.
[17] Financial System Review 2023, Bank of Canada.
[18] From 2022 Q1 to 2023 Q1, Ontario’s population grew by an estimated 3.0 per cent, the fastest gain since the second quarter of 1972 when population growth was 3.2 per cent.
[19] The Province recently reached agreements with approximately 55,000 education workers who are members of the Canadian Union of Public Employees (CUPE) and approximately 7,000 education workers represented by the Ontario Council of Educational Workers (OCEW). The FAO estimates that these workers will receive an average annual wage increase of approximately 4.5 per cent per year for four years, which is above the long-term historical average of 2.2 per cent.
[20] Bill 124 refers to the Protecting a Sustainable Public Sector for Future Generations Act, 2019.


