


An Overview of the Tourism, Culture and Heritage Economic Sectors, Related Ministry Programs and the Impact of the COVID-19 Pandemic
Introduction
On May 12, 2020, the Legislative Assembly authorized the Standing Committee on Finance and Economic Affairs (SCFEA) to meet to consider the Economic and Fiscal Update Act, 2020 (Bill 188) and “to study the impacts of the COVID-19 crisis on the following sectors of the economy and measures which will contribute to their recovery:
- tourism;
- culture and heritage;
- municipalities, construction and building;
- infrastructure;
- small and medium enterprises; and
- other economic sectors selected by the committee.”[1]
The Legislative Assembly also directed that the Financial Accountability Officer make available the resources of the FAO to SCFEA and its members on a priority basis.
In addition, also on May 12, 2020, the Government of Ontario (the Province) tabled in the Legislative Assembly Volume 1 of the 2020-21 Expenditure Estimates.[2] The 2020-21 Expenditure Estimates (or Estimates) sets out the fiscal year’s spending requirements for ministries and constitutes the government’s formal request to the legislature for approval to spend the amounts as detailed in the Estimates.
After tabling in the legislature, the Estimates were referred to the Standing Committee on Estimates (SCE). The SCE is mandated to consider the Estimates of between six and 12 ministries. Once the review and voting process is completed for all selected ministries, the SCE must deliver a report to the legislature by the third Thursday in November.[3] The Supply Bill is then formally introduced in the legislature for approval by all Members of Provincial Parliament (MPPs). Passage of the Supply Bill provides the legislature’s approval to spend the amounts as detailed in the Estimates.
The purpose of this report is to support SCFEA’s review of the tourism, culture and heritage sectors of the provincial economy and to provide analysis on the Ministry of Heritage, Sport, Tourism and Culture Industries’ (MHSTCI) spending plan in the 2020-21 Expenditure Estimates. The report begins with an economic overview of the tourism, culture and heritage industries in Ontario prior to the COVID-19 outbreak and provides information on how the sectors have been impacted by the government measures implemented to combat the pandemic. Next, the report looks at MHSTCI’s programs and how those programs support the tourism, culture and heritage sectors. This section of the report also discusses how the COVID-19 outbreak may impact these spending programs. Finally, the report takes a detailed look at the ministry’s 2020-21 Expenditure Estimates by program vote and identifies spending trends and program changes.
Economic Context
In 2019, tourism, culture and heritage activities directly contributed approximately $28.1 billion to the Ontario economy.[4] In addition, the FAO estimates that these sectors indirectly contributed $15.6 billion in economic benefit through the provincial supply chain.[5] In total, tourism, culture and heritage sector activities generated $43.7 billion in economic activity in 2019, representing 4.9 per cent of Ontario’s GDP.
The tourism economic sector represents the economic benefit to Ontario from tourist spending on accommodations, restaurants, transportation and attractions, which supports employment and generates economic activity in the province. The culture and heritage sector represents the economic activity from media production (film and television, publishing, broadcasting) and the arts and heritage industries (performing arts, sport events, museums).
The COVID-19 outbreak and the federal and provincial governments’ response to combat the pandemic have had a dramatic impact on the tourism, culture and heritage sectors. This chapter provides an economic overview of the tourism, culture and heritage sectors, discusses the impact to these sectors from the COVID-19 outbreak, and outlines key considerations for these sectors going forward.
Tourism, Culture and Heritage Sectors in 2019
Tourism Sector
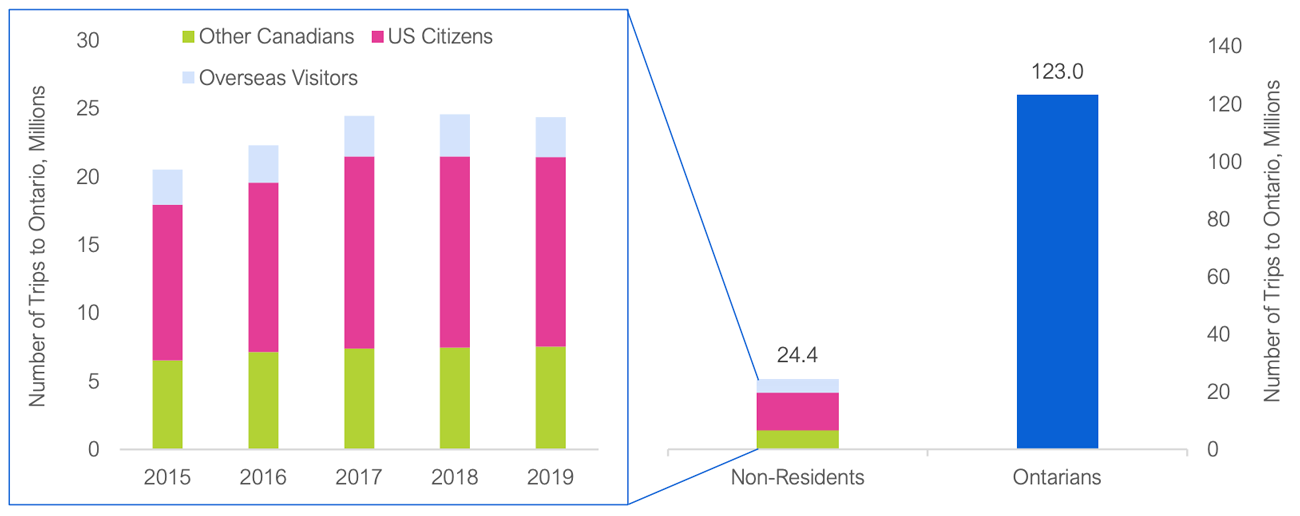
The FAO estimates that in 2019 Ontario received 24.4 million interprovincial and international visitors. Of this amount, 13.9 million were from the United States, 2.9 million were from overseas and 7.5 million were from other Canadian provinces. In addition to trips from non-residents, Ontarians took 123.0 million trips for touristic purposes[6] within the province in 2019 – far more trips than visitors from any other place of origin.
Figure 1 Tourist Trips to Ontario by Non-Residents, 2015 to 2019
Figure 2 Tourist Trips Made by Ontarians Compared to Non-Residents, 2019
Source: FAO, MHSTCI and Statistics Canada.
Accessible version
| Year | Other Canadians | US Citizens | Overseas Visitors |
|---|---|---|---|
| 2015 | 6,530 | 11,419 | 2,565 |
| 2016 | 7,135 | 12,414 | 2,741 |
| 2017 | 7,397 | 14,078 | 2,966 |
| 2018 | 7,469 | 14,005 | 3,101 |
| 2019 | 7,532 | 13,893 | 2,943 |
| Year | Other Canadians |
|---|---|
| Non-Residents | 123.0 |
| Ontarians | 24.4 |
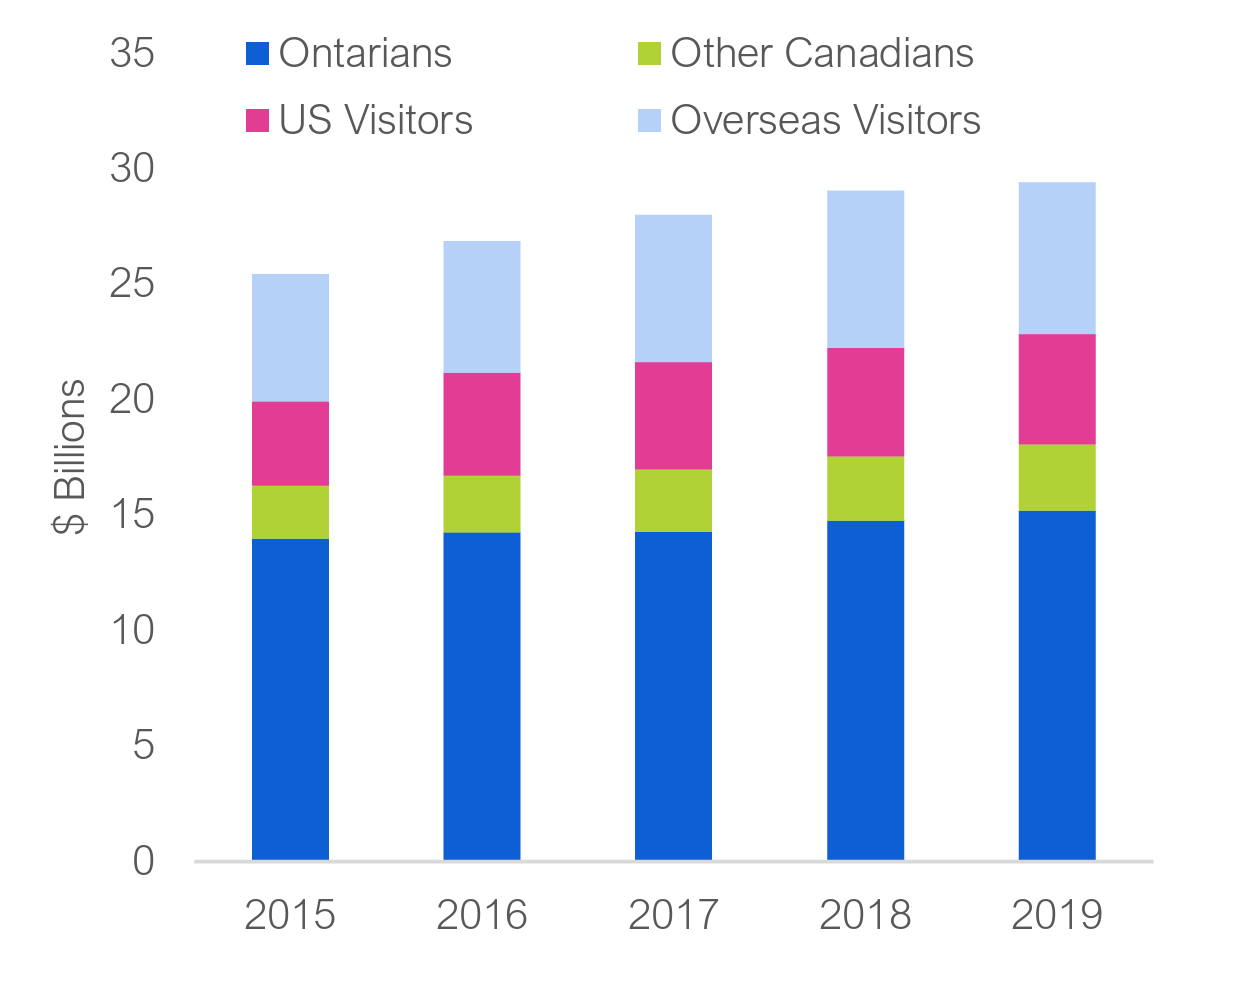
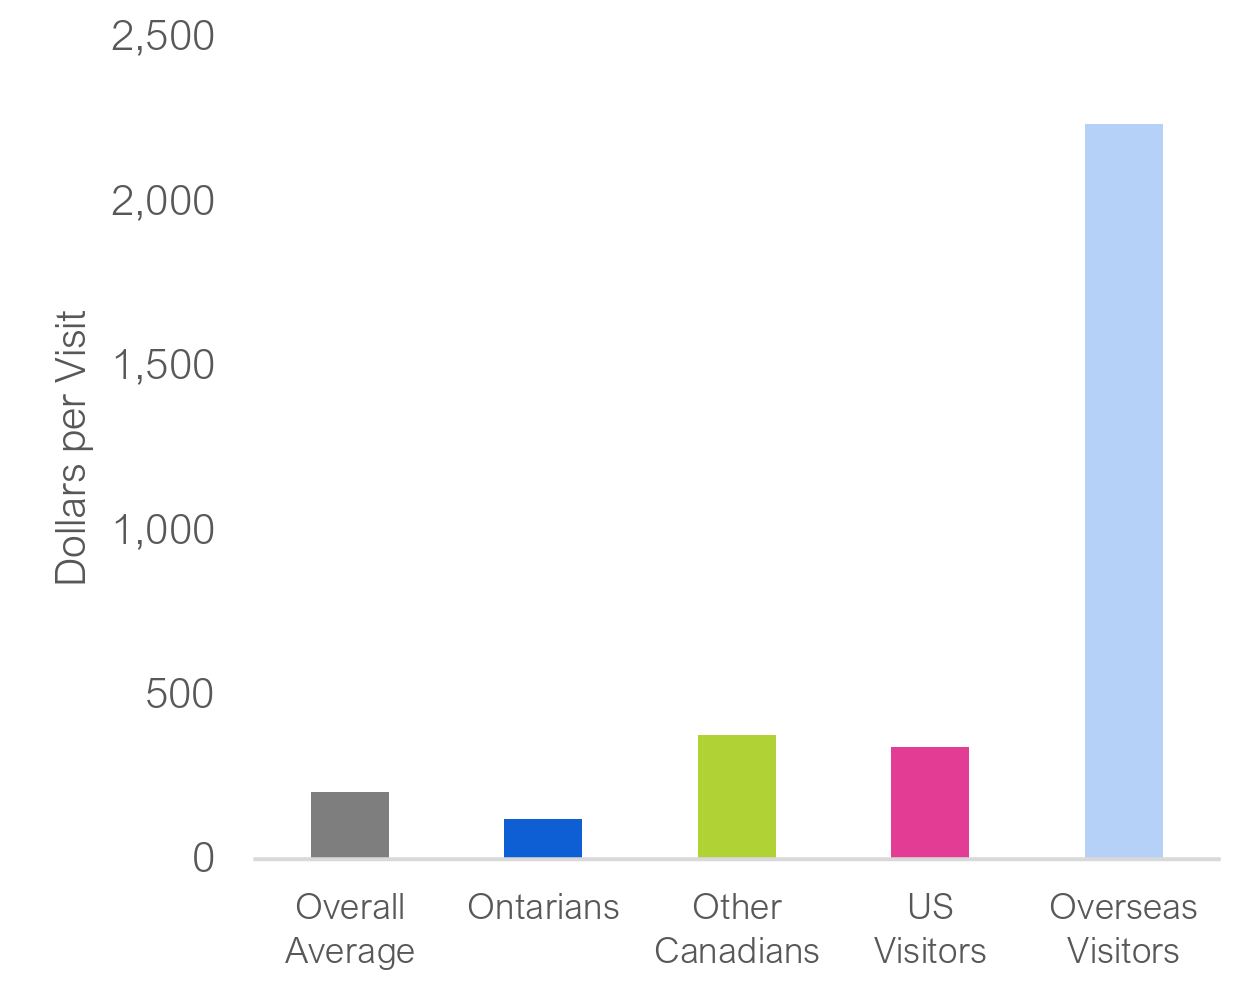
Visitors in Ontario spent $29.4 billion in the province in 2019.[7] Of this amount, $15.2 billion was spent by Ontario residents, $2.9 billion by other Canadian residents, $4.8 billion by American visitors and $6.6 billion by overseas visitors. Overseas tourists spent an average of $2,200 per visit, the most of all visitors, while Ontarians spent the least at $120 per visit.
Figure 3 Tourism Spending, 2015 to 2019
Source: Statistics Canada, Ontario Economic Accounts and FAO.
Accessible version
| Year | Ontarians | Other Canadians | US Visitors | Overseas Visitors |
|---|---|---|---|---|
| 2015 | 13,974 | 2,311 | 3,637 | 5,511 |
| 2016 | 14,253 | 2,468 | 4,443 | 5,707 |
| 2017 | 14,283 | 2,701 | 4,648 | 6,376 |
| 2018 | 14,761 | 2,782 | 4,717 | 6,800 |
| 2019 | 15,203 | 2,862 | 4,773 | 6,582 |
Figure 4 Tourism Spending per Visit, 2019
Source: Statistics Canada, Ontario Economic Accounts and FAO.
Accessible version
| Dollars Per Visit | |
|---|---|
| Overall Average | 204 |
| Ontarians | 124 |
| Other Canadians | 380 |
| US Visitors | 344 |
| Overseas Visitors | 2,236 |
Spending by tourists has a significant impact on businesses across a number of sectors, including hotels, restaurants and bars, transportation and travel services, amusements, and retail. These tourism-connected sectors employed a total of 1.9 million people in 2019.[8] The FAO estimates that approximately 14 per cent of these jobs were directly supported by tourism (see next paragraph for more information) with the remaining 86 per cent supported by other economic activity.
Tourist spending supports business activity and employment, and boosts household income. The FAO estimates that every $1 million in tourism spending supports 8.7 jobs (6.8 direct and 1.8 indirect) and increases labour income by a total of $343,000.[9] Based on tourism spending in Ontario in 2019, the FAO estimates that tourism directly supported 264,000 jobs[10] and indirectly supported an additional 71,000 jobs, for a total of 335,000 jobs in 2019.[11] In total, this represented 5.1 per cent of total 2019 employment in Ontario.[12]
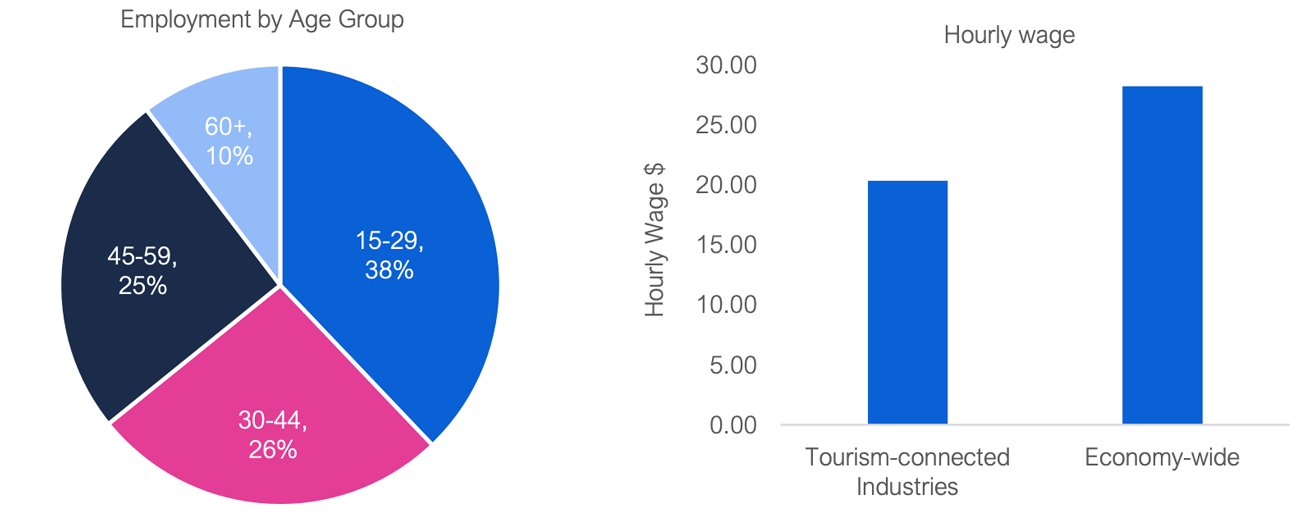
Employees in tourism-connected sectors are typically younger than the economy-wide average, with nearly 40 per cent of total workers in these sectors between the ages of 15 and 29. Those who are between the ages of 30 to 44 and 45 to 59 each make up approximately one-quarter of the workforce. Workers aged 60 and over comprise ten per cent of employment. On average, employees in tourism-connected industries earn $20.30 per hour compared to the economy-wide average of $28.20.
Figure 5 Demographics and Wages in Tourism-connected Industries, 2019
Source: FAO and Statistics Canada.
Accessible version
| Age Group | Share of Tourism-connected Industries Employment |
|---|---|
| 15-29 | 38% |
| 30-44 | 26% |
| 45-59 | 25% |
| 60+ | 10% |
Culture and Heritage Sector
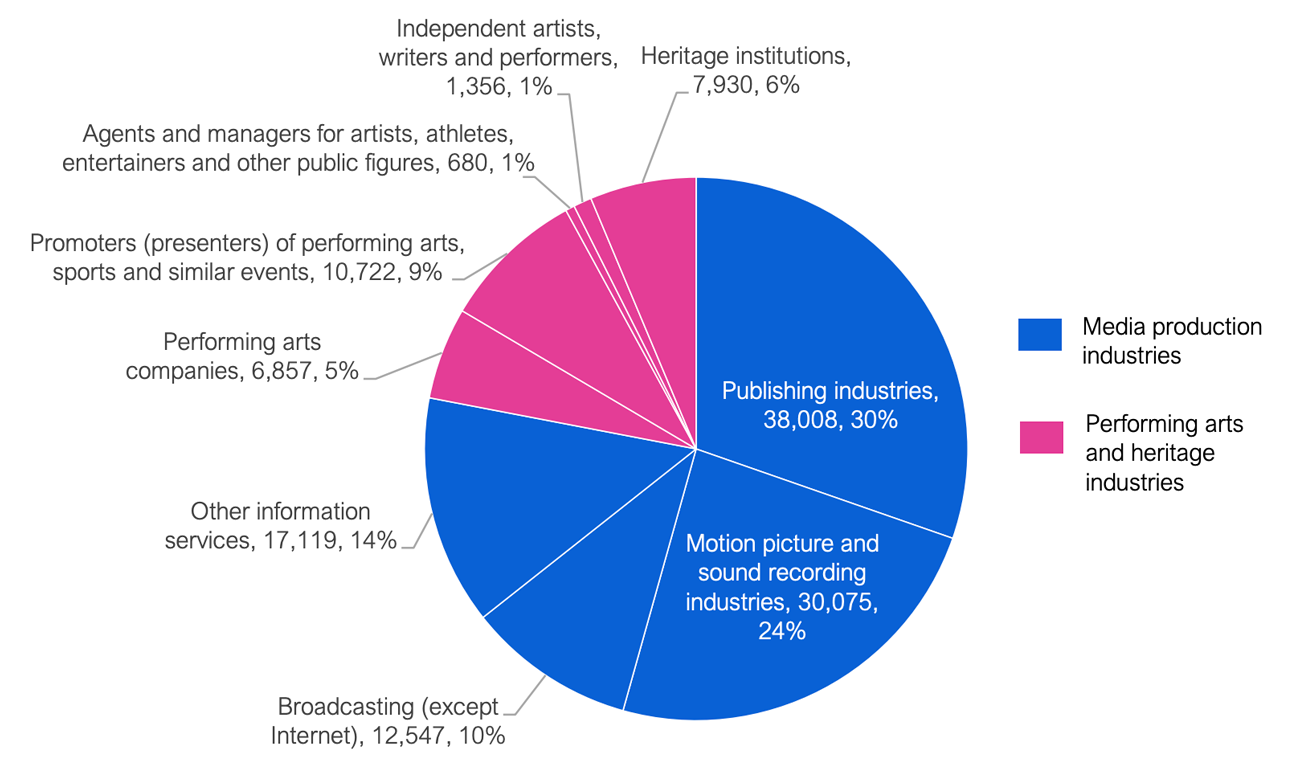
The culture and heritage sector is made up of several industries that directly employed a total of 125,300 people in 2019. The first major group of industries relate to the production of media, which employed 97,700 workers in 2019. This includes publishing industries, motion picture and sound recording industries, broadcasting (except internet), and other information services. The second major group of industries relates to performance arts and heritage, which employed the remaining 27,500 workers. This includes performing arts companies, promoters or presenters of performing arts, sports and similar events, agents and managers for artists, athletes, entertainers and other public figures, independent artists, writers and performers, and heritage institutions.
Figure 6 Culture and Heritage Sector Employment, 2019
Source: FAO and Statistics Canada’s Survey of Employment, Payroll, and Hours.
Accessible version
| Occupation | Number of Employees | Share of Sector Employment (%) |
|---|---|---|
| Publishing industries | 38,008 | 30% |
| Motion picture and sound recording industries | 30,075 | 24% |
| Broadcasting (except Internet) | 12,547 | 10% |
| Other information services | 17,119 | 14% |
| Performing arts companies | 6,857 | 5% |
| Promoters (presenters) of performing arts, sports and similar events | 10,722 | 9% |
| Agents and managers for artists, athletes, entertainers and other public figures | 680 | 1% |
| Independent artists, writers and performers | 1,356 | 1% |
| Heritage institutions | 7,930 | 6% |
In addition to the 125,300 people directly employed in the culture and heritage sector, the FAO estimates that 157,000 workers were indirectly supported through the supply chain in 2019 by culture and heritage activities.[13] In total, the FAO estimates that in 2019, 282,000 people are directly or indirectly supported by culture and heritage activities, representing 4.3 per cent of total employment.
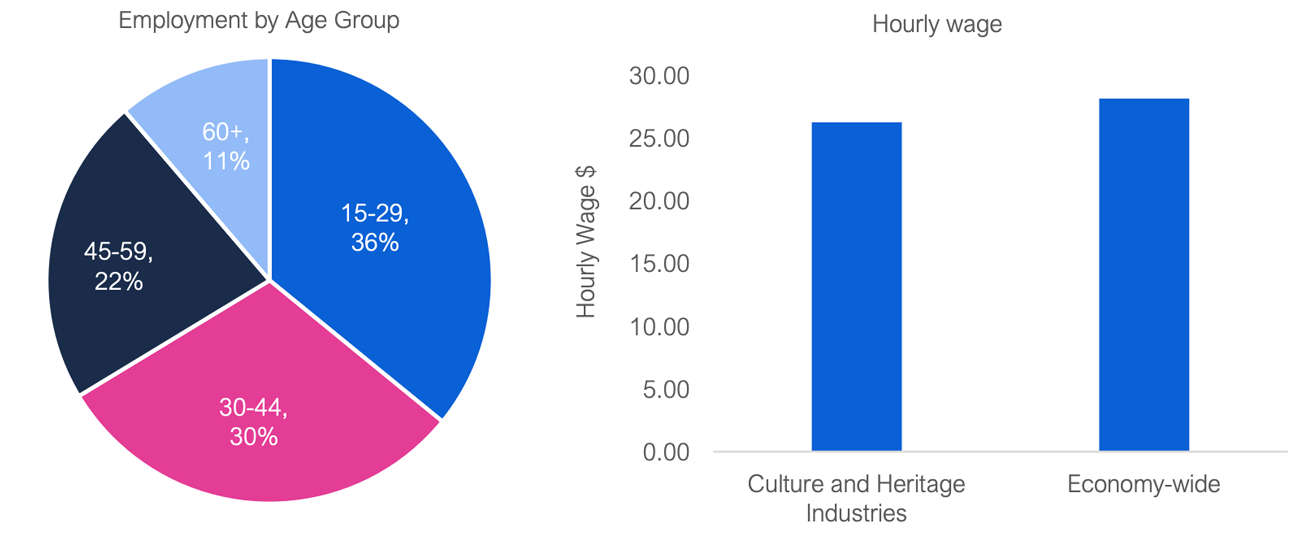
Over one-third of employees in the culture and heritage sector are between the ages of 15 to 29 and another 30 per cent of employees are between the ages of 30 to 44. On average, employees in culture and heritage industries earn $26.30 per hour, lower than the economy-wide average wage rate of $28.20 per hour.
Figure 7Demographics and Wages in Culture and Heritage Industries, 2019
Source: FAO and Statistics Canada.
Accessible version
| Age Group | Share of Culture and Heritage Industries Employment |
|---|---|
| 15-29 | 36% |
| 30-44 | 30% |
| 45-59 | 22% |
| 60+ | 11% |
Impact of the COVID-19 Pandemic on the Tourism, Culture and Heritage Sectors
Tourism Sector
In response to the COVID-19 pandemic, the federal government and Province implemented measures to contain the virus. These measures included requiring the closure of non-essential businesses, advising Canadians against non-essential travel, banning all foreign nationals (other than American citizens) from travel of any kind to Canada, and allowing only non-discretionary travel at the Canada-US border.[14]
As a result of these measures, tourism activity in Ontario has fallen steeply. The number of international travellers entering Ontario (for business, touristic or other purposes) declined from 1.4 million in February 2020 to 81,600 in April 2020. The FAO estimates that the number of international travellers recovered slightly to 109,500 in May.
Figure 8Total Monthly International Visits to Ontario
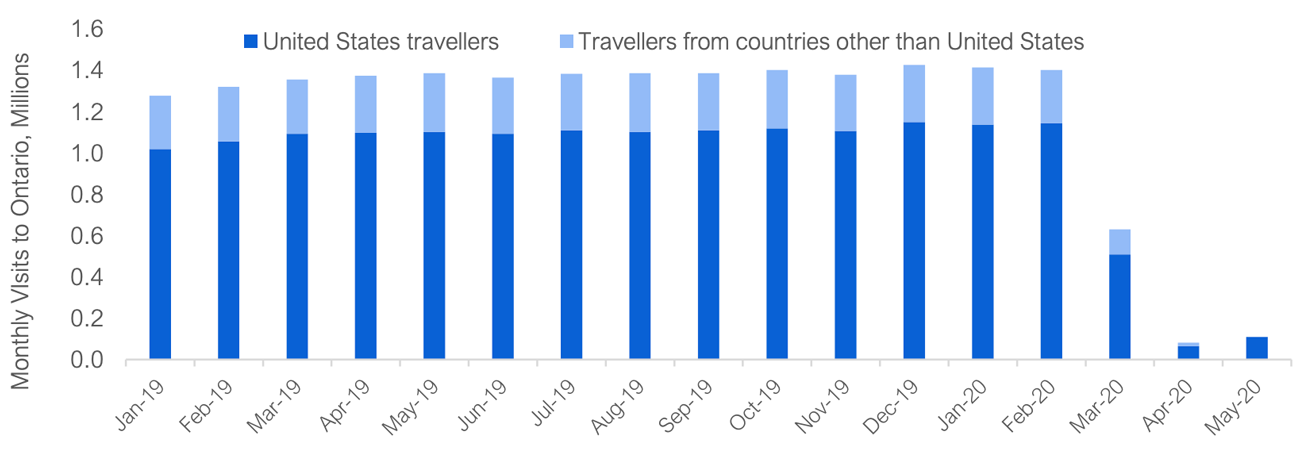
Source: FAO and Statistics Canada.
Accessible version
| Year | Month | United States Travellers | Travellers from countries other than United States |
|---|---|---|---|
| 2019 | January | 1,018,933 | 257,542 |
| 2019 | February | 1,056,329 | 264,158 |
| 2019 | March | 1,092,826 | 263,065 |
| 2019 | April | 1,097,575 | 276,206 |
| 2019 | May | 1,102,285 | 283,677 |
| 2019 | June | 1,093,212 | 271,715 |
| 2019 | July | 1,109,270 | 273,883 |
| 2019 | August | 1,101,626 | 283,647 |
| 2019 | September | 1,109,184 | 276,683 |
| 2019 | October | 1,119,042 | 282,639 |
| 2019 | November | 1,106,658 | 272,347 |
| 2019 | December | 1,149,927 | 276,256 |
| 2020 | January | 1,136,493 | 276,568 |
| 2020 | February | 1,143,945 | 258,047 |
| 2020 | March | 508,065 | 121,444 |
| 2020 | April | 64,390 | 17,213 |
| 2020 | May | 109,518 | 0 |
While up-to-date data on interprovincial and Ontario travellers is not available, other real-time indicators point to a significant drop in domestic travel. By April 2020, the amount of domestic flights in Ontario decreased by over 60 per cent compared to January levels and Ontarians’ driving activity decreased by 60 per cent compared to pre-COVID-19 levels. (For additional near real-time tourism-related statistics, see the appendix.)
The reduction in tourists and corresponding fall in tourism spending reduced employment in tourism-connected sectors. In addition to lower tourist activity, the broader economic climate has deteriorated significantly due to the COVID-19 pandemic, which has also contributed to lower employment in tourism-connected sectors. The FAO estimates that, out of the 1.9 million jobs in these sectors, 0.5 million were lost since February, representing a reduction of 26 per cent.[15] However, it is unclear what portion of these job losses are due to the broader recession and what portion can be directly attributed to lower tourist activity.
Figure 9Tourism-connected Sectors Employment
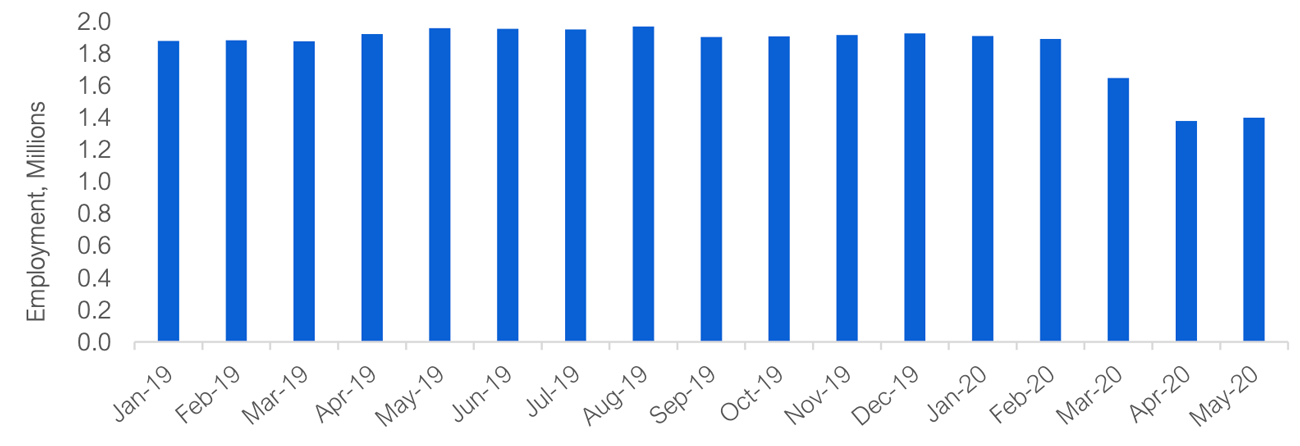
Note: This represents employment in the following tourism-connected sectors: retail, transportation, accommodation, food and beverage, arts, entertainment and recreation, and travel services. Since these sectors also serve Ontario residents, not all job losses are attributed to the reduction in tourism. Some employment losses are due to declines in the broader economy.
Source: FAO estimate based on data from Statistics Canada.
Accessible version
| Year | Month | Employment |
|---|---|---|
| 2019 | January | 1,878,736 |
| 2019 | February | 1,881,892 |
| 2019 | March | 1,877,316 |
| 2019 | April | 1,921,875 |
| 2019 | May | 1,958,093 |
| 2019 | June | 1,953,861 |
| 2019 | July | 1,950,409 |
| 2019 | August | 1,968,175 |
| 2019 | September | 1,903,668 |
| 2019 | October | 1,906,548 |
| 2019 | November | 1,914,492 |
| 2019 | December | 1,925,029 |
| 2020 | January | 1,910,005 |
| 2020 | February | 1,890,719 |
| 2020 | March | 1,647,894 |
| 2020 | April | 1,377,989 |
| 2020 | May | 1,398,672 |
Culture and Heritage Sector
The COVID-19 pandemic has also had a significant impact on the culture and heritage sector. On March 23, the Province closed workplaces except for essential services, resulting in the shutdown of businesses where employees could not work from home.[16] This had a significant impact on the media production industry, which requires large numbers of employees to be on-site.
In May, the government expanded the list of essential services to allow office-based media businesses, including sound recording studios, film and television postproduction, publishing, and digital media, to resume.[17] However, filming and other activities that require a gathering of workers remained closed until June, when the province gradually entered Stage 2 of the government’s recovery plan.[18]
The second component of the culture and heritage sector is performing arts and heritage industries. Most of these activities, which involve gatherings of people, were also deemed non-essential and were shut down on March 23. As of the writing of this report, most of these industries remain closed, although under Stage 2 of the government’s recovery plan some activities are allowed to resume, such as drive-in venues (e.g., theatres and concerts) and attractions and heritage institutions (with restrictions).[19]
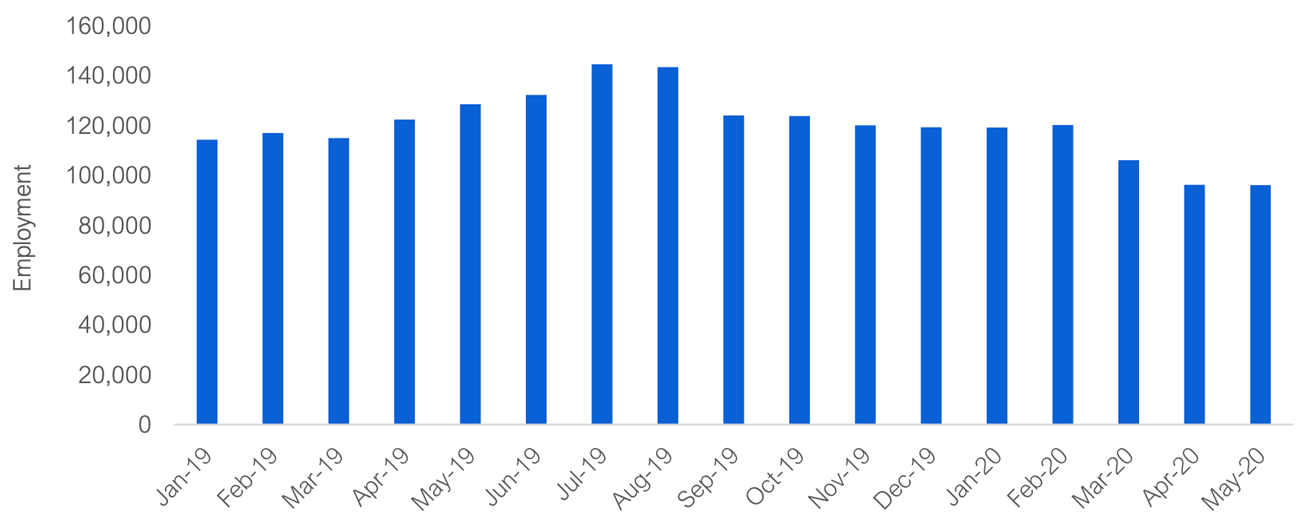
Due to this loss in economic activity, direct employment in the culture and heritage sector has decreased significantly since February, falling from 120,000 to 96,000 by May, a decline of 20 per cent.
Figure 10Cultural and Heritage Sector Employment
Source: FAO estimate based on data from Statistics Canada.
Accessible version
| Year | Month | Employment |
|---|---|---|
| 2019 | January | 114,211 |
| 2019 | February | 116,924 |
| 2019 | March | 114,869 |
| 2019 | April | 122,266 |
| 2019 | May | 128,431 |
| 2019 | June | 132,212 |
| 2019 | July | 144,500 |
| 2019 | August | 143,268 |
| 2019 | September | 123,993 |
| 2019 | October | 123,664 |
| 2019 | November | 119,924 |
| 2019 | December | 119,266 |
| 2020 | January | 119,102 |
| 2020 | February | 120,170 |
| 2020 | March | 106,074 |
| 2020 | April | 96,128 |
| 2020 | May | 95,964 |
Considerations on the Outlook for the Tourism, Culture and Heritage Sectors
The FAO forecasts that Ontario’s overall real GDP will decline by 9.0 per cent in 2020 and rebound in 2021, growing by 8.5 per cent.[20] Ontario’s recovery depends on the pace and extent that health and economic restrictions are lifted and whether Ontario experiences a second wave of the COVID-19 outbreak, which could force the Province to re-instate restrictions to combat the pandemic.[21] The tourism, culture and heritage sectors will face unique challenges going forward as ongoing travel and social restrictions impact the sectors’ ability to reopen and recover.
Tourism Sector
The tourism sector depends on international and domestic travellers. As previously discussed, Canada has banned visits from overseas and non-essential visits from the US, and requires a 14-day quarantine for people entering the country. Any recovery in US and overseas visitors will depend on when and how the federal government relaxes travel restrictions to Canada. Until these restrictions are lifted, and the level of activity from US and overseas visitors returns to 2019 levels, this represents a loss of annual spending by tourists of up to $11.4 billion.
Domestically, the Ontario government is advising against non-essential travel to the province by other Canadian residents.[22] In 2019, spending in Ontario by interprovincial tourists was approximately $2.9 billion. Going forward, the return of interprovincial tourists to Ontario will depend on the Province’s economic reopening and a change to the Province’s advice on non-essential interprovincial travel.
Finally, Ontario residents spent $15.2 billion on tourism in the province in 2019, the largest component of overall tourist spending. The level of touristic trips by Ontarians within the province in 2020 and 2021 will depend on the state of the COVID-19 outbreak and the reopening of the provincial economy, including measures restricting gatherings. As of the writing of this report, most regions in the province are in Stage 2 of the Province’s plan to reopen the economy. Starting in Stage 2, some touristic activity can resume, including outdoor dining, shopping malls with restrictions, tour and guide services, drive-in venues such as theatres, concerts and animal attractions, and attractions and heritage institutions can reopen with restrictions.[23] In addition, starting June 5, the Province lifted restrictions on short-term rentals including lodges, cottages, condominiums and bed-and-breakfasts. Finally, it is important to note that in 2019, Ontarians spent $30.9 billion on tourist trips outside of Ontario.[24] Until the COVID-19 outbreak is resolved internationally, the level of touristic visits by Ontarians outside of the province will be limited compared to 2019 levels, resulting in an opportunity to shift Ontarian’s tourism activities to within the province.
Culture and Heritage Sector
The outlook for the culture and heritage sector depends on the state of workplace restrictions, limitations on large gatherings and physical distancing requirements. Currently, workplace activity in media production industries is allowed to resume in all regions of Ontario (under Stage 2 of the government’s reopening plan) except for Windsor-Essex. However, to the extent that media production industries rely on large gatherings of people and travel for their workers, restrictions on physical distancing and travel will continue to impact this sub-sector.
In the arts and heritage industries, limitations on gatherings and physical distancing requirements are the key restrictions that will limit the ability of this sub-sector to fully recover. Heritage institutions, such as museums, performing arts and sporting events are dependent on large gatherings of people. Economic recovery will not be able to begin until restrictions on gatherings are eased and eventually lifted. In addition, even when larger gatherings are allowed, physical distancing requirements will likely still remain. In a recent report, the FAO noted that maximum occupancy limits for venues such as theatres and stadiums would not allow patrons to maintain two metre physical distancing requirements.[25] When large gatherings are allowed to resume, if two metre physical distancing requirements are maintained, this would result in significant reductions in the maximum allowable capacity for arts and heritage institutions and other events.
Program Spending Overview
Since 2016-17, the Province has spent approximately $1.6 billion each year on tourism, culture and heritage-related programs through the Ministry of Heritage, Sport, Tourism and Culture Industries (MHSTCI). In 2020-21, MHSTCI plans to spend $1.7 billion, a reduction of $35 million from 2019-20. Over the last five years, spending by the ministry has grown by an average of 2.9 per cent each year.[26]
Figure 11MHSTCI Spending, 2015-16 to 2020-21
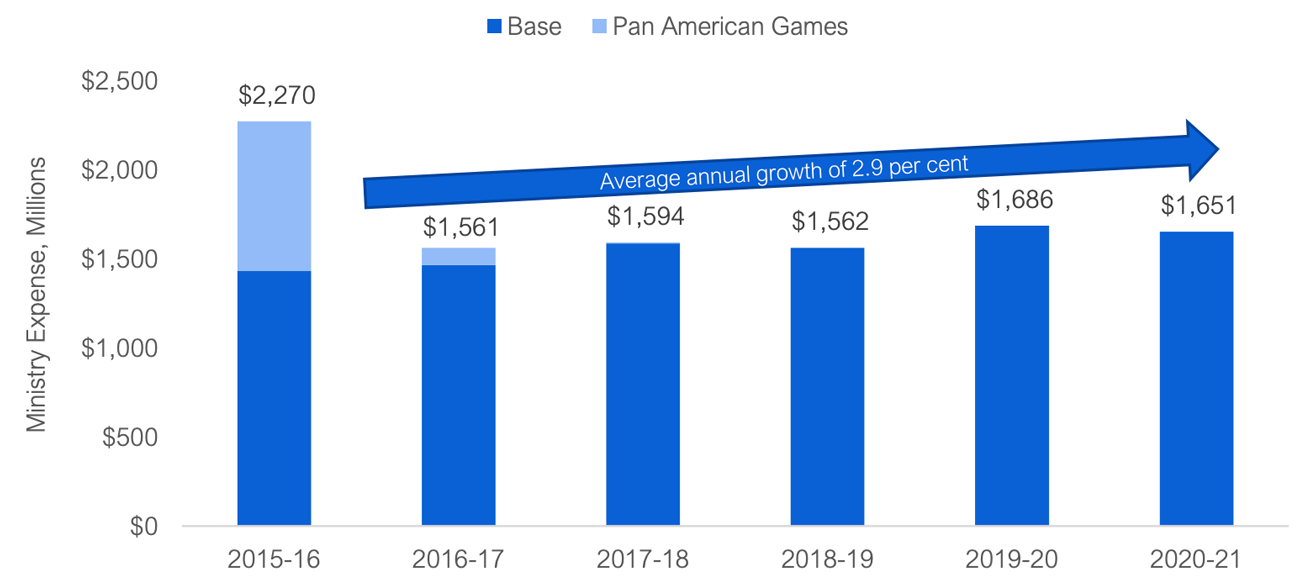
Note: 2019-20 and 2020-21 figures as reported in the March 2020 Economic and Fiscal Update.
Source: Public Accounts of Ontario, Ontario Budgets and the March 2020 Economic and Fiscal Update.
Accessible version
| Year | Ministry Expense, $ Millions | ||
|---|---|---|---|
| Base | Pan American Games | Total | |
| 2015-16 | 1,431 | 839 | 2,270 |
| 2016-17 | 1,465 | 96 | 1,561 |
| 2017-18 | 1,594 | – | 1,594 |
| 2018-19 | 1,562 | – | 1,562 |
| 2019-20 | 1,651 | – | 1,651 |
Ministry Programs and COVID-19 Impact Considerations
MHSTCI’s objective is to promote tourism, support culture and community engagement, and encourage participation in recreation and sports within Ontario. In the 2020-21 Expenditure Estimates, the ministry’s spending plan of $1,651 million is separated into votes, items, accounts, statutory spending, and consolidation and other adjustments.[27] Alternatively, the FAO has grouped the ministry’s 2020-21 spending plan into six main program areas:
- cultural media tax credits ($704 million);
- agencies ($566 million);
- the Ontario Trillium Foundation ($132 million);
- heritage, tourism and culture programs ($99 million);
- sport, recreation and community programs ($88 million); and
- ministry operations ($62 million).
Approximately 77 per cent of planned ministry spending in 2020-21 is for two spending categories: cultural media tax credits and agencies. The remaining four categories account for 23 per cent of planned spending in 2020-21.
Figure 12Planned Ministry Spending by Main Program Area, 2020-21 (millions)
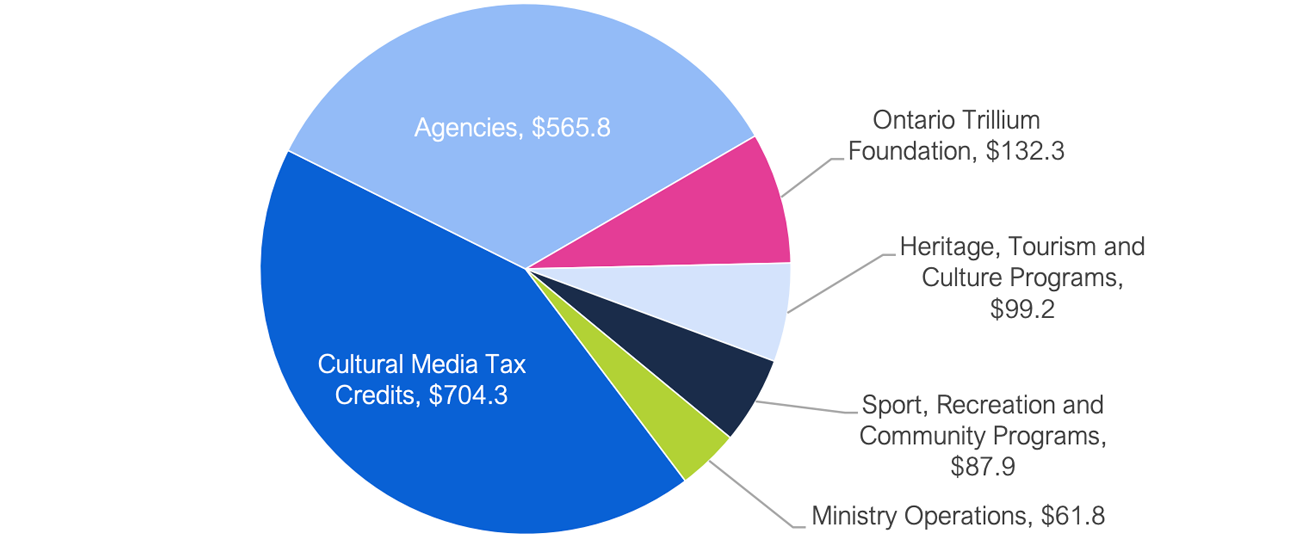
Source: 2020-21 Expenditure Estimates.
Accessible version
| Sector | Hourly Wage |
|---|---|
| Cultural Media Tax Credits | 704 |
| Agencies | 566 |
| Ontario Trillium Foundation | 132 |
| Heritage, Tourism and Culture Programs | 99 |
| Sport, Recreation and Community Programs | 88 |
| Ministry Operations | 62 |
The remainder of this chapter provides an overview of each program area and provides considerations on how the COVID-19 pandemic may impact each area’s planned spending in 2020-21.
Cultural Media Tax Credits
In 2020-21, the Province plans to spend $704 million on five cultural media tax credits. These tax credits are offered to encourage the development of Ontario-based film, television and other media by providing refundable tax credits to qualifying productions. Eligibility is certified by Ontario Creates, an agency of the ministry, based on several criteria including content genre, type and timing of expenses, filming location, and company ownership.
The two largest tax credits, the Ontario Production Services Tax Credit (OPSTC) and the Ontario Film and Television Tax Credit (OFTTC), account for 80 per cent of planned spending in 2020-21. The OPSTC allows foreign-owned or Canadian-owned companies with productions in Ontario to claim a rebate worth 21.5 per cent of labour, service and property expenditures (net of other assistance). The OFFTC allows Canadian-owned production companies based in Ontario with sufficient Canadian content to claim a rebate of 35 per cent of labour expenditures (net of other assistance).[28]
The remaining tax credits are the Ontario Interactive Digital Media Tax Credit (OIDMTC), the Ontario Computer Animation and Special Effects Tax Credit (OCASE Tax Credit) and the Ontario Book Publishing Tax Credit (OBPTC), which account for 20 per cent of planned spending in 2020-21. The OIDMTC allows Canadian companies that produce digital media products (such as digital games, mobile apps and e-learning tools for children) in Ontario to claim a rebate equal to between 35 and 40 per cent or labour expenditures. Similarly, Canadian companies can claim the OCASE Tax Credit to receive a rebate of 18 per cent of Ontario labour expenditures directly related to computer animation and special effects (net of assistance). The smallest tax credit, the OBPTC, provides a rebate of 30 per cent of qualifying pre-production, marketing and printing costs for Ontario-based book publishing companies.
Figure 13Planned Spending on Cultural Media Tax Credits, 2020-21 (millions)
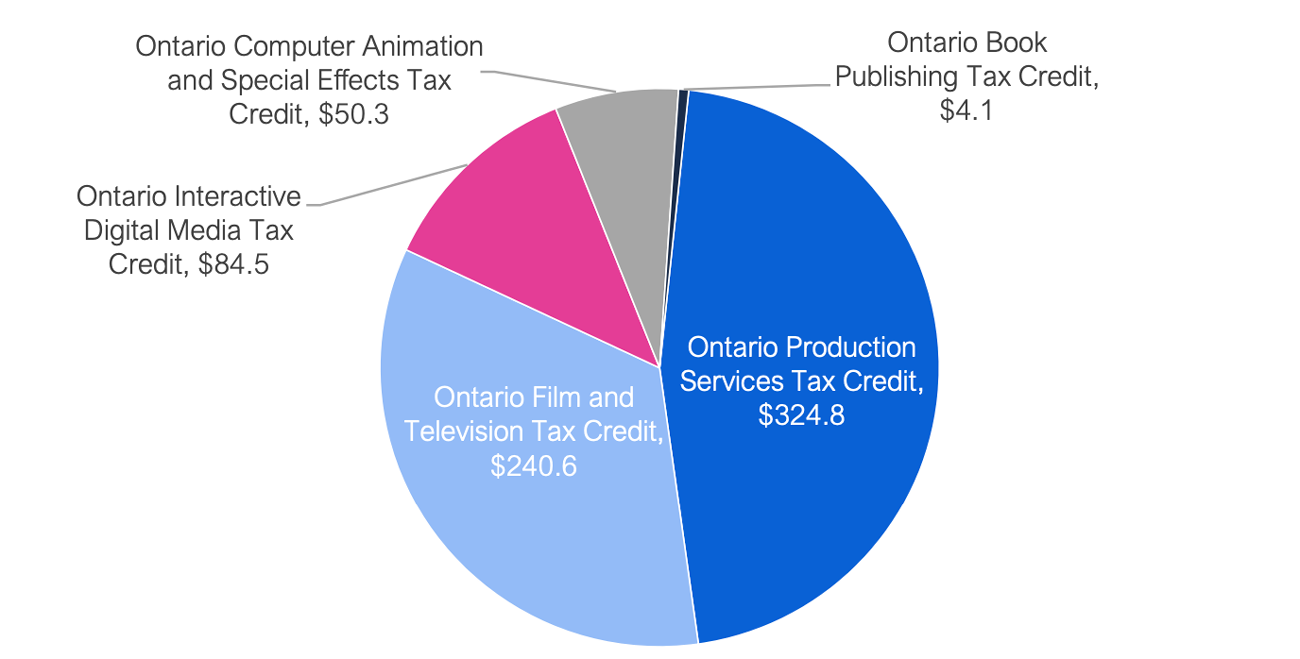
Source: 2020-21 Expenditure Estimates.
Accessible version
| Program Area | Dollars (millions) |
|---|---|
| Ontario Production Services Tax Credit | 324.8 |
| Ontario Film and Television Tax Credit | 240.6 |
| Ontario Interactive Digital Media Tax Credit | 84.5 |
| Ontario Computer Animation and Special Effects Tax Credit | 50.3 |
| Ontario Book Publishing Tax Credit | 4.1 |
COVID-19 considerations: While each cultural media tax credit has a different design, the spending on the tax credits is largely linked to industry employment. In 2019, an average of 98,000 people were employed in the media production industries, a component of the culture and heritage sector.[29] In March 2020, when travel and business restrictions were introduced in response to the COVID-19 pandemic, employment dropped to 83,000 and by May 2020, employment had declined further to 75,000.
As the Province gradually starts to reopen the economy, employment in the media production industries will begin to recover. However, the FAO projects employment will average only 86,500 in 2020, a decline of 11.6 per cent from 2019 levels. Given that ministry spending on cultural media tax credits is largely driven by industry labour costs, the ministry could experience significant savings in its cultural media tax credit program.
Agencies
The ministry is responsible for the governance and operation of 18 agencies.[30] These include tourist attractions, such as the Royal Ontario Museum and the Ontario Science Centre, as well as arts and cultural organizations and libraries. Under provincial accounting rules, all spending by the ministry’s agencies, which includes funding provided directly by the ministry and funds raised independently, is recorded as spending by the ministry.[31]
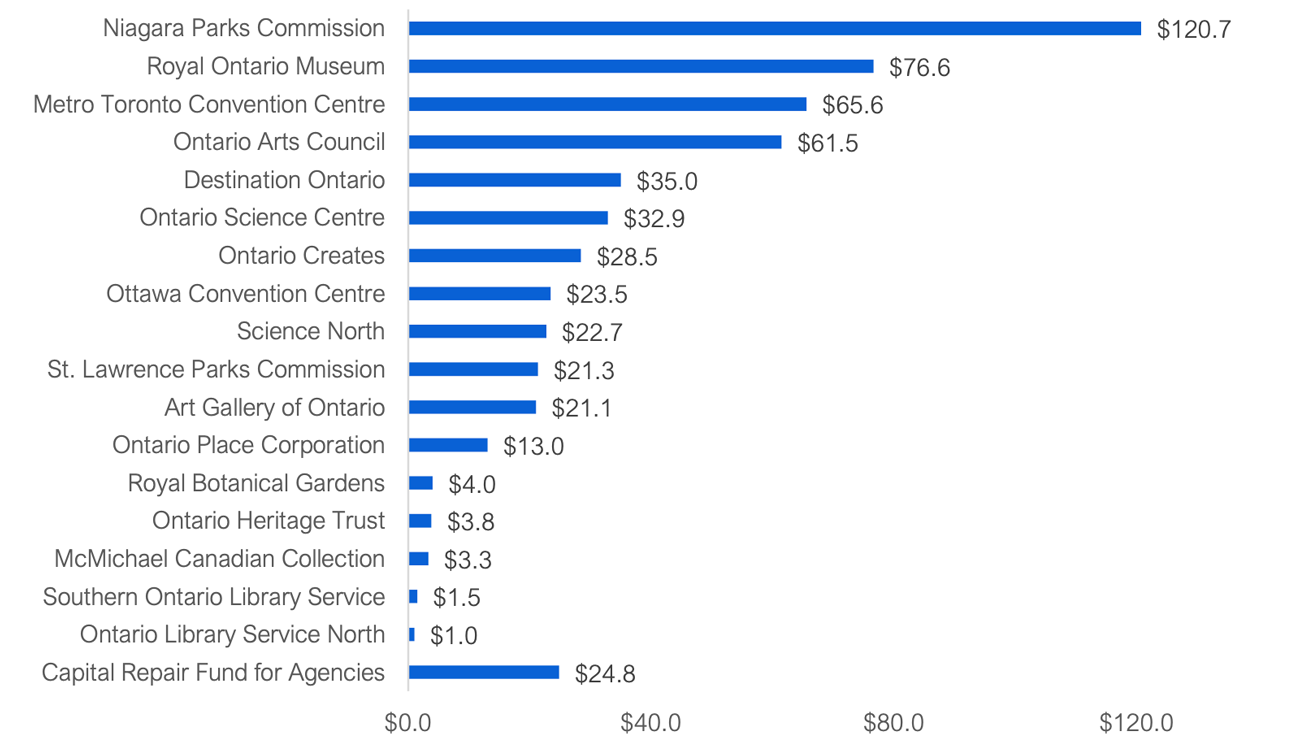
In the ministry’s 2020-21 spending plan, agencies are projected to spend $566 million. Overall, the four agencies with the largest planned spending in 2020-21, the Niagara Parks Commission ($121 million), the Royal Ontario Museum ($77 million), the Metro Toronto Convention Centre ($66 million) and the Ontario Arts Council ($62 million), represent nearly 60 per cent of total planned agencies spending for the year.
Figure 14Planned Spending by Agency, 2020-21 (millions)
Source: 2020-21 Expenditure Estimates.
Accessible version
| Agency | Dollars (millions) |
|---|---|
| Niagara Parks Commission | 120.7 |
| Royal Ontario Museum | 76.6 |
| Metro Toronto Convention Centre | 65.6 |
| Ontario Arts Council | 61.5 |
| Destination Ontario | 35.0 |
| Ontario Science Centre | 32.9 |
| Ontario Creates | 28.5 |
| Ottawa Convention Centre | 23.5 |
| Science North | 22.7 |
| St. Lawrence Parks Commission | 21.4 |
| Art Gallery of Ontario | 21.1 |
| Ontario Place Corporation | 13.1 |
| Royal Botanical Gardens | 4.0 |
| Ontario Heritage Trust | 3.8 |
| McMichael Canadian Collection | 3.3 |
| Southern Ontario Library Service | 1.5 |
| Ontario Library Service North | 1.0 |
| Capital Repair Fund for Agencies | 24.8 |
COVID-19 considerations: Under provincial accounting rules, all revenue raised by most provincial agencies is recorded as revenue of the Province and all spending by most provincial agencies is recorded as spending by the Province. In the case of the ministry’s agencies, revenue is generated from a variety of sources, including directly from the Province, admissions and sales, and investments, donations and other revenue.
Figure 15Revenue Sources for the Ministry’s Agencies, 2018-19
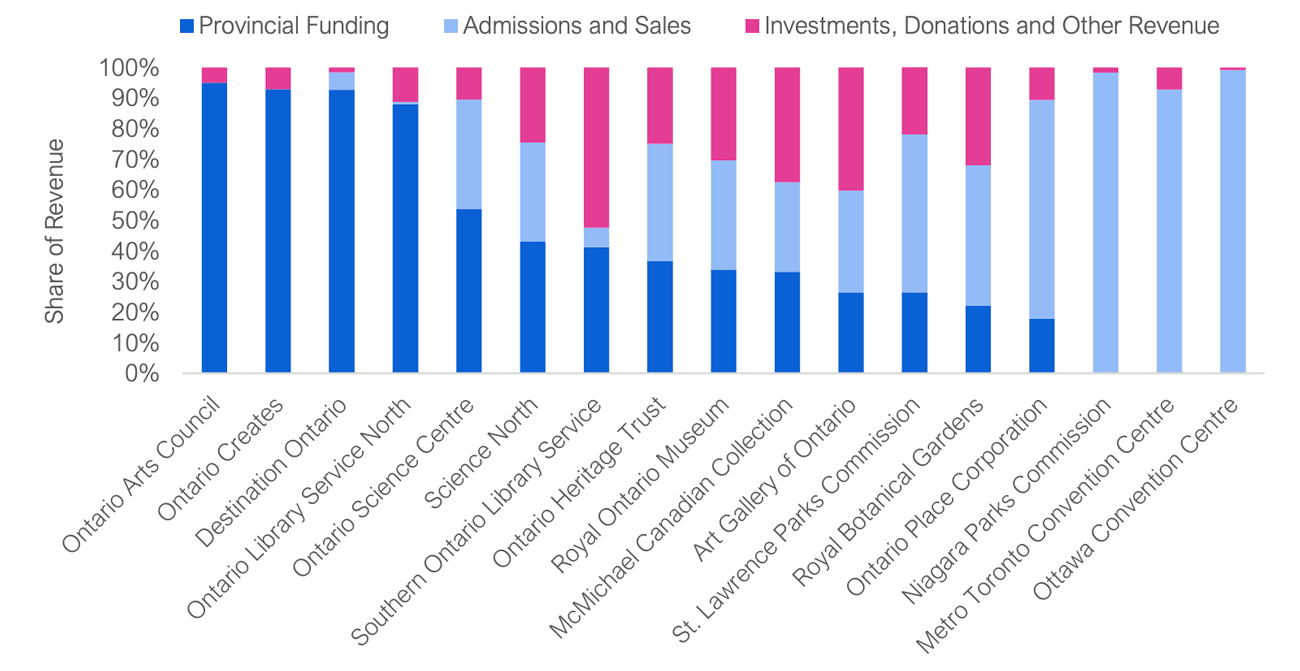
Note: The Ontario Heritage Trust, Southern Ontario Library Service and Ontario Library Service North reflect 2017-18 revenue sources, which was the most recently available information.
Source: 2017-18 and 2018-19 Annual Reports for each agency.
Accessible version
| Agency | Provincial Funding | Admissions and Sales | Investments, Donations and Other Revenue |
|---|---|---|---|
| Ontario Arts Council | 95% | 0% | 5% |
| Ontario Creates | 93% | 0% | 7% |
| Destination Ontario | 93% | 6% | 2% |
| Ontario Library Service North | 88% | 1% | 11% |
| Ontario Science Centre | 54% | 36% | 11% |
| Science North | 43% | 32% | 25% |
| Southern Ontario Library Service | 41% | 6% | 52% |
| Ontario Heritage Trust | 37% | 38% | 25% |
| Royal Ontario Museum | 34% | 36% | 30% |
| McMichael Canadian Collection | 33% | 29% | 37% |
| Art Gallery of Ontario | 26% | 33% | 40% |
| St. Lawrence Parks Commission | 26% | 52% | 22% |
| Royal Botanical Gardens | 22% | 46% | 32% |
| Ontario Place Corporation | 18% | 72% | 11% |
| Niagara Parks Commission | 0% | 98% | 2% |
| Metro Toronto Convention Centre | 0% | 93% | 7% |
| Ottawa Convention Centre | 0% | 99% | 1% |
In 2018-19, 12 of the ministry’s agencies derived most of their revenue from sources other than transfers from the Province. Only the Ontario Arts Council, Ontario Creates, Destination Ontario and Ontario Library Service North were largely dependent on ministry funding, receiving 88 to 95 per cent of their funding from the Province. On the other hand, three agencies – the Metro Toronto Convention Centre, the Ottawa Convention Centre and Niagara Parks Commission – received no funding from the Province, while nine other agencies received the majority of their revenue from sources other than the Province.
In general, the FAO expects that provincial funding will remain a reliable source of revenue for the ministry’s agencies through 2020-21. However, admissions and sales, and investments, donations and other revenue may be severely impacted by the reduction in tourism and the economic downturn resulting from the COVID-19 pandemic.
A number of agencies that depend on tourist visits are especially reliant on admissions and sales revenue. In 2018-19, the Niagara Parks Commission, the St. Lawrence Parks Commission, the Ontario Heritage Trust, the Art Gallery of Ontario, the Royal Ontario Museum and the Ontario Science Centre received at least one-third of their revenue from admissions and sales.
Similarly, agencies that are event venues rely almost entirely on sales revenue (such as facility rentals, parking fees, and food and beverage purchases).The Metro Toronto Convention Centre and the Ottawa Convention Centre, which receive no operating funding from the Province, rely on admissions and sales for 93 per cent and 99 per cent of their revenue, respectively. The Ontario Place Corporation raised 72 per cent of its revenue from admissions and sales in 2018-19. Specifically, 29 per cent of its revenue was attributable to Live Nation concerts and events. These agencies are particularly vulnerable because even as travel and business restrictions are relaxed, it is unlikely that large concerts or events will take place for most or all of 2020-21.
In general, if agencies have lower than expected revenue in 2020-21, they will not be able to fund the same level of operations as planned, which will result in lower ministry spending.[32] At the same time, there is a risk that the ministry will need to provide additional funds to its agencies to ensure that they can continue to operate.
Ontario Trillium Foundation
In 2020-21, the ministry plans to spend $132 million through the Ontario Trillium Foundation (OTF). The OTF supports community organizations by providing operating grants to establish, develop and scale projects, as well as capital grants to build and renovate community spaces. Organizations can apply for an OTF grant if their project falls under one of the OTF’s six “action areas”: fostering active lifestyles, building inclusive communities, supporting environmental sustainability, enrichment through arts, culture and heritage, supporting child and youth development and enhancing economic wellbeing. In 2019-20, the OTF awarded 601 grants.
COVID-19 considerations: As a result of the business restrictions and health and safety measures implemented to contain the COVID-19 outbreak, 2020-21 OTF spending may be less than planned. For example, OTF projects such as summer camps may be unable to operate and other grant projects may be delayed or unable to proceed.[33] Any reduced or delayed spending by the OTF would result in savings to the ministry for 2020-21.
Heritage, Tourism and Culture Programs
Heritage, tourism and culture programs include funding to support tourism, libraries, and the arts, heritage and culture industries within Ontario. Of the $87 million in planned spending in 2020-21, $25 million will support municipal library operations, regional tourism associations will receive $20 million, and $20 million will fund festivals and events such as the Shaw Festival, Hamilton Fringe Festival and Nuit Blanche Toronto.[34]
Additionally, the ministry is allocating $13 million for the heritage sector, which supports historical societies, museums and heritage associations,[35] $12 million for grants for capital projects, $7 million for the Ontario Music Fund, which provides grants to promote the development of Ontario’s music industry and support live music performances, $2 million for the arts sector and $0.5 million for tourism investment grants.
Figure 16Planned Heritage, Tourism and Culture Programs Spending, 2020-21 (millions)
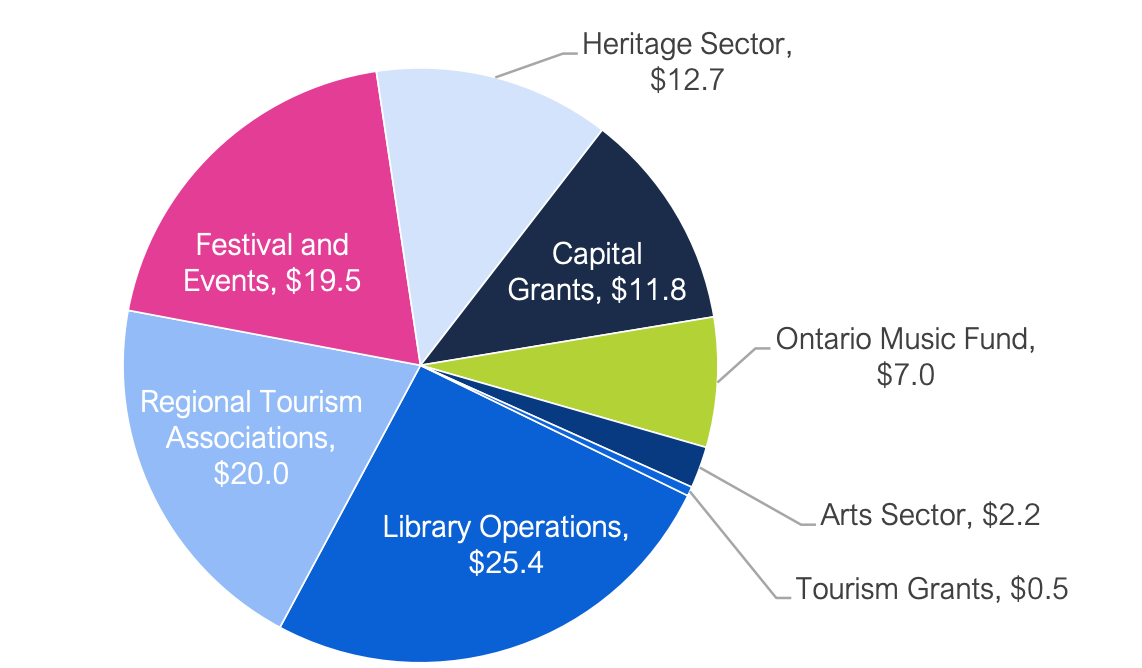
Source: 2020-21 Expenditure Estimates.
Accessible version
| Program Area | Dollars (millions) |
|---|---|
| Library Operations | 25.4 |
| Regional Tourism Associations | 20.0 |
| Festival and Events | 19.5 |
| Heritage Sector | 12.7 |
| Capital Grants | 11.8 |
| Ontario Music Fund | 7.0 |
| Arts Sector | 2.2 |
| Tourism Grants | 0.5 |
COVID-19 considerations: As a result of restrictions on gatherings across the province, major events and festivals are being delayed and cancelled.[36] The City of Toronto, for example, cancelled permits for all major events through the end of August 2020.[37] The Province announced that it will maintain its funding commitments to all events and festivals, regardless of whether the events take place.[38] However, even with stable provincial funding, the loss of admission and sales revenue may leave some event organizations struggling to recoup their costs.
Similarly, Ontario’s regional tourism associations rely on revenue from both the Province and other sources, such as municipal accommodation taxes (hotel taxes). A decline in tourism and hotel usage will result in a significant loss in revenue for regional tourism associations.[39]
Sports and Recreation Programs
The ministry plans to spend $88 million on sports and recreation programs in 2020-21. This spending consists of three programs. The province plans to spend $31 million on amateur sport, $22 million on projects to increase physical activity and fund trails, parkland and other recreation resources, and $35 million in infrastructure funding for the Canada Summer Games, scheduled to be held in the Niagara region in 2021.[40]
COVID-19 considerations: Restrictions on economic activity and events could impact sports and recreation programs spending, depending on the nature of the projects funded in 2020-21.
Ministry Operations
The ministry plans to spend $62 million in 2020-21 on operations. Ministry operations includes spending on administration and program delivery, including financial and administrative services, human resources, and communications and legal services. It also includes spending on two attractions directly operated by the Province: Fort William Historical Park and Huronia Historical Parks.
COVID-19 considerations: The majority of ministry operations spending, such as administration, communications and legal services, will not be impacted by the COVID-19 pandemic. However, if Fort William Historical Park and Huronia Historical Parks were to reduce operations as a result of restrictions on gatherings and public health concerns, this could impact ministry spending.
Expenditure Estimates Overview
In 2020-21, the Ministry of Heritage, Sport, Tourism and Culture Industries plans to spend $1,651 million. This chapter reviews the ministry’s $1,651 million spending plan as presented in the 2020-21 Expenditure Estimates by program vote and other spending.[41] For 2020-21, there were two changes to the ministry’s program vote structure. Program votes 3802 (Tourism Program) and 3805 (Culture Program) were replaced by program votes 3805 (Heritage, Tourism and Culture Programs) and 3811 (Agency Programs). In the tables below, the 2019-20 Estimates values have been adjusted to allow comparisons to 2020-21 Estimates values.
Vote 3801 – Ministry Administration Program
The Ministry Administration Program supports the delivery of all programs and services offered by the Ministry of Heritage, Sport, Tourism and Culture Industries. The total spending request for Vote 3801 is down $2 million, or 5.0 per cent versus last year’s request. The spending request decrease this year is mostly attributed to lower services expense, partially offset by a $1 million increase in salaries, wages and employee benefits. Over the last five years, the average annual growth rate for the vote was 10.1 per cent.
| Vote Item | Ministry Administration Program (Vote 3801) |
2019-20 Estimates $ millions |
2020-21 Estimates $ millions |
1 YR Change $ Millions |
1 YR Growth (%) |
5 YR Average Historical Growth (%) |
|---|---|---|---|---|---|---|
| 1 | Ministry Administration Program | |||||
| Salaries, Wages and Employee Benefits | 18 | 19 | 1 | 4.4 | 9.1 | |
| Services | 7 | 4 | -2 | -36.1 | 9.2 | |
| Other Spending | 2 | 2 | 0 | -5.0 | 39.3 | |
| Total Supply Vote | 26 | 25 | -2 | -5.0 | 10.1 |
Vote 3803 – Sport, Recreation and Community Programs
Sport, Recreation and Community Programs supports amateur sports by providing funding to organizations that promote physical activity, provide after school programs, and manage trails, parkland, open space and water-based recreation resources.
Compared to last year’s request, spending on this vote is up by $2 million in 2020-21 to $61 million. This represents growth of 3.4 per cent, higher than the five-year average growth rate of 1.9 per cent per year. This year’s increase is due to $2 million in higher spending for the Sport transfer payment, partially offset by $1 million in lower spending on services.
| Vote Item | Sport, Recreation and Community Programs (Vote 3803) |
2019-20 Estimates $ millions |
2020-21 Estimates $ millions |
1 YR Change $ Millions |
1 YR Growth (%) |
5 YR Average Historical Growth (%) |
|---|---|---|---|---|---|---|
| 1 | Sport, Recreation and Community Programs | |||||
| Active Recreation | 22 | 22 | 0 | 0.9 | -0.7 | |
| Sport | 28 | 31 | 2 | 8.5 | 5.2 | |
| Salaries, Wages and Employee Benefits | 5 | 5 | 0 | 0.0 | 6.7 | |
| Services | 2 | 2 | -1 | -25.0 | 12.8 | |
| Other Spending | 1 | 1 | 0 | 0.0 | 29.9 | |
| Total Supply Vote | 59 | 61 | 2 | 3.4 | 1.9 |
Vote 3804 -Tourism and Culture Capital Program
The Tourism and Culture Capital Program makes capital investments in the tourism and culture sectors to support repair and rehabilitation programs. This program also supports the redevelopment of Ontario Place.
Compared to last year’s spending request, spending on this vote is expected to grow by $33 million in 2020-21 to $102 million. This represents growth of 47.6 per cent, significantly higher than the five-year annual average growth rate of 27.4 per cent. This year’s increase in spending is largely due to the new Grants in Support of Sport and Recreation program, which is intended to support the 2021 Canada Summer Games in the Niagara region.[42]
For 2020-21, spending for Ontario Place Revitalization has been reclassified as services spending, with a net budget increase of $2 million. Lastly, the Grants in Support of Culture and Repairs and Rehabilitation Capital programs each received $2 million budget reductions for 2020-21.
| Vote Item | Tourism and Culture Capital Program (Vote 3804) |
2019-20 Estimates $ millions |
2020-21 Estimates $ millions |
1 YR Change $ Millions |
1 YR Growth (%) |
5 YR Average Historical Growth (%) |
|---|---|---|---|---|---|---|
| 1 | Tourism and Culture Capital Program | |||||
| Grants in Support of Culture | 14 | 12 | -2 | -15.5 | 18.8 | |
| Ontario Place Revitalization | 23 | 0 | -23 | -100.0 | NA | |
| Repairs and Rehabilitation Capital | 27 | 25 | -2 | -6.5 | 14.7 | |
| Grants in Support of Sport and Recreation | 0 | 35 | 35 | 100.0 | NA | |
| Services | 5 | 30 | 25 | 474.8 | 58.5 | |
| Total Supply Vote | 69 | 102 | 33 | 47.6 | 27.4 |
Vote 3805 – Heritage, Tourism and Culture Programs
The Heritage, Tourism and Culture Programs is responsible for supporting arts, cultural industries, archaeology, museums, heritage, public libraries and tourism in Ontario. The program also provides support to creative industries such as film, television, book and magazine publishing, music recording, and digital media. Finally, the program supports regional planning and economic development through Regional Tourism Organizations.
Compared to last year’s spending request, spending for this vote is expected to decline by $10 million in 2020-21, or 9.5 per cent, to $95 million. Over the last five years, spending on this program has been decreasing at an average annual rate of 7.1 per cent.
The decline this year is primarily due to lower funding for Arts Sector Support (-$4 million), Grants in Support for Tourism Regions (-$4 million), and Festivals & Events (-$1 million). The ministry also plans to spend $2 million less on services in 2020-21.
| Vote Item | Heritage, Tourism and Culture Programs (Vote 3805) |
2019-20 Estimates $ millions |
2020-21 Estimates $ millions |
1 YR Change $ Millions |
1 YR Growth (%) |
5 YR Average Historical Growth (%) |
|---|---|---|---|---|---|---|
| 1 | Heritage, Tourism and Culture Programs | |||||
| Grants in Support for Tourism Regions | 24 | 20 | -4 | -16.3 | -12.9 | |
| Festivals & Events | 20 | 20 | -1 | -2.5 | 0.0 | |
| Grants in Support of Tourism Investment Development | 1 | 1 | 0 | 0.0 | -40.8 | |
| Arts Sector Support | 7 | 2 | -4 | -65.8 | -24.2 | |
| Heritage Sector Support | 6 | 6 | 0 | 0.0 | -1.4 | |
| Libraries Sector Support | 25 | 25 | 0 | 0.0 | 1.3 | |
| Ontario Music Fund | 7 | 7 | 0 | 0.0 | -14.1 | |
| Salaries, Wages and Employee Benefits | 12 | 12 | 0 | -0.2 | 0.6 | |
| Services | 2 | 1 | -2 | -74.4 | -30.9 | |
| Other Spending | 1 | 1 | 0 | 48.0 | 1.6 | |
| Total Supply Vote | 105 | 95 | -10 | -9.5 | -7.1 |
Vote 3806 – Ontario Trillium Foundation Program
The Ontario Trillium Foundation Program supports Ontario’s voluntary sector, through investments in community-based initiatives. Spending on this vote is expected to remain unchanged compared to last year’s request at $103 million.
| Vote Item | Ontario Trillium Foundation Program (Vote 3806) |
2019-20 Estimates $ millions |
2020-21 Estimates $ millions |
1 YR Change $ Millions |
1 YR Growth (%) |
5 YR Average Historical Growth (%) |
|---|---|---|---|---|---|---|
| 1 | Ontario Trillium Foundation Program | |||||
| Ontario Trillium Foundation | 103 | 103 | 0 | 0.0 | -2.1 | |
| Total Supply Vote | 103 | 103 | 0 | 0.0 | -2.1 |
Vote 3808 – Ontario Cultural Media Tax Credits
Ontario’s cultural media tax credits provide incentives and support for Ontario-based companies to produce films, television programs, interactive digital media products or books in Ontario. The Canada Revenue Agency administers the tax credits on behalf of Ontario.
Compared to last year’s spending request, spending on this vote is expected to increase by $90 million in 2020-21 to $704 million. This represents growth of 14.7 per cent, significantly higher than the 3.4 per cent average annual increase experienced over the last five years.
| Vote Item | Ontario cultural media tax credits (Vote 3808) |
2019-20 Estimates $ millions |
2020-21 Estimates $ millions |
1 YR Change $ Millions |
1 YR Growth (%) |
5 YR Average Historical Growth (%) |
|---|---|---|---|---|---|---|
| 1 | Ontario cultural media tax credits | |||||
| Ontario Book Publishing Tax Credit | 4 | 4 | 1 | 16.0 | 6.8 | |
| Ontario Computer Animation and Special Effects Tax Credit | 42 | 50 | 8 | 19.6 | 2.1 | |
| Ontario Interactive Digital Media Tax Credit | 82 | 84 | 3 | 3.4 | -13.1 | |
| Ontario Film and Television Tax Credit | 207 | 241 | 33 | 16.1 | 30.3 | |
| Ontario Production Services Tax Credit | 280 | 325 | 45 | 16.2 | 0.6 | |
| Total Supply Vote | 614 | 704 | 90 | 14.7 | 3.4 |
Vote 3811 – Agency Programs
The Province is responsible for the governance, appointments and accountability of 18 provincial agencies and two directly operated attractions: Fort William Historical Park and Huronia Historical Parks. Fourteen of the ministry’s agencies receive direct support from the Province through the Agency Programs vote.[43]
Compared to last year’s spending request, spending on this vote is expected to increase by $5 million to $240 million, an increase of 2.3 per cent. This increase is driven by the creation of the Heritage Initiative program ($7 million), which is partially offset by lower spending for the Ontario Media Development Corporation (Ontario Creates) (-$2 million). The ministry has also increased planned spending for salaries, wages and employee benefits by $1 million and reduced planned spending on services by $1 million.
| Vote Item | Agency Programs (Vote 3811) |
2019-20 Estimates $ millions |
2020-21 Estimates $ millions |
1 YR Change $ Millions |
1 YR Growth (%) |
5 YR Average Historical Growth (%) |
|---|---|---|---|---|---|---|
| 1 | Agency Programs | |||||
| McMichael Canadian Collection | 3 | 3 | 0 | 0.0 | 0.0 | |
| Ontario Arts Council | 60 | 60 | 0 | 0.0 | 0.0 | |
| Ontario Media Development Corporation | 30 | 28 | -2 | -5.0 | 0.0 | |
| Ontario Heritage Trust | 4 | 4 | 0 | 0.0 | -1.4 | |
| Ontario Science Centre | 19 | 19 | 0 | 0.0 | 0.0 | |
| Royal Botanical Gardens | 4 | 4 | 0 | 0.0 | 0.0. | |
| Royal Ontario Museum | 27 | 27 | 0 | 0.0 | 0.0 | |
| Science North | 7 | 7 | 0 | 0.0 | 0.0 | |
| Southern Ontario Library Service | 2 | 2 | 0 | 0.0 | -13.8 | |
| Ontario Library Service North | 1 | 1 | 0 | 0.0 | -8.7 | |
| St. Lawrence Parks Commission | 7 | 7 | 0 | 0.0 | 0.0 | |
| Ontario Place Corporation | 2 | 2 | 0 | 0.0 | 5.0 | |
| Ontario Tourism Marketing Partnership Corp. | 33 | 33 | 0 | 0.0 | -5.6 | |
| Heritage Initiative | 0 | 7 | 7 | 100.0 | NA | |
| Art Gallery of Ontario | 21 | 21 | 0 | 0.0 | 0.0 | |
| Salaries, Wages and Employee Benefits | 10 | 11 | 1 | 5.1 | -0.1 | |
| Services | 3 | 2 | -1 | -22.1 | -5.0 | |
| Other Spending | 1 | 1 | 0 | 1.0 | 34.0 | |
| Total Supply Vote | 235 | 240 | 5 | 2.3 | -0.5 |
Other Spending
The financial results of government organizations controlled by the Province, including provincial agencies, are consolidated into the financial results of the Province. Adjustments are made through “other spending” to account for spending by agencies from sources other than transfer payments from the Province.[44] Other spending (operating and capital) reflects spending adjustments for 11 agencies under the purview of the Ministry of Heritage, Sport, Tourism and Culture Industries. In addition, other spending includes fiscally neutral adjustments for the General Real Estate Portfolio (GREP) to show spending in connection with government buildings consolidated by the Ministry of Government and Consumer Services.[45]
Other spending (operating) is projected to increase by $33 million versus last year, an increase of 12.1 per cent. About half of this increase ($17 million) is from the consolidation of the St. Lawrence Parks Commission beginning in 2020-21.[46] The remaining $16 million net increase is for projected changes in operating spending by agencies from sources other than transfer payments from the ministry and for GREP.
Other spending (capital) is projected to remain largely unchanged versus last year. Note that for 2020-21, the other spending adjustment for the Ontario Place Corporation has largely been reclassified as a GREP adjustment. The remaining year-over-year changes in projected spending for all other agencies is between $2 million and -$2 million.
| Other Spending | 2019-20 Estimates $ millions |
2020-21 Estimates $ millions |
1 YR Change $ Millions |
1 YR Growth (%) |
5 YR Average Historical Growth (%) |
|
|---|---|---|---|---|---|---|
| Ontario Place Corporation | 10 | 10 | 0 | 4.5 | 1.9 | |
| Metro Toronto Convention Centre | 53 | 55 | 2 | 3.1 | 3.4 | |
| Ontario Tourism Marketing Partnership Corporation | -1 | 1 | 2 | 226.8 | 27.1 | |
| Ontario Science Centre | 8 | 11 | 4 | 47.0 | 2.7 | |
| Ontario Trillium Foundation | 30 | 29 | -2 | 5.6 | 267.9 | |
| Royal Ontario Museum | 46 | 42 | -3 | 7.4 | 7.0 | |
| Ontario Arts Council | 1 | 1 | 1 | 85.4 | 0.4 | |
| Niagara Parks Commission | 102 | 107 | 5 | 5.1 | 5.6 | |
| Ottawa Convention Centre | 17 | 18 | 1 | 7.0 | 3.4 | |
| Science North | 11 | 13 | 2 | 16.2 | NA | |
| St. Lawrence Parks | 0 | 17 | 17 | 100.0 | NA | |
| General Real Estate Portfolio | -5 | -0 | 4 | 95.1 | NA | |
| Total Operating | 271 | 304 | 33 | 12.1 | -8.6 |
| Other Spending | 2019-20 Estimates $ millions |
2020-21 Estimates $ millions |
1 YR Change $ Millions |
1 YR Growth (%) |
5 YR Average Historical Growth (%) |
|
|---|---|---|---|---|---|---|
| Ontario Place Corporation | -18 | 1 | 19 | 104.4 | 1.9 | |
| Metro Toronto Convention Centre | 11 | 11 | 0 | 4.4 | 4.5 | |
| Ontario Tourism Marketing Partnership Corporation | 2 | 1 | -1 | 56.6 | 13.6 | |
| Ontario Science Centre | 1 | 2 | 2 | 225.5 | 17.0 | |
| Ontario Trillium Foundation | 0 | 0 | -0 | 40.5 | 12.6 | |
| Royal Ontario Museum | 8 | 7 | -0 | 5.9 | 6.7 | |
| Ontario Arts Council | 0 | 0 | -0 | 30.8 | 10.4 | |
| Niagara Parks Commission | 12 | 14 | 2 | 16.4 | 16.2 | |
| Ottawa Convention Centre | 6 | 6 | 0 | 3.2 | 1.5 | |
| St. Lawrence Parks | 0 | -2 | -2 | NA | NA | |
| Science North | 2 | 3 | 1 | 37.2 | NA | |
| General Real Estate Portfolio | -5 | -25 | -20 | 379.5 | NA | |
| Total Capital | 18 | 17 | 0 | -2.3 | -15.5 |
Appendix
Real-time Statistics on Tourism-Related Activities in Ontario
Economic indicators typically lag real-time events by months or years. To provide an up-to-date snapshot of the impact of the COVID-19 pandemic on Ontario’s tourism sector, this appendix presents near real-time statistics on business and personal activity in Ontario collected from a variety of sources.
Aircraft Movement
In January 2020, aircraft made over 68,000 departures and landings in Ontario airports, with nearly two-thirds of aircrafts flying domestically, 25 per cent flying to the US and the remaining 12 per cent to overseas destinations. Starting March 2020, travel and other restrictions were imposed in Canada and globally, leading to the number of flights falling significantly. By April 2020, the number of overseas flights fell by 88 per cent, flights to the US by 87 per cent, and to other parts of Canada by 62 per cent compared to January levels.
In May, aircraft movement to domestic destinations increased by 44 per cent, suggesting that domestic airline travel is beginning to recover. However, flights to the US and overseas destinations remained at April 2020 lows.
Figure 17 Aircraft Movement in Ontario by Type
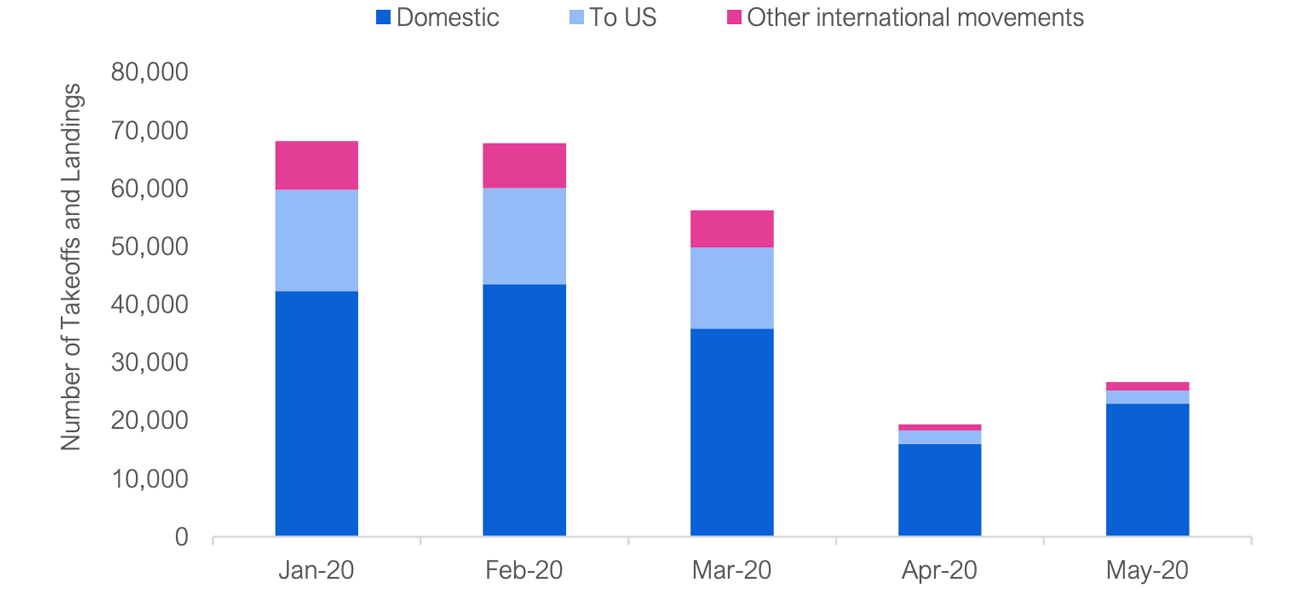
Source: FAO and Statistics Canada.
Accessible version
| Month | Domestic | To US | Other International Movements |
|---|---|---|---|
| January | 42,250 | 17,428 | 8,405 |
| February | 43,456 | 16,526 | 7,746 |
| March | 35,831 | 13,935 | 6,404 |
| April | 15,919 | 2,349 | 1,038 |
| May | 22,924 | 2,227 | 1,467 |
Restaurant Bookings
Starting March 17, restaurants in Ontario were no longer allowed to serve dine-in customers due to the state of emergency.[47] As a result, the number of restaurant bookings fell by 100 per cent compared to the year before, a trend similar to that of other provinces.
The number of restaurant bookings in Ontario, Quebec, British Columbia and Alberta remained flat – at zero – until May 14 when bookings began in Alberta, followed by British Columbia on May 19. Since then, Alberta and British Columbia have experienced increases in activity, and are now approximately 40 to 50 per cent below last year’s levels.
During the month of June, Ontario permitted restaurants in most regions (other than Peel, Toronto and Windsor-Essex) to begin serving dine-in customers in outdoor settings, resulting in an increase in online restaurant bookings.[48] However, as of June 21, restaurant bookings in Ontario remained 84 per cent below last year’s levels.
Figure 18 Year-Over-Year Change in Restaurant Bookings by Province
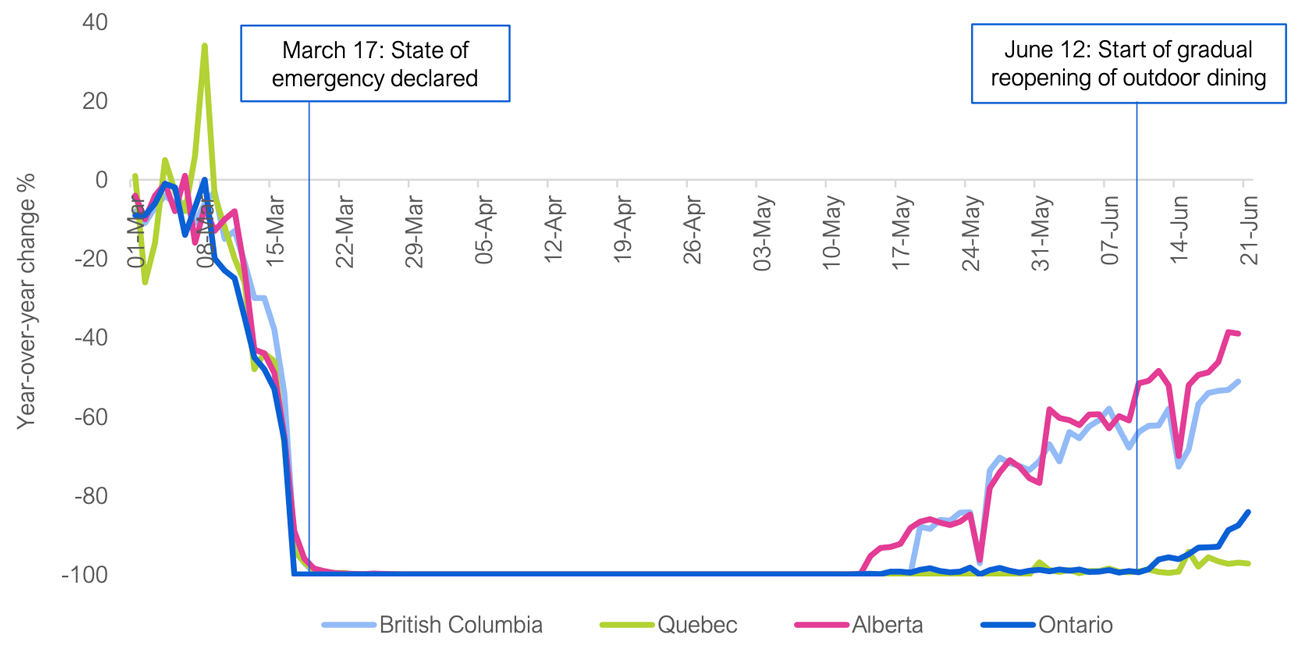
Source: OpenTable.
Accessible version
| Month | British Columbia | Quebec | Alberta | Ontario |
|---|---|---|---|---|
| March | -56.5 | -56.9 | -57.6 | -60.1 |
| April | -100.0 | -100.0 | -100.0 | -100.0 |
| May | -91.9 | -99.9 | -91.1 | -99.5 |
| June | -61.8 | -98.4 | -54.6 | -96.4 |
Mobility Trends in Ontario
The volume of drivers on the road was significantly reduced in March 2020. Based on Apple’s Mobility Trends data, which publishes trends on requests for navigation directions,[49] Ontarians drove 60 per cent less by the beginning of April than they did in the week of March 4. Interestingly, by June 7, requests for navigation directions had largely recovered.
Figure 19 Driving Trends in Ontario
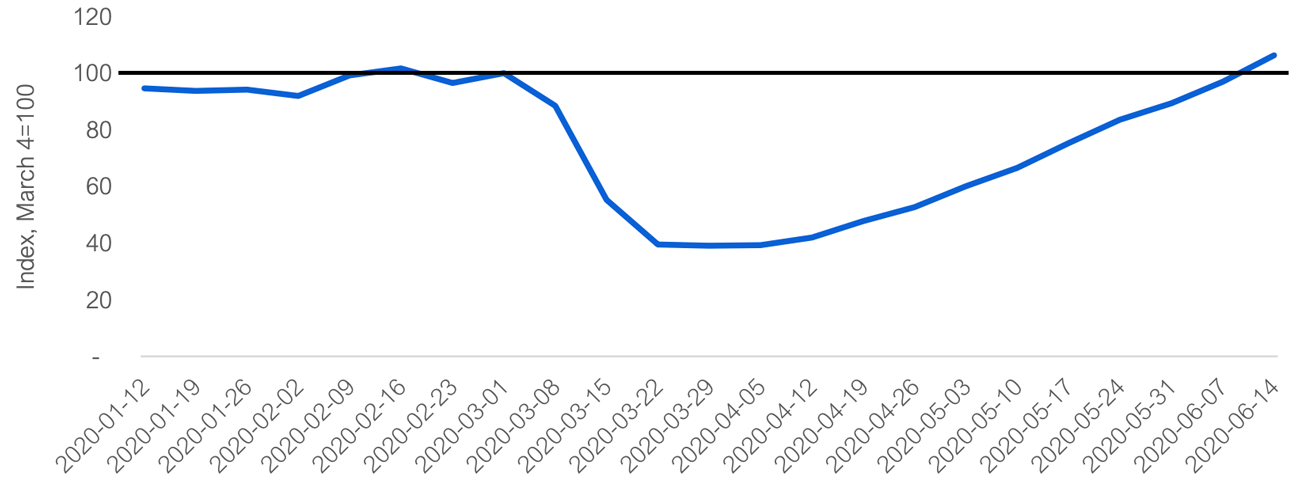
Note: 100 represents the level of requests for navigation directions on March 4, 2020.
Source: Apple Mobility Trends.
Accessible version
| Week | Index, March 4 = 100 |
|---|---|
| Jan 12-Jan 19 | 95 |
| Jan 19-Jan 26 | 94 |
| Jan 26 – Feb 02 | 94 |
| Feb 02- Feb 9 | 92 |
| Feb 9-Feb 16 | 99 |
| Feb 16-Feb 23 | 102 |
| Feb 23-Mar 01 | 97 |
| Mar 01-Mar 08 | 100 |
| Mar 08-Mar 15 | 88 |
| Mar 15-Mar 22 | 55 |
| Mar 22-Mar 29 | 39 |
| Mar 29-April 5 | 39 |
| April 5-April 12 | 39 |
| April 12-April 19 | 42 |
| April 19-April 26 | 48 |
| April 26-May 03 | 53 |
| May 03-May 10 | 60 |
| May 10-May 17 | 67 |
| May 17-May 24 | 75 |
| May 24-May 31 | 84 |
| May 31-June 07 | 89 |
| June 7-June 14 | 97 |
| June 14-June 21 | 106 |
In two of Ontario’s major cities, Toronto and Ottawa, driving and walking activity fell by the same rate in March, by approximately 60 per cent. However, public transit use experienced a steeper decline, falling by approximately 80 per cent compared to pre-COVID-19 levels.
Figure 20 Mobility Trends in Major Ontario Cities
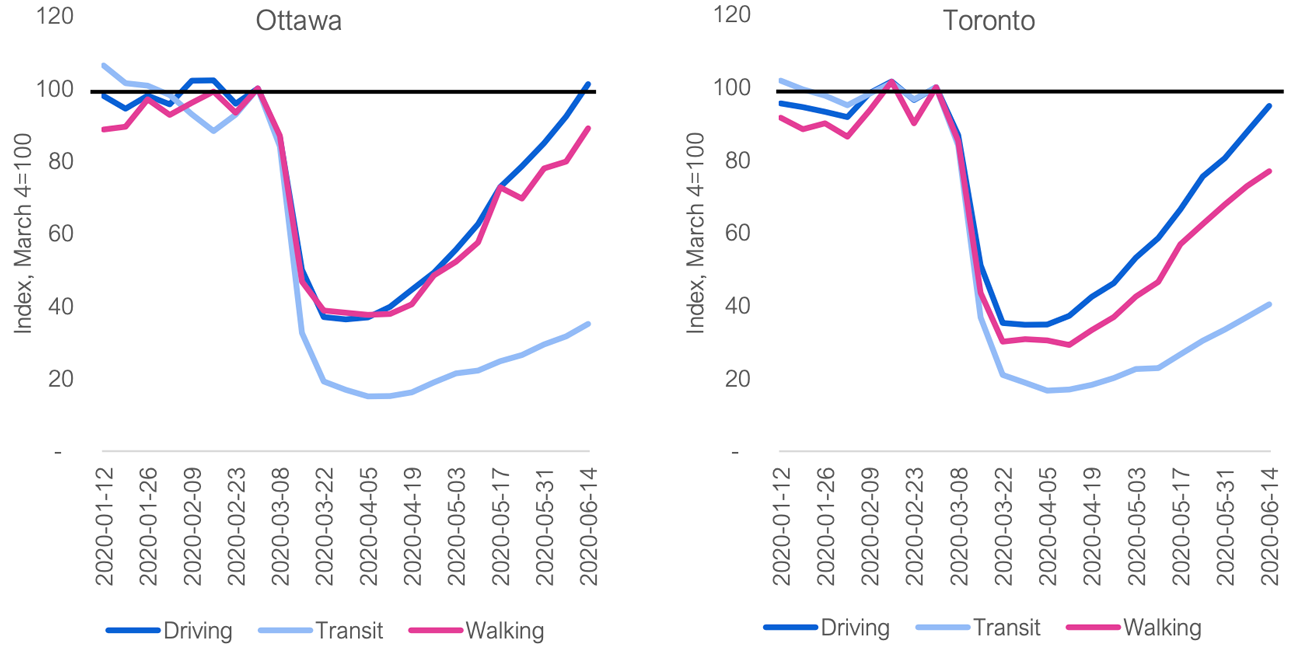
Source: Apple Mobility Trends Reports.
Accessible version
| Week | Ottawa | Toronto | ||||
|---|---|---|---|---|---|---|
| Driving | Transit | Walking | Driving | Transit | Walking | |
| Jan 12-Jan 19 | 97.9 | 106.3 | 88.6 | 95.5 | 101.8 | 91.6 |
| Jan 19-Jan 26 | 94.4 | 101.4 | 89.4 | 94.5 | 99.4 | 88.4 |
| Jan 26 – Feb 02 | 98.0 | 100.7 | 97.0 | 93.2 | 97.6 | 90.1 |
| Feb 02- Feb 9 | 95.6 | 98.1 | 92.7 | 91.7 | 95.0 | 86.4 |
| Feb 9-Feb 16 | 102.1 | 92.9 | 96.0 | 98.3 | 98.2 | 93.5 |
| Feb 16-Feb 23 | 102.2 | 88.2 | 99.1 | 96.5 | 100.0 | 85.2 |
| Feb 23-Mar 01 | 95.8 | 92.8 | 93.3 | 96.5 | 96.7 | 90.0 |
| Mar 01-Mar 08 | 100.0 | 100.0 | 100.0 | 100.0 | 100.0 | 100.0 |
| Mar 08-Mar 15 | 86.5 | 84.0 | 86.9 | 86.8 | 84.0 | 85.2 |
| Mar 15-Mar 22 | 50.0 | 32.6 | 46.7 | 51.2 | 36.8 | 43.5 |
| Mar 22-Mar 29 | 36.9 | 19.2 | 38.8 | 35.3 | 21.0 | 30.1 |
| Mar 29-April 5 | 36.3 | 16.9 | 38.2 | 34.7 | 18.8 | 30.8 |
| April 5-April 12 | 36.9 | 15.1 | 37.6 | 34.8 | 16.6 | 30.4 |
| April 12-April 19 | 39.8 | 15.2 | 37.8 | 37.2 | 17.0 | 29.2 |
| April 19-April 26 | 44.5 | 16.2 | 40.4 | 42.4 | 18.2 | 33.2 |
| April 26-May 03 | 49.2 | 18.9 | 48.4 | 46.1 | 20.1 | 36.9 |
| May 03-May 10 | 55.5 | 21.4 | 52.2 | 58.6 | 26.6 | 62.4 |
| May 10-May 17 | 62.6 | 22.2 | 57.5 | 58.6 | 22.8 | 46.5 |
| May 17-May 24 | 72.8 | 24.8 | 72.7 | 66.4 | 26.6 | 56.8 |
| May 24-May 31 | 78.5 | 26.5 | 69.6 | 75.5 | 30.3 | 62.4 |
| May 31-June 07 | 84.9 | 29.4 | 77.9 | 80.5 | 33.4 | 67.8 |
| June 7-June 14 | 92.2 | 31.7 | 79.8 | 87.6 | 36.8 | 72.8 |
| June 14-June 21 | 101.2 | 35.0 | 89.0 | 94.8 | 40.3 | 76.9 |
Since the beginning of April, driving and walking activity in Ottawa and Toronto has steadily increased. However, public transit use remains low, approximately 60 to 65 per cent below pre-crisis levels.
Footnotes
[1] See Government motions for more information.
[2] See Volume 1 of the 2020-21 Expenditure Estimates.
[3] On March 19, the Legislative Assembly moved that “Standing Committees remain adjourned until the Government House Leader indicates to the Speaker that it is in the public interest for Standing Committees to meet.” As of the writing of this report, the SCE remains adjourned. If the SCE does not deliver a report to the legislature by the third Thursday in November, then the Estimates are deemed to be passed by the SCE. Standing Orders of the Legislative Assembly of Ontario (SO 63(b)). For more details, see Government motions.
[4] FAO estimates are based on data from the Ministry of Heritage, Sport, Tourism and Culture Industries and Statistics Canada.
[5] Indirect impact represents the impact of tourism, culture and heritage businesses purchasing goods or services from other industries (i.e., restaurants purchasing products from agricultural industries).
[6] Touristic trips by Ontario residents must be an out-of-town trip with a distance of at least 40 kilometers for any reason excluding trips for work, school and regular shopping. More details available at http://www.mtc.gov.on.ca/en/research/historicalstats/concepts_and_definitions_2014.pdf.
[7] This excludes $9.3 billion spent by tourists in Ontario on their way to out-of-province destinations and also commissions and fees earned by travel arrangement businesses located in Ontario for out-of-province trips.
[8] Based on the Ministry of Heritage, Sport, Tourism and Culture Industries’ definition (2014), these sectors are accommodation, food and beverage services, arts, entertainment and recreation, retail, transportation, travel services, and other services. http://www.mtc.gov.on.ca/en/research/historicalstats/concepts_and_definitions_2014.pdf.
[9] Based on Statistics Canada’s input-output multipliers. Direct impact on sectors represents the impact to front-line businesses such as restaurants or hotels and the indirect impact represents the impact of these tourism-connected businesses purchasing goods or services from other industries (i.e., restaurants purchasing products from agricultural industries).
[10] The FAO estimates that tourism directly supported 16,000 jobs in the culture and heritage sector, mainly in performance arts and heritage institutions.
[11] The economic impact of tourism depends on a number of factors. Estimates range from a direct impact of 225,000 jobs and $12.1 billion in GDP in 2014 by Statistics Canada to 401,000 jobs and $35 billion in GDP (represents direct, indirect and induced impacts) in 2017 by the Ministry of Heritage, Sport, Tourism and Culture Industries.
[12] Total employment represents non-farm payroll employees, as measured by the Survey of Employment, Payroll and Hours.
[13] For example, the manufacturing and construction industries provide support to the film and recording sector.
[14] https://www.canada.ca/en/immigration-refugees-citizenship/services/coronavirus-covid19/travel-restrictions-exemptions.html.
[15] In addition to lower employment, there was a substantial reduction in the average number of hours worked. In Ontario’s Job Market during the COVID-19 Pandemic, the FAO noted that in April, 1.1 million jobs were lost across all sectors and 1.1 million workers experienced a sharp reduction in the number of hours worked.
[16] http://www.amo.on.ca/AMO-PDFs/COVID19/2020-March-23-Essential-Services-List.aspx.
[17] https://files.ontario.ca/mof-detailed-list-stage-1-openings-en-2020-05-14.pdf?_ga=2.73684113.2059569216.1591641174-1469682582.1578368227.
[18] As of June 24, only Windsor-Essex remains in Stage 1 of the recovery plan. https://news.ontario.ca/opo/en/2020/06/ontario-moving-toronto-and-peel-region-into-stage-2.html.
[19] https://www.ontario.ca/page/framework-reopening-our-province-stage-2#section-8.
[20] FAO, “Economic and Budget Outlook,” Spring 2020.
[21] The Province’s plan to reopen the economy and phase-out restrictions involves a three-stage approach. Stage 1 is a very limited reopening that allows businesses with storefront entrances to reopen, some outdoor activities, such as golfing, to resume, and some media operations to resume. Stage 2 allows social gatherings of up to 10 people, the reopening of outdoor restaurant services, including patios, shopping malls (under existing restrictions), most outdoor recreational facilities and attractions and heritage institutions (with restrictions), and the resumption of film and television production. Stage 3 is the reopening of remaining businesses, with continued restrictions on large gatherings.
[22] https://www.cbc.ca/news/canada/toronto/covid-19-coronavirus-update-may-7-cottage-country-1.5559182.
[23] https://news.ontario.ca/opo/en/2020/06/ontario-permits-more-businesses-and-services-to-reopen-in-the-coming-days.html?utm_source=digest&utm_medium=email&utm_campaign=p. See also https://www.ontario.ca/page/framework-reopening-our-province-stage-2#section-7.
[24] FAO estimate based on data from MHSTCI, http://www.mtc.gov.on.ca/en/research/historicalstats/historical_statistics_tables.shtml.
[25] The FAO estimated that under maximum occupancy, the physical distance between people seated in a theatre is approximately 0.7 meters and sports stadiums is 0.2 metres. See FAO, “Ontario Health Sector: A Preliminary Review of the Impact of the COVID-19 Outbreak on Hospital Capacity,” 2020, p. 22.
[26] Excludes spending in 2015-16 and 2016-17 on the 2015 Pan American Games.
[27] Ministry spending by these categories is reviewed in the next chapter.
[28] The OFTTC rebate amount varies based on specific criteria. For example, first-time productions can claim an OFFTC rebate equal to 40 per cent of labour costs for the first $240,000 in costs and 35 per cent for any costs above $240,000. For more information on the Ontario Film and Television Tax Credit and the Ontario Production Services Tax Credit, see FAO, “Business Support Programs: The Effectiveness of Ontario’s Business Support Programs,” 2018.
[29] See Economic Context chapter for more information.
[30] Including the Ontario Trillium Foundation, which is discussed in the next section.
[31] There are four exceptions. The financial results of the Art Gallery of Ontario, the Royal Botanical Gardens, Ontario Library Service North and Southern Ontario Library Service are not consolidated with the financial accounts of the Province and so only funding transfers from the ministry to these organizations are recorded as spending by the ministry.
[32] The Province would also record a corresponding reduction in agency revenues.
[33] MHSTCI noted to the FAO that the ministry is committed to providing grant recipients with flexibility on project timelines, deliverables, reporting and completion dates.
[34] For a list of festivals and events receiving funding in 2020-21, see: http://www.mtc.gov.on.ca/en/awards_funding/CO2020%20Successful%20List%20EN.pdf.
[35] Includes $7 million for the Heritage Initiative.
[36] As of the writing of this report, gatherings in Ontario, with the exception of funerals or weddings, are limited to 10 people.
[37] https://www.toronto.ca/news/city-of-toronto-extends-cancellation-of-permits-for-major-festivals-and-launches-recovery-program-for-events/.
[38] https://www.cbc.ca/news/canada/hamilton/ontario-festival-funding-covid-19-1.5547938.
[39] The federal government has committed $30 million to support regional tourism associations in Southern Ontario. https://www.canada.ca/en/economic-development-southern-ontario/news/2020/05/feddev-ontario-supports-tourism-and-recovery-efforts-across-southern-ontario.html.
[40] Funded through the Investing in Canada Infrastructure Program (ICIP), which is a federal-provincial-municipal cost-sharing program.
[41] The ministry also plans to spend $103,360 in statutory spending. This spending is not reviewed in this chapter.
[42] Funding is provided under the Investing in Canada Infrastructure Program (ICIP), which is a federal-provincial-municipal cost-sharing program.
[43] See previous chapter for more information.
[44] See previous chapter for more information.
[45] The Ministry of Government and Consumer Services is responsible for managing the Province’s real estate portfolio.
[46] While the Province has historically and continues to provide funding to the St. Lawrence Parks Commission, the agency’s financial statements were only consolidated into the Province’s financial statements beginning in 2020-21. Public Sector Accounting Standards (PSAS) includes a series of tests to determine if an entity is consolidated, including materiality, measurability, and whether the consolidating entity (i.e., the Province) has control of the consolidated entity’s economic benefit.
[47] Restaurants could still serve take-out customers.
[48] On June 24, restaurants in Peel and Toronto will be allowed to serve dine-in customers in outdoor settings, leaving Windsor-Essex as the only region closed to dine-in customers.
[49] https://www.apple.com/covid19/mobility.
[LN1]Fix bottom border; make it thin