


1 | Summary
- This report provides an overview of municipal budgets in 2018,[1] estimates the financial impact of the COVID-19 pandemic on municipalities in 2020 and 2021, and assesses the adequacy of federal-provincial financial support to municipalities.
Overview of Municipal Budgets Prior to the COVID-19 Outbreak
- Prior to the COVID-19 outbreak, municipalities had relatively strong budget positions, in aggregate, due to legislated restrictions on long-term borrowing and requirements that municipalities plan to have a cash operating balanced budget every year.
- Ontario’s municipalities recorded a combined budget surplus of $7.4 billion in 2018.[2] Over the past 10 years, municipalities have consistently recorded budget surpluses, rising from a combined $3.6 billion in 2009 to $7.4 billion in 2018. In contrast, the Province recorded budget deficits each year over the same 10-year period, including deficits of $19.3 billion in 2009-10 and $7.4 billion in 2018-19.
- The FAO estimates that most of the budget surpluses over the last 10 years have financed investments in infrastructure assets.
- In 2018, municipalities generated a combined total of $54.3 billion in revenue. Since 2009, revenue has grown at an annual average of 3.8 per cent, from $38.9 billion to $54.3 billion in 2018. This is moderately slower than nominal economic growth, which averaged 4.1 per cent over this period.
- Property tax was the largest source of municipal revenue, accounting for $21.8 billion, or 40 per cent, of the revenue collected by municipalities in 2018. Transfers from other governments followed at $12.2 billion (22 per cent), just ahead of user fees and service charges at $10.8 billion (20 per cent). The remaining $9.5 billion (18 per cent) in revenue included licences, permits and rents, fines, and other sources.
- Municipal expense totalled a combined $46.8 billion in 2018. Since 2009, municipal expenditures have grown at an average of 3.2 per cent, from $35.2 billion to $46.8 billion in 2018. On average, spending per person was $3,274 in 2018. Since 2009, after accounting for inflation, spending per person has grown from $3,218 to $3,274, an increase of $56 per person. This suggests that the overall quantity and quality of services provided by municipalities has been relatively stable over the last 10 years.
- Transportation services was the largest budget item in 2018, at $10.7 billion, or 23 per cent, of total expenses, followed by social and family services at $10.4 billion (22 per cent). Protection services (mainly police and fire) accounted for $8.0 billion (17 per cent), followed by environmental services at $7.0 billion (15 per cent) and recreation and cultural services at $4.6 billion (10 per cent). Health services, general government and other services combined for the remaining $6.2 billion (13 per cent) in expenses.
- The FAO also reviewed municipal budget balances by population group and region. See Chapter 4 for more information.
Net Debt, Accumulated Surplus and Reserve Funds
- Net debt is the difference between municipalities’ financial assets and total liabilities, and represents municipalities’ net financial worth. Starting in 2009, municipalities’ combined net debt increased from $0.3 billion to $3.2 billion by 2015. Since 2015, municipalities’ combined net debt has declined steadily, reaching $1.4 billion in 2018. In comparison, the Province recorded net debt of $193.6 billion in 2009-10, which rose to $338.5 billion in 2018-19.
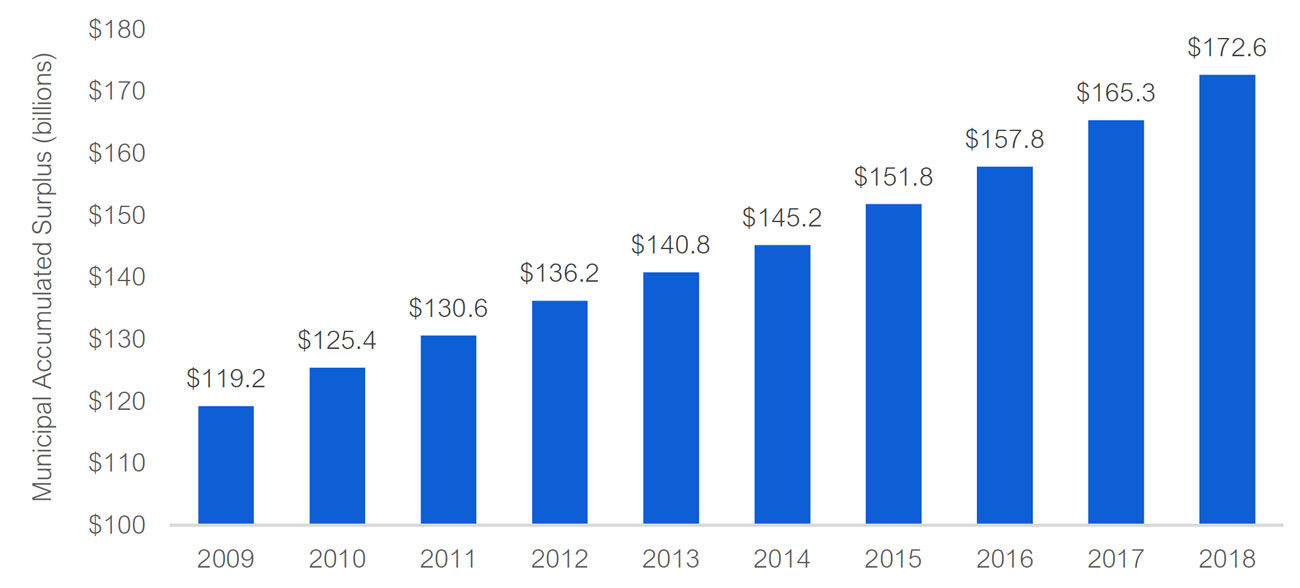
- Accumulated surplus / (deficit) is the sum of municipalities’ budget surpluses and deficits over time and represents municipalities’ total net worth.[3] In 2018, municipalities recorded a combined accumulated surplus of $172.6 billion, up from $119.2 billion in 2009. Municipalities’ accumulated surplus grew significantly from 2009 to 2018, due to a large increase in municipal infrastructure assets and only a small increase in net debt.
- In contrast to municipalities’ accumulated surplus, the Province recorded an accumulated deficit of $131.0 billion in 2009-10, which increased to an accumulated deficit of $216.6 billion by 2018-19.
- Municipalities maintain reserve funds to finance future spending requirements and protect budgets against unexpected changes in revenue and expenses. In 2018, these reserves totalled $31.9 billion across all municipalities, of which $30.3 billion was earmarked for specific purposes and $1.7 billion was available for budget stabilization, such as mitigating the impact of recessions.
The Impact of COVID-19 on Municipal Budgets
- The COVID-19 pandemic will result in significantly lower revenues and higher expenses for municipalities. Before taking into account cost savings measures and federal-provincial financial support, the FAO projects a negative financial impact on municipalities’ budgets of $4.1 billion in 2020 and $2.7 billion in 2021, for a combined negative impact of $6.8 billion over two years.
- Municipalities’ combined revenue will be reduced by $4.7 billion over two years, with the largest revenue loss from transit fees ($2.1 billion), followed by fees for recreational and cultural facilities and other services ($0.8 billion), licences and permits ($0.6 billion) and all other revenue sources ($1.2 billion).[4]
- Municipalities are projected to increase expenditures by $2.1 billion over two years, with the largest spending increase for social housing ($0.6 billion, includes spending for temporary housing and homeless shelters), followed by public health ($0.4 billion), social and family services ($0.4 billion, includes long-term care facilities) and all other spending ($0.8 billion).
- The FAO also reviewed the financial impact of the COVID-19 pandemic on municipal budgets by population group and region. See Chapter 5 for more information.
Municipal Cost Savings Measures and Federal-Provincial Financial Support
- In response to the COVID-19 pandemic, the FAO estimates that municipalities implemented cost savings measures that will reduce spending by $1.1 billion in 2020. These measures include changes to staffing ($0.4 billion in savings), reductions in public transit services ($0.3 billion in savings), the closure of recreational and other facilities ($0.2 billion in savings), and other initiatives, such as the cancellation of programs ($0.3 billion in savings).
- On July 27, 2020, the Province announced that, as part of the Safe Restart Agreement with the federal government, municipalities would receive up to $4.0 billion in support to help mitigate the financial impact of the COVID-19 pandemic. The Province is contributing $2.2 billion, or 56 per cent of the total support to municipalities, with the federal government contributing $1.8 billion, or 44 per cent.
- The $4.0 billion in support includes prior announcements and falls under four categories: $2.0 billion for municipal transit agencies, $1.4 billion for general operating pressures, $0.5 billion for homelessness programs, food banks and other social services, and $0.1 billion for public health services.
- To date, the Province has allocated $2.0 billion of the available funding to municipalities. The remaining $2.0 billion in funding will only be provided to municipalities that are able to demonstrate outstanding general operating pressures in 2020 and outstanding transit pressures in 2020 and the first quarter of 2021 (to March 31, 2021).
Implications for Municipal Budgets in 2020
- Before taking into account cost savings measures and federal-provincial financial support, the FAO projects a combined negative financial impact on municipalities’ budgets of $4.1 billion in 2020.
- Municipalities have implemented cost savings measures that will reduce expenditures by $1.1 billion in 2020.
- The Province has already allocated $2.0 billion in federal-provincial financial support and the FAO projects that municipalities will be allocated an additional $1.1 billion for budget pressures in 2020. This results in total federal-provincial support of $3.0 billion in 2020.
- Therefore, cost savings measures of $1.1 billion and federal-provincial financial support of $3.0 billion will allow municipalities to completely mitigate the $4.1 billion financial impact from COVID-19 in 2020.
Implications for Municipal Budgets in 2021
- Before taking into account cost savings measures and federal-provincial financial support, the FAO projects a combined negative financial impact on municipalities’ budgets of $2.7 billion in 2021. This shortfall consists of $0.9 billion for municipal transit pressures and $1.8 billion for operating pressures.
- As of the writing of this report, municipalities are preparing their budgets for 2021. Given that budget decisions have not been finalized, the FAO provides the following observations:
- Remaining Federal-Provincial Support: $1.0 billion of the $4.0 billion in federal-provincial support will remain after drawdowns in 2020. However, under the Province’s funding terms, the federal-provincial support is only available for general operating pressures in 2020 and municipal transit pressures through the first quarter of 2021. Consequently, the FAO projects that only $0.3 billion will be provided to municipalities in 2021 to address first quarter transit pressures. This will leave $0.7 billion of the $4.0 billion in federal-provincial support unallocated, even though municipalities will still face a remaining $2.4 billion financial shortfall from the COVID-19 pandemic in 2021.
- Utilization of Reserve Funds: Municipalities may decide to utilize reserve funds. The FAO projects that reserve funds available for budget stabilization, such as mitigating the impact of recessions, will reach a combined $1.8 billion by 2021. Note that the actual amount of available reserve funds will vary by municipality.
- Additional Mitigation Measures: Municipalities may decide to implement additional measures in 2021 to either increase revenue (e.g., increase taxes or user fees) or reduce spending (e.g., lower services or cutbacks in staffing). In 2020, municipalities achieved $1.1 billion in cost saving measures. However, many of these measures were time limited during the full lockdown at the beginning of the COVID-19 pandemic (e.g., closure of recreational facilities and unpaid staff leave) and municipalities may find it difficult to find this level of savings in 2021.
- Reduce Budget Surpluses: Municipalities may decide to run reduced budget surpluses or budget deficits in 2021.[5] After accounting for the financial impact of the COVID-19 pandemic and available federal-provincial support, municipalities are projected to run a combined budget surplus of $6.0 billion in 2021. However, while $6.0 billion represents a significant budget surplus in aggregate, some individual municipalities may face budget deficits, particularly on a cash operating basis. Provincial legislation requires municipalities to plan for balanced cash operating budgets, so even if a municipality is projecting an accrual-based balanced budget, action would still need to be taken if the municipality is facing a cash operating budget deficit.
2 | Introduction
Overview
Approximately 99 per cent of Ontario’s 14.7 million people live in one of 444 municipalities. Unlike the federal and provincial governments, which are constitutionally enshrined, municipalities are created by provincial governments. As such, municipalities in Ontario have only the powers assigned to them by the legislature.[6]
Under Provincial legislation, municipalities provide a range of regional and local services including those related to utilities, local roads and transit, emergency services, public health, recreation, and social and housing services. To pay for these services, Provincial legislation provides municipalities with limited powers to generate revenue and issue debt. For revenue, municipalities rely primarily on property taxes, followed by federal and provincial cash transfers, user fees and revenue from government business enterprises. Unlike the federal and provincial governments, municipalities are unable to levy income or sales taxes.
Regarding debt issuance, municipalities are allowed to borrow on a short-term basis to pay for operating expenses and can issue long-term debt for capital projects.[7] However, a municipality may not commit more than 25 per cent of its total own-source revenue (including property taxes, user fees and investment income) to service long-term debt and other long-term obligations.[8]
Impact of COVID-19 Pandemic on Municipal Finances
The COVID-19 pandemic has had a significant impact on the Ontario economy and the finances of all three levels of government.[9] In response to the outbreak, governments announced strict economic and social measures to slow the spread of the virus, including the shutdown of non-essential activities.[10] In addition, governments announced measures to support individuals and businesses, expand public health and assist with the reopening of schools and child care.[11]
The economic downturn, along with the measures required to address the COVID-19 pandemic, has resulted in a significant impact on municipal finances. Municipalities faced severely reduced revenue from transit and recreational and cultural facilities, and increased expenses for public health, homeless shelters, long-term care facilities and general cleaning and supplies. In the spring of 2020, municipalities indicated that these budget pressures created significant fiscal challenges, particularly because they lack the ability to run cash deficits for operating purposes. Given this, municipalities requested financial support from the Province and federal government, so that municipalities would not need to resort to “property tax increases or service cuts on a massive scale, or the deferral of capital investments” to balance their budgets.[12]
In response, the Province, with support from the federal government through the Safe Restart Agreement, announced financial support to municipalities of up to $4.0 billion.[13]
Purpose and Structure of this Report
The purpose of this report is to provide Members of Provincial Parliament (MPPs) with an overview of municipal budgets, estimate the financial impact of the COVID-19 pandemic on municipalities, and assess the adequacy of federal-provincial financial support to municipalities.
The report begins with a summary of municipal finances prior to the COVID-19 outbreak, including budget balances, revenues, expenses and debt position. The FAO also examines municipalities’ budget balances by region and population size. Next, the FAO estimates the impact of the COVID-19 pandemic on municipal finances, including by region and population size. The report then reviews cost savings measures implemented by municipalities to address the financial impact of the COVID-19 pandemic, as well as financial support provided by the Province and the federal government. The report concludes with an estimate of the remaining financial shortfall for municipal budgets and a discussion on options to address the shortfall.
In this report, the FAO presents municipal budgets on an accrual accounting basis, which aligns with municipalities’ audited annual financial statements, the presentation of the Province’s finances in Ontario Budgets and the Public Accounts of Ontario, and is consistent with public sector accounting standards. However, municipalities also publicly present operating and capital budgets based on modified-cash concepts. Importantly, under the Municipal Act, 2001, municipalities must plan to have a balanced budget every year on a cash operating budget basis rather than an accrual budget basis. In Appendix A, the FAO provides information on the differences between the two accounting presentations.
Appendix B provides more information on the development of this report.
3 | Overview of Municipal Finances
Budget Balance
Ontario’s municipalities recorded a combined budget surplus of $7.4 billion[14] in 2018.[15] Over the past 10 years, municipalities have consistently recorded budget surpluses, rising from a combined $3.6 billion in 2009 to $7.4 billion in 2018. In contrast, the Province recorded budget deficits each year over the same 10-year period, including deficits of $19.3 billion in 2009-10 and $7.4 billion in 2018-19.
Figure 3-1Municipal combined budget surpluses, 2009 to 2018 ($ billions)
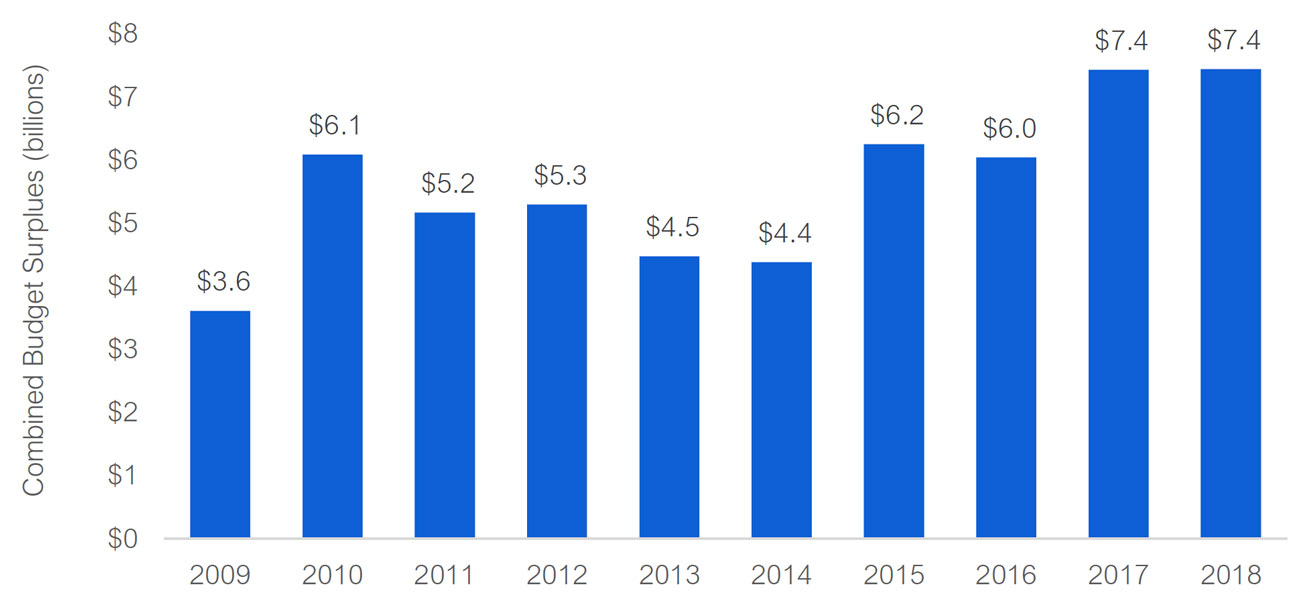
Note: Figures are presented on an accrual accounting basis.
Source: Ministry of Municipal Affairs and Housing’s Financial Information Return (FIR).
Revenue
In 2018, municipalities generated a combined total of $54.3 billion in revenue. Since 2009, revenue has grown at an annual average of 3.8 per cent, from $38.9 billion to $54.3 billion in 2018. This is moderately slower than nominal economic growth, which averaged 4.1 per cent annually over this period.
Figure 3-2Total municipal revenue, 2009 to 2018 ($ billions)
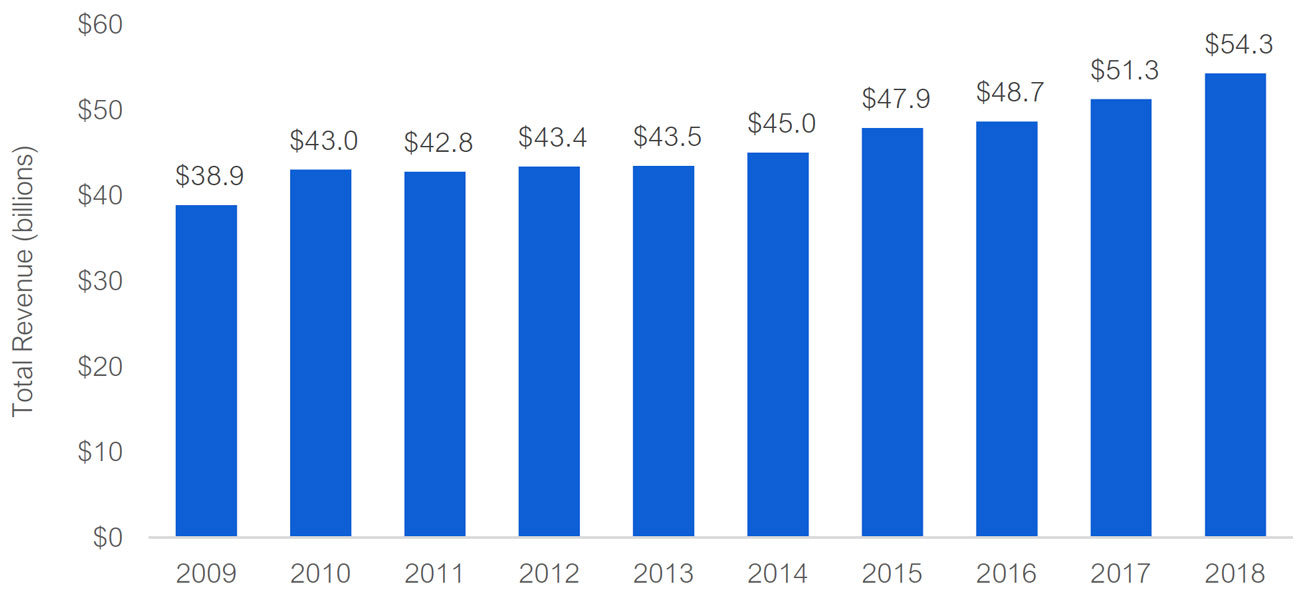
Source: Ministry of Municipal Affairs and Housing’s Financial Information Return (FIR).
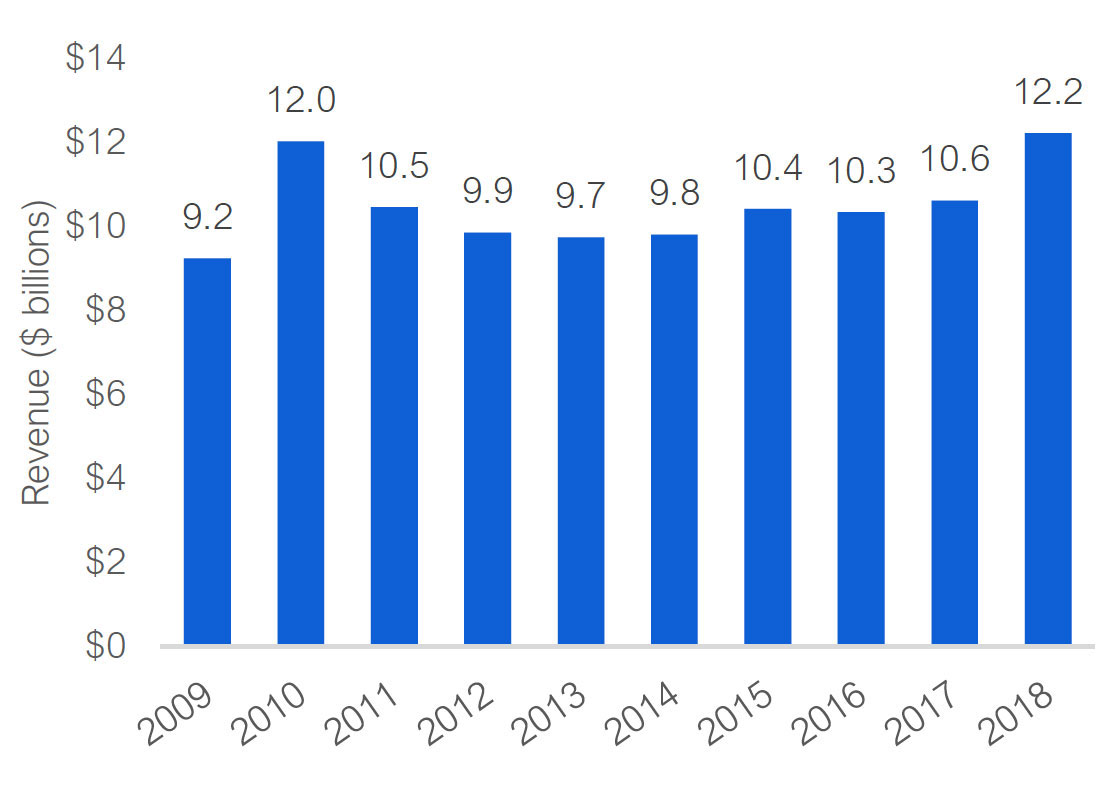
Property tax is the largest source of municipal revenue, accounting for $21.8 billion or 40 per cent of the revenue collected by municipalities in 2018. Transfers from other governments follows at $12.2 billion (22 per cent), just ahead of user fees and service charges at $10.8 billion (20 per cent). The remaining $9.5 billion (18 per cent) includes licences, permits and rents, fines, and other revenue sources.
Figure 3-3Municipal revenue by source, 2018 ($ billions)
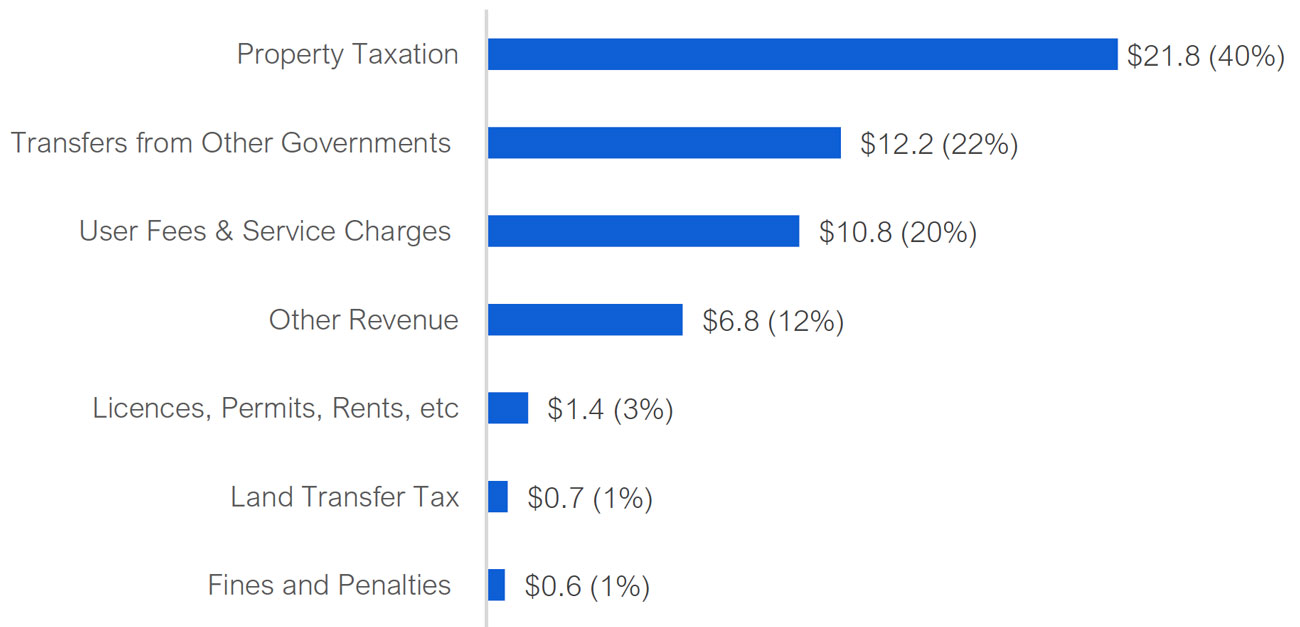
Source: Ministry of Municipal Affairs and Housing’s Financial Information Return (FIR).
Property Taxation
In 2018, municipalities raised $21.8 billion in property tax revenues, an increase from $15.8 billion in 2009.[17] This represents an average annual growth rate of 3.6 per cent, which is less than the 5.7 per cent annual increase in property values over the same period.[18] Property tax revenue does not necessarily grow at the same rate as its tax base because, regardless of the underlying property values, municipalities set property tax rates every year to raise the level of revenue needed to meet their budgetary requirements. In contrast, federal and provincial governments typically set income and sales tax rates over a longer term, and the revenue collected is sensitive to changes in the economy.
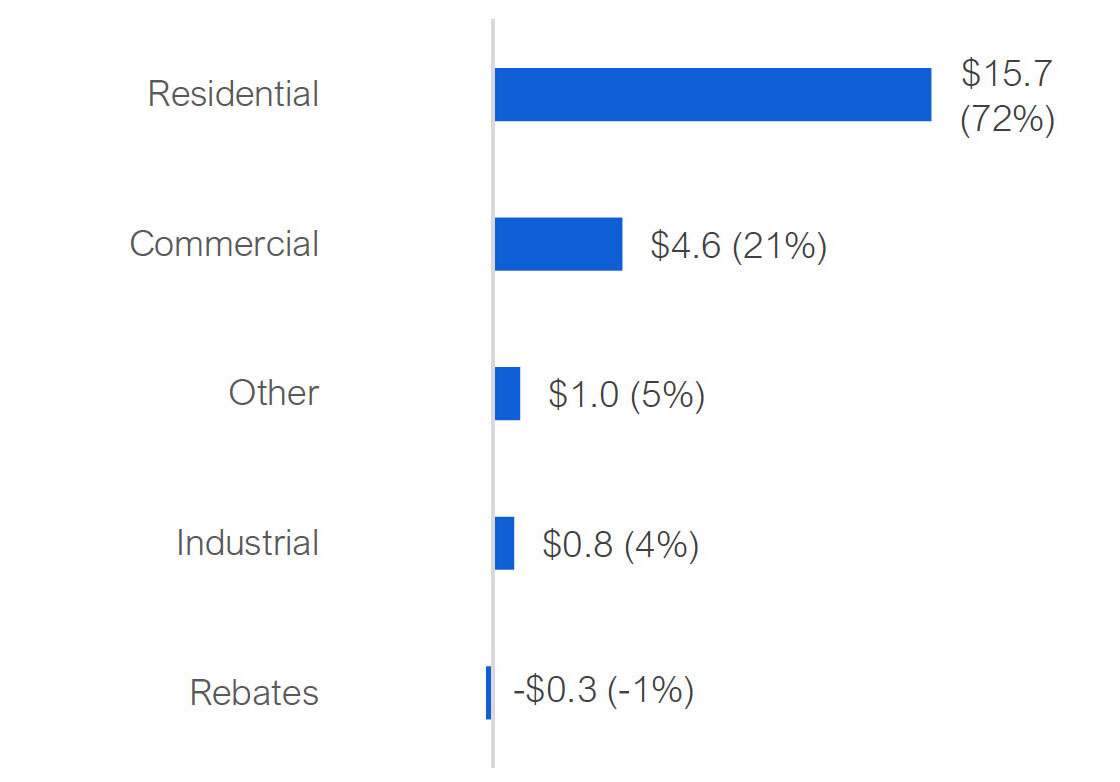
Property tax revenue can be separated into residential and non-residential portions. The residential portion accounts for $15.7 billion (72 per cent) of total property tax revenue while $6.4 billion (29 per cent) comes from non-residential sources such as commercial and industrial properties. Property tax rebates, such as those for registered charities, low-income seniors and low-income individuals with disabilities, reduced property tax revenue by $0.3 billion.
Figure 3-4 Property tax revenues, 2009 to 2018, ($ billions)
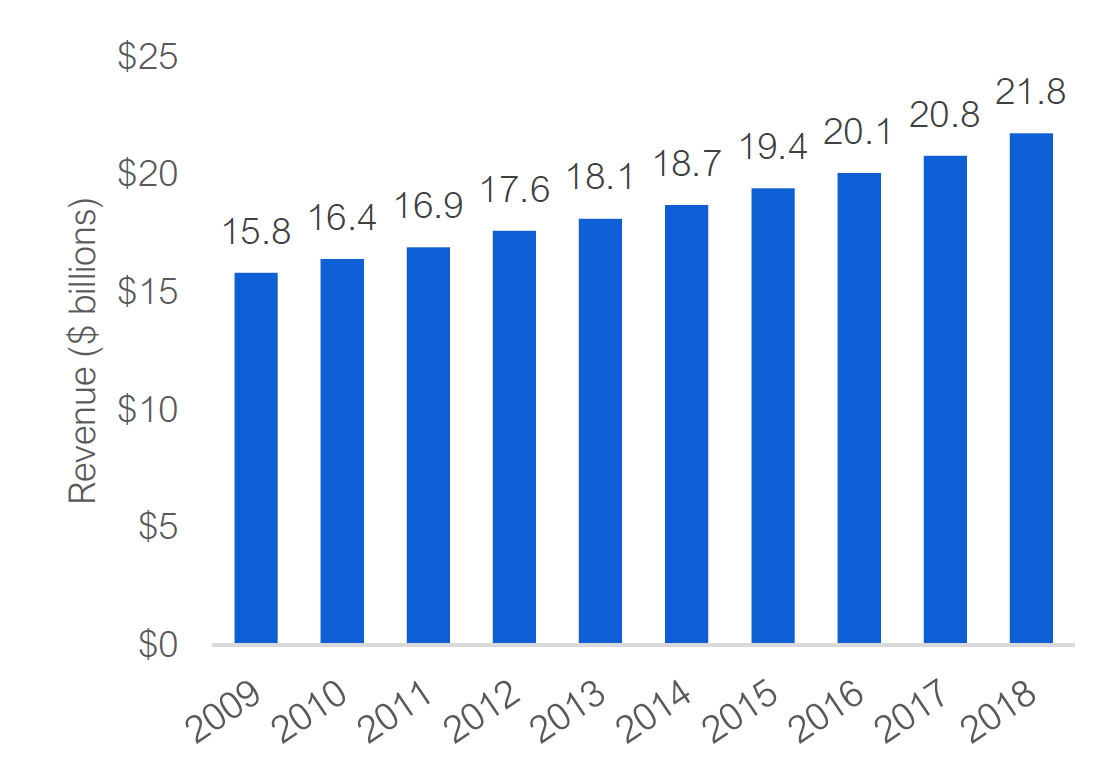
Source: Ministry of Municipal Affairs and Housing’s Financial Information Return (FIR).
Figure 3-5 Property tax revenues by source, 2018 ($ billions)
Source: Ministry of Municipal Affairs and Housing’s Financial Information Return (FIR).
Transfers from Other Governments
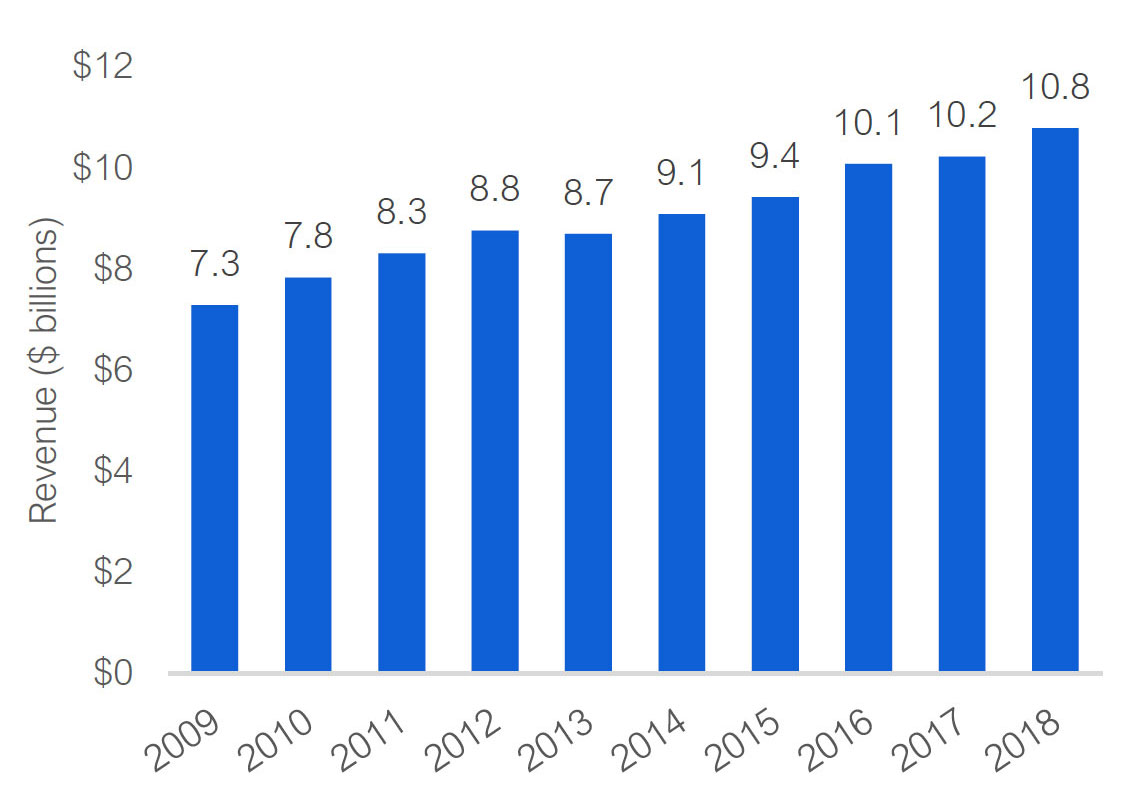
In 2018, municipalities received a total of $12.2 billion in cash transfers from the federal and provincial governments, as well as other municipalities. In 2018, municipalities received $2.3 billion from the federal government, $9.4 billion from the Province and $0.5 billion from other municipalities.[19] Transfers from other governments have grown by an annual average of 3.1 per cent since 2009.
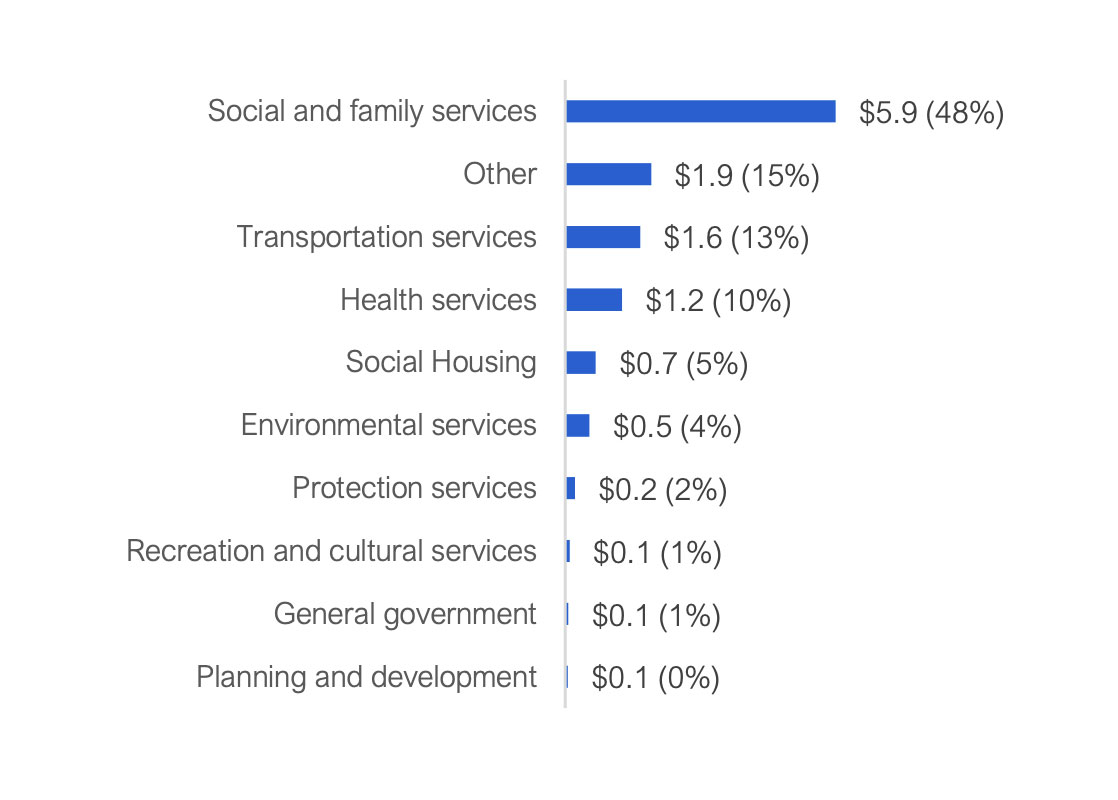
Transfers from other governments support a variety of municipal functions. In 2018, $5.9 billion (48 per cent) of the revenue received from other levels of government was used by municipalities to support social and family services, $1.6 billion (13 per cent) was allocated to transportation, and $1.2 billion (10 per cent) went to health services. The remaining $3.5 billion was allocated to other functions or was unconditionally granted to municipalities (28 per cent).
Figure 3-6 Revenue from other governments, 2009 to 2018, ($ billions)
Source: Ministry of Municipal Affairs and Housing’s Financial Information Return (FIR).
Figure 3-7 Use of revenue from other governments, 2018 ($ billions)
Source: Ministry of Municipal Affairs and Housing’s Financial Information Return (FIR).
User Fees and Service Charges
User fees are charges that are levied on residents for services, such as wastewater removal or the use of recreational facilities. User fees and service charges account for one-fifth of municipal revenue, contributing $10.8 billion in 2018. Revenue from user fees and service charges has grown by an annual average of 4.5 per cent since 2009.
More than half (57 per cent) of user fees and service charges were from environmental services, such as water distribution, wastewater treatment and solid waste collection. Another $2.2 billion (20 per cent) was generated by transportation services, mainly transit. The remaining $2.4 billion was generated from a variety of other sources, with recreation and cultural services ($0.7 billion, 7 per cent) and social and family services ($0.4 billion, 4 per cent) being the largest of the other user fees and service charges.
Figure 3-8 User fee revenue, 2009 to 2018, ($ billions)
Source: Ministry of Municipal Affairs and Housing’s Financial Information Return (FIR).
Figure 3-9 User fee revenue by source, 2018 ($ billions)
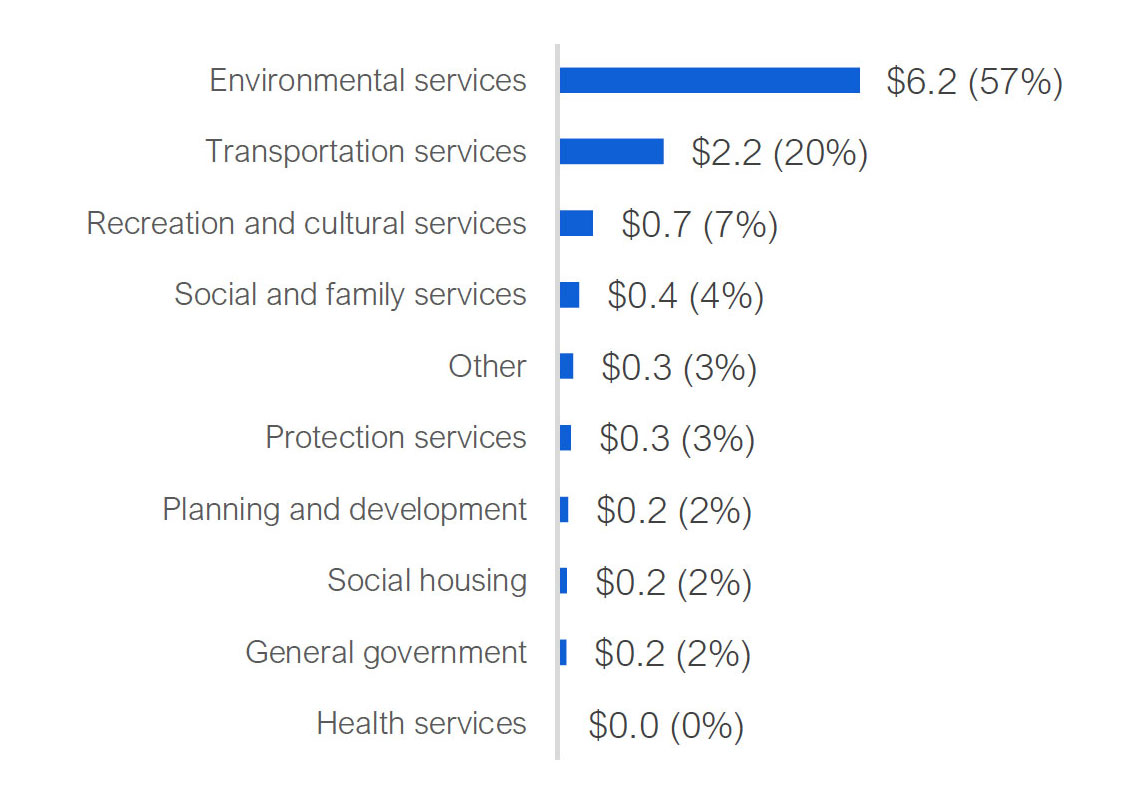
Source: Ministry of Municipal Affairs and Housing’s Financial Information Return (FIR).
Expense
Municipal expense totalled $46.8 billion in 2018. Since 2009, municipal expenditures have grown at an average of 3.2 per cent, from $35.2 billion to $46.8 billion in 2018. On average, spending per person was $3,274 in 2018. Since 2009, after accounting for inflation, spending per person has grown from $3,218 to $3,274, an increase of $56 per person. This suggests that the overall quantity and quality of services provided by municipalities has been relatively stable over the last 10 years.
Figure 3-10 Total municipal expense, 2009 to 2018 ($ billions)
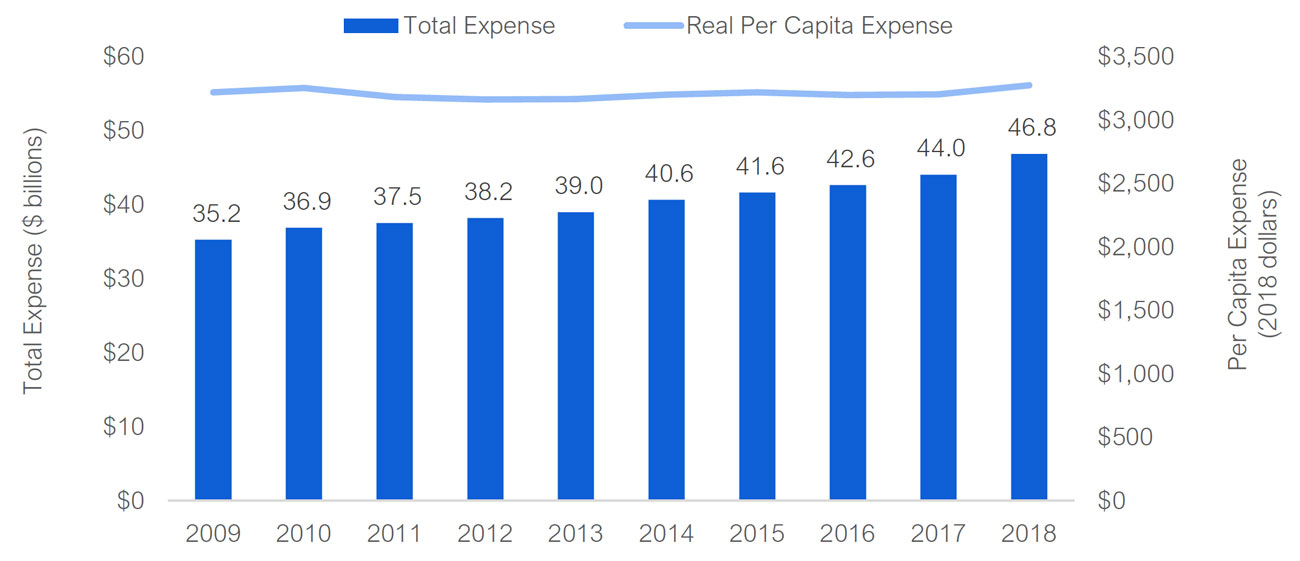
Source: Ministry of Municipal Affairs and Housing’s Financial Information Return (FIR).
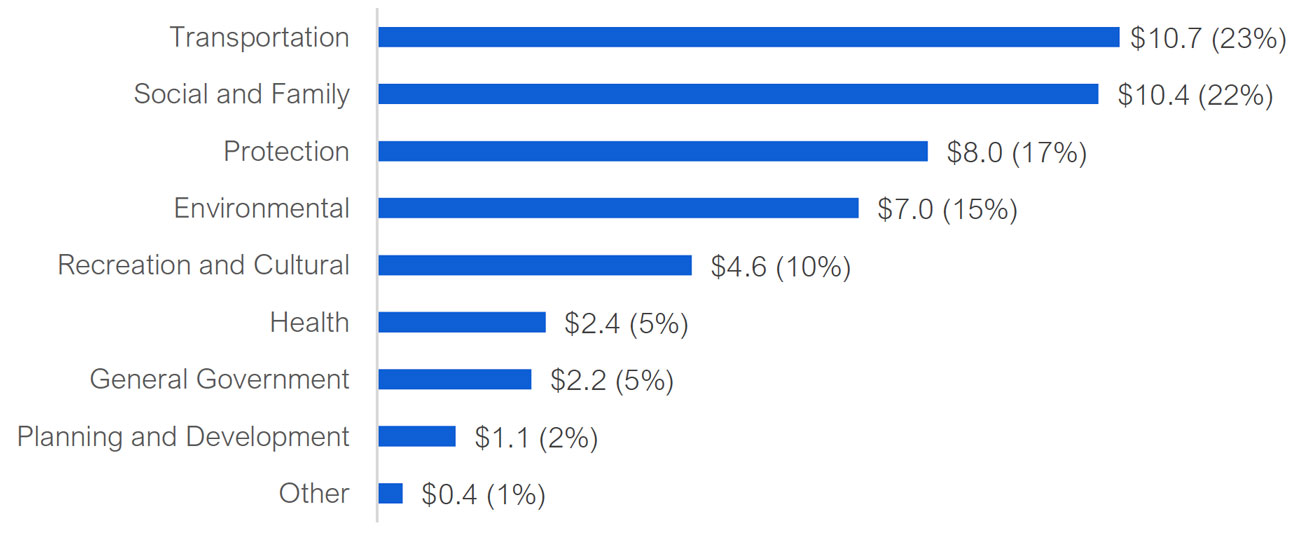
Transportation services is the largest budget item for Ontario’s municipalities at $10.7 billion (23 per cent) of total expense, followed closely by social and family services at $10.4 billion (22 per cent). Protection services accounts for $8.0 billion (17 per cent), followed by environmental services at $7.0 billion (15 per cent) and recreation and cultural services at $4.6 billion (10 per cent). Health services, general government and other services combine for the remaining $6.2 billion (13 per cent).
Figure 3-11 Total municipal expense by function ($ billions)
Source: Ministry of Municipal Affairs and Housing’s Financial Information Return (FIR).
Transportation Services
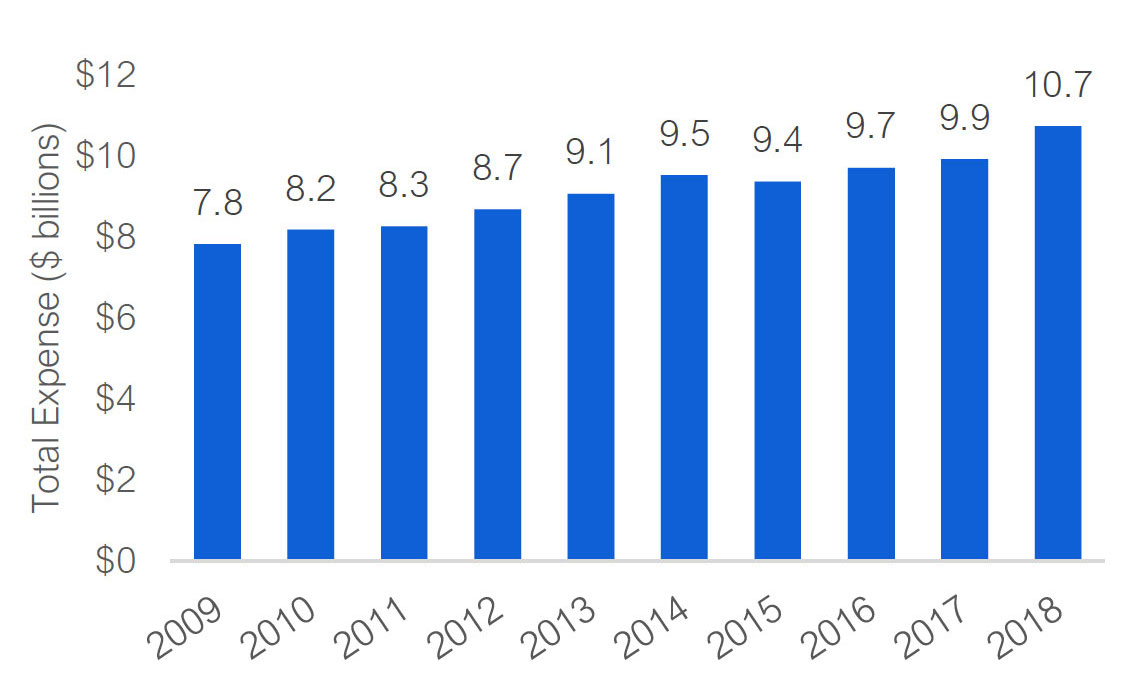
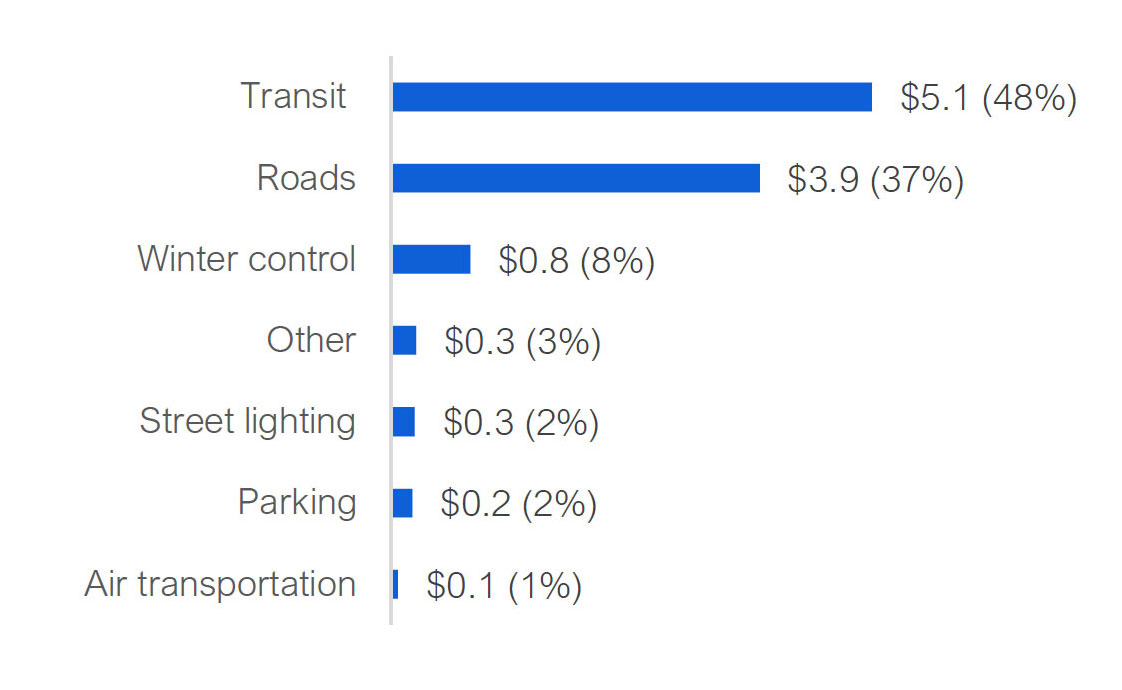
In 2018, municipalities spent $10.7 billion on transportation services. This is an increase from $7.8 billion in 2009, representing an annual average growth rate of 3.6 per cent. Nearly half of transportation expense was for transit ($5.1 billion), while roads expense totalled $3.9 billion (37 per cent of the total). Winter control, such as snow removal, was the other significant expense at $0.8 billion (8 per cent of the total). Air transportation, parking, street lighting, and other transportation services combined for the remaining $0.8 billion in expense.
Figure 3-12 Transportation expense, 2009 to 2018, ($ billions)
Source: Ministry of Municipal Affairs and Housing’s Financial Information Return (FIR).
Figure 3-13 Transportation expense by source, 2018, ($ billions)
Source: Ministry of Municipal Affairs and Housing’s Financial Information Return (FIR).
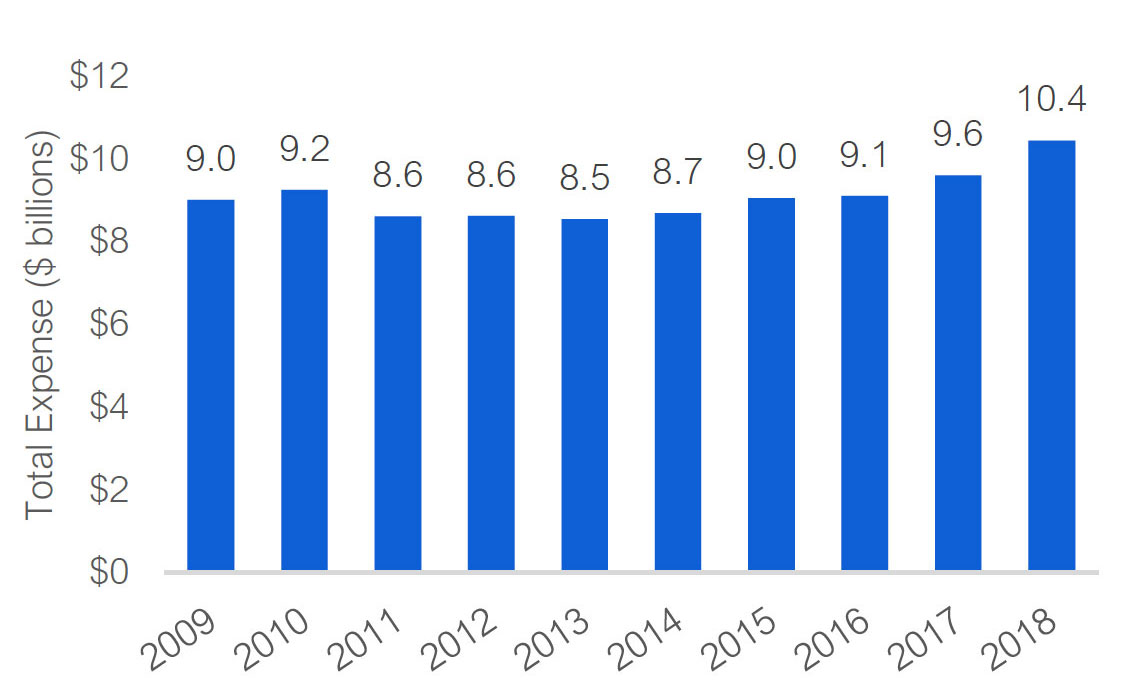
Social and Family Services
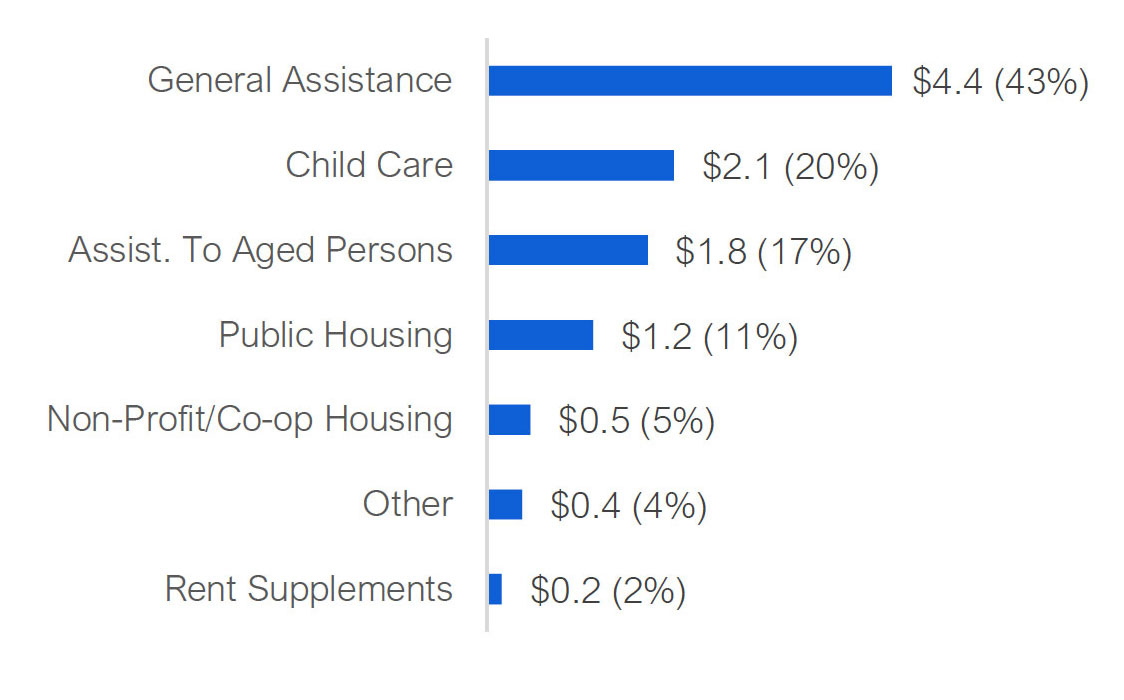
Social and family services expense totalled $10.4 billion in 2018 and has grown by an annual average of 1.7 per cent since 2009. About $4.4 billion (43 per cent of the total) was for general assistance, followed by child care ($2.1 billion or 20 per cent) and assistance to aged persons ($1.8 billion or 17 per cent). The remaining $2.2 billion was divided between housing and other social and family services.
Figure 3-14 Social and family expense, 2009 to 2018, ($ billions)
Source: Ministry of Municipal Affairs and Housing’s Financial Information Return (FIR).
Figure 3-15 Social and family expense by source, 2018, ($ billions)
Source: Ministry of Municipal Affairs and Housing’s Financial Information Return (FIR).
Protection Services
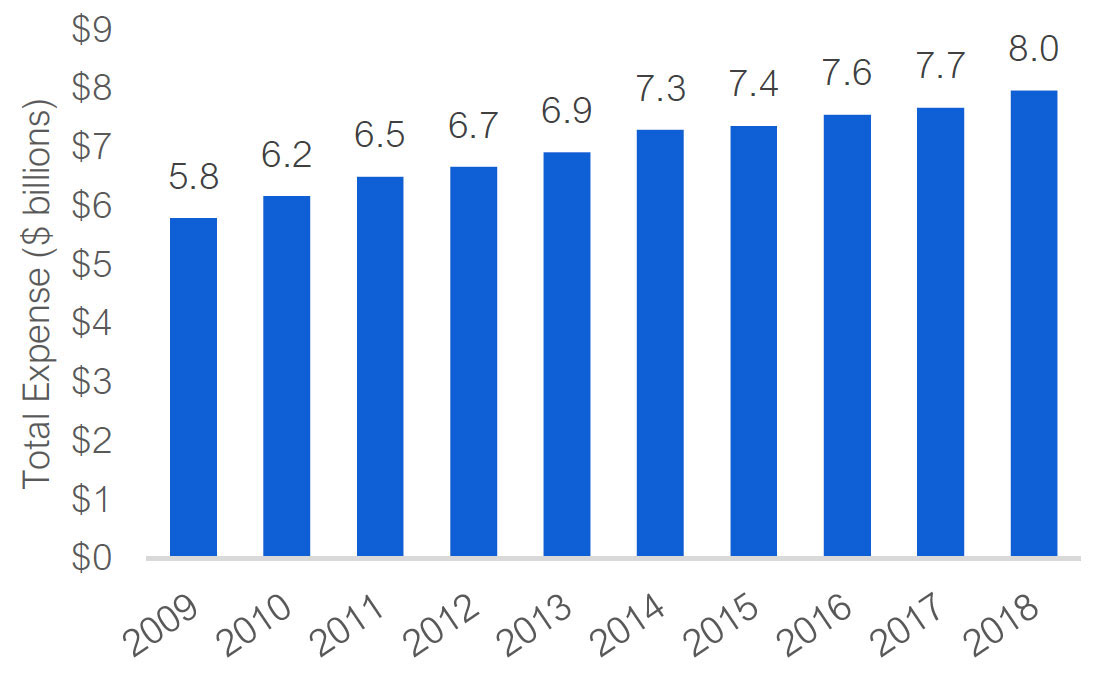
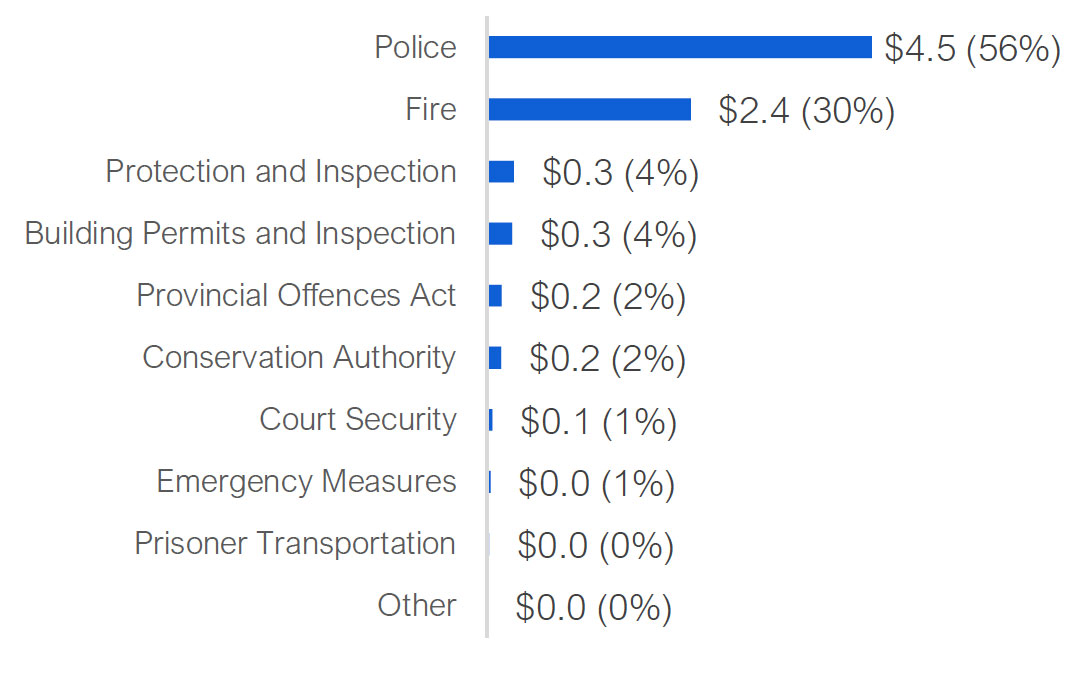
Protection services expense has grown at an annual average of 3.6 per cent since 2009 to $8.0 billion in 2018. Police account for more than half of protection services expense at $4.5 billion (56 per cent of the total), followed by fire at $2.4 billion (30 per cent). The remaining $1.1 billion (14 per cent of the total) was for other protection services, such as building permitting and inspections, conservation authority, court security and prisoner transportation.
Figure 3-16 Protection services expense, 2009 to 2018, ($ billions)
Source: Ministry of Municipal Affairs and Housing’s Financial Information Return (FIR).
Figure 3-17 Protection services expense by source, 2018, ($ billions)
Source: Ministry of Municipal Affairs and Housing’s Financial Information Return (FIR).
Environmental Services
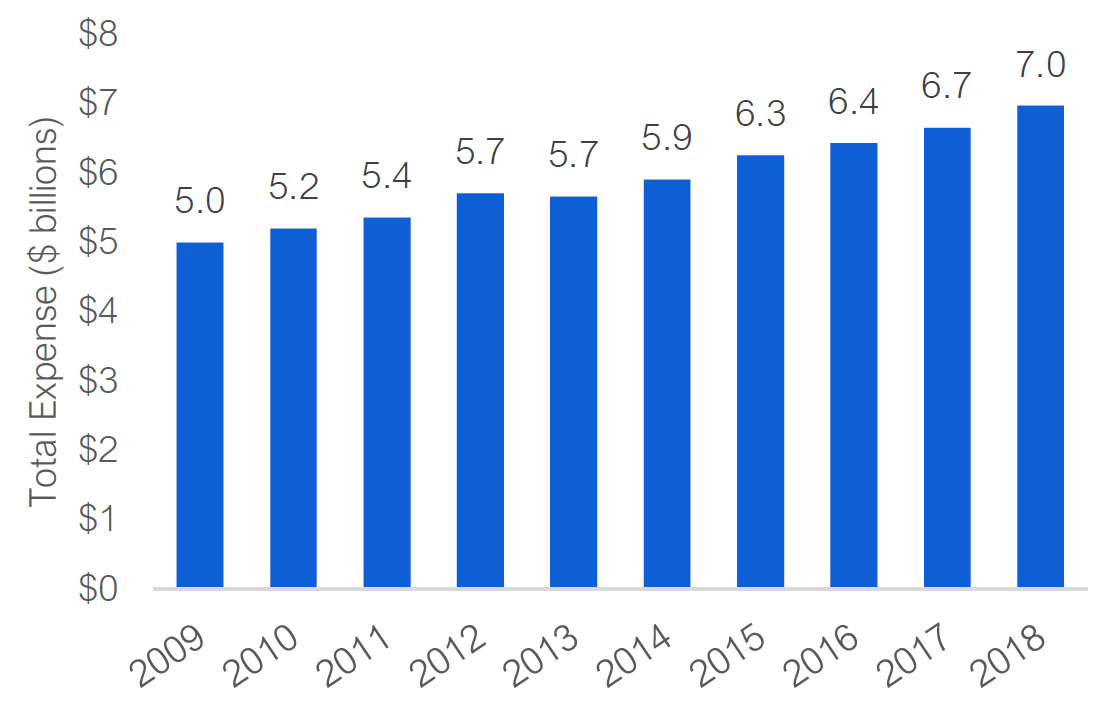
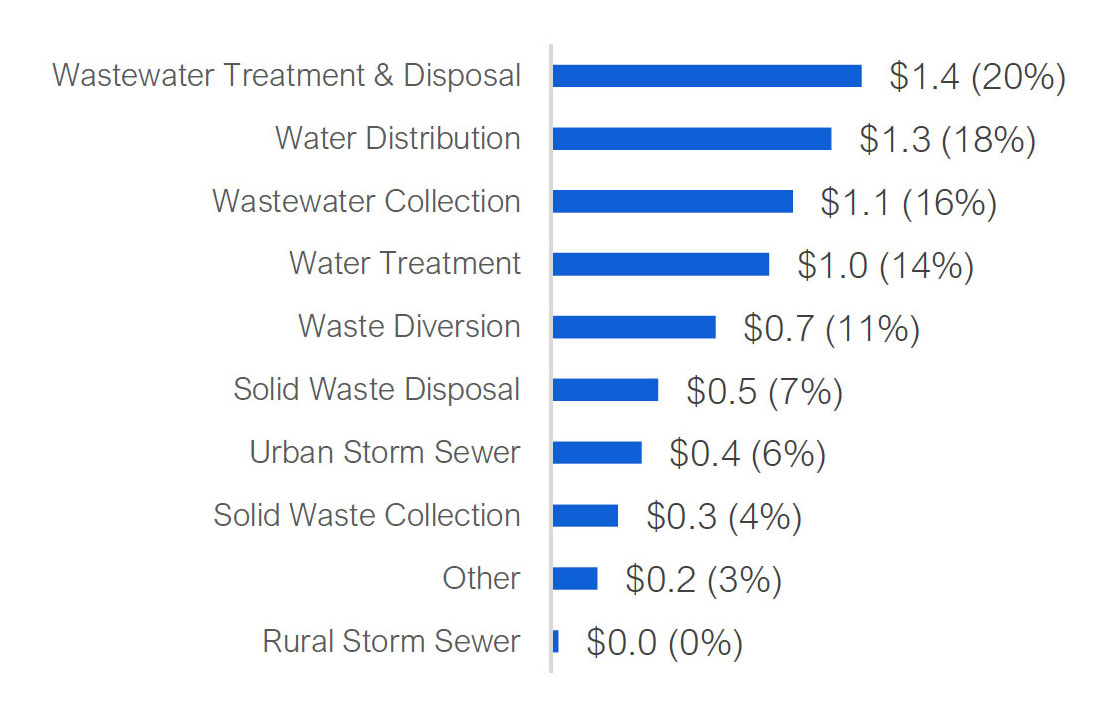
Environmental services expense has grown at an average annual rate of 3.8 per cent since 2009, to $7.0 billion in 2018. Water and sewer accounts for about $5.2 billion (75 per cent) of the total, with most of the remainder going toward solid waste collection and disposal.
Figure 3-18 Environmental services expense, 2009 to 2018, ($ billions)
Source: Ministry of Municipal Affairs and Housing’s Financial Information Return (FIR).
Figure 3-19 Environmental services expense by source, 2018, ($ billions)
Source: Ministry of Municipal Affairs and Housing’s Financial Information Return (FIR).
Recreation and Cultural Services
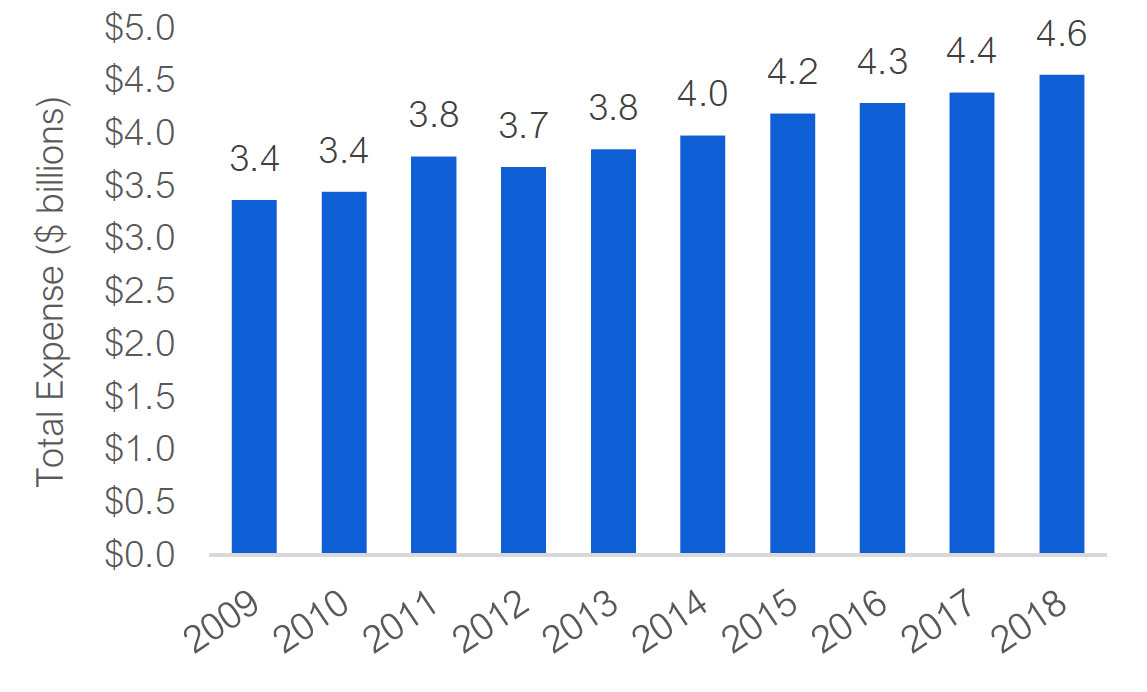
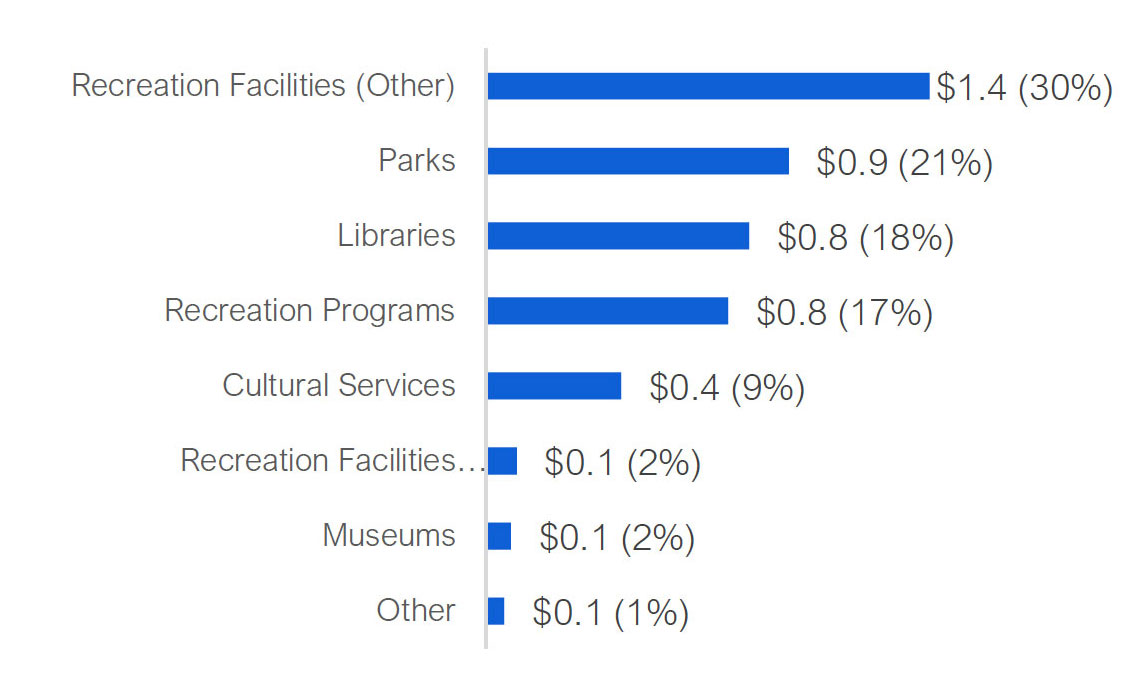
Recreation and cultural services expense has grown at an annual average of 3.4 per cent since 2009, to $4.6 billion in 2018. Parks and recreation accounts for more than two-thirds of that amount at $3.2 billion, followed by libraries at $0.8 billion (18 per cent) and cultural and other services at about $0.6 billion (12 per cent).
Figure 3-20 Recreation and cultural services expense, 2009 to 2018, ($ billions)
Source: Ministry of Municipal Affairs and Housing’s Financial Information Return (FIR).
Figure 3-21 Recreation and cultural services expense by source, 2018, ($ billions)
Source: Ministry of Municipal Affairs and Housing’s Financial Information Return (FIR).
Health Services
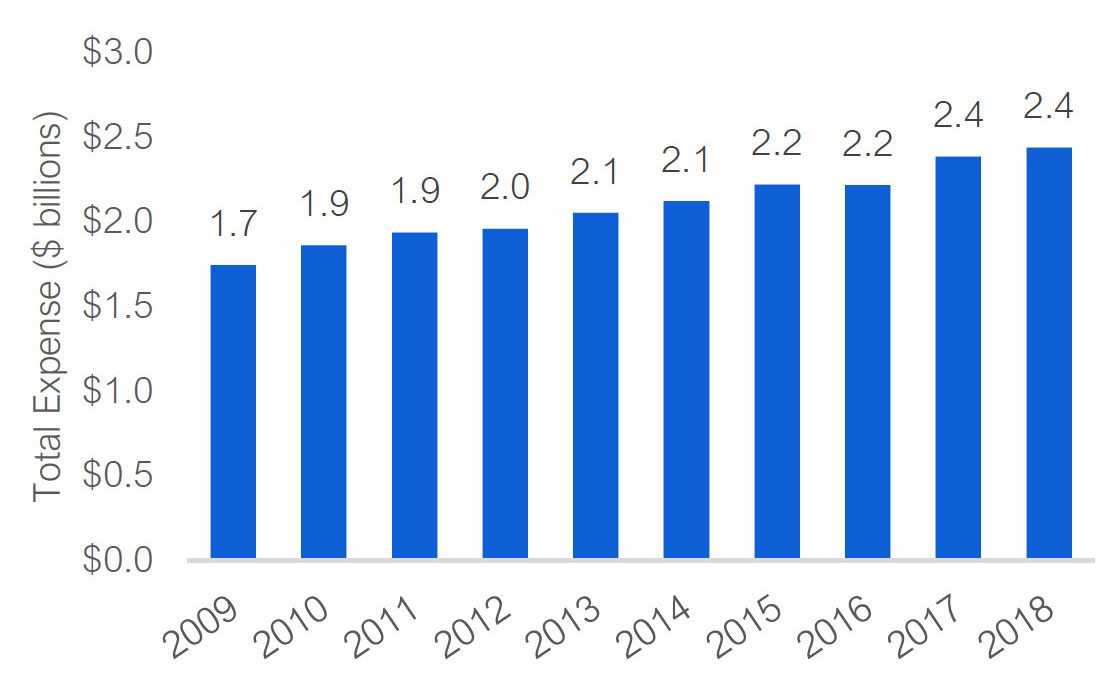
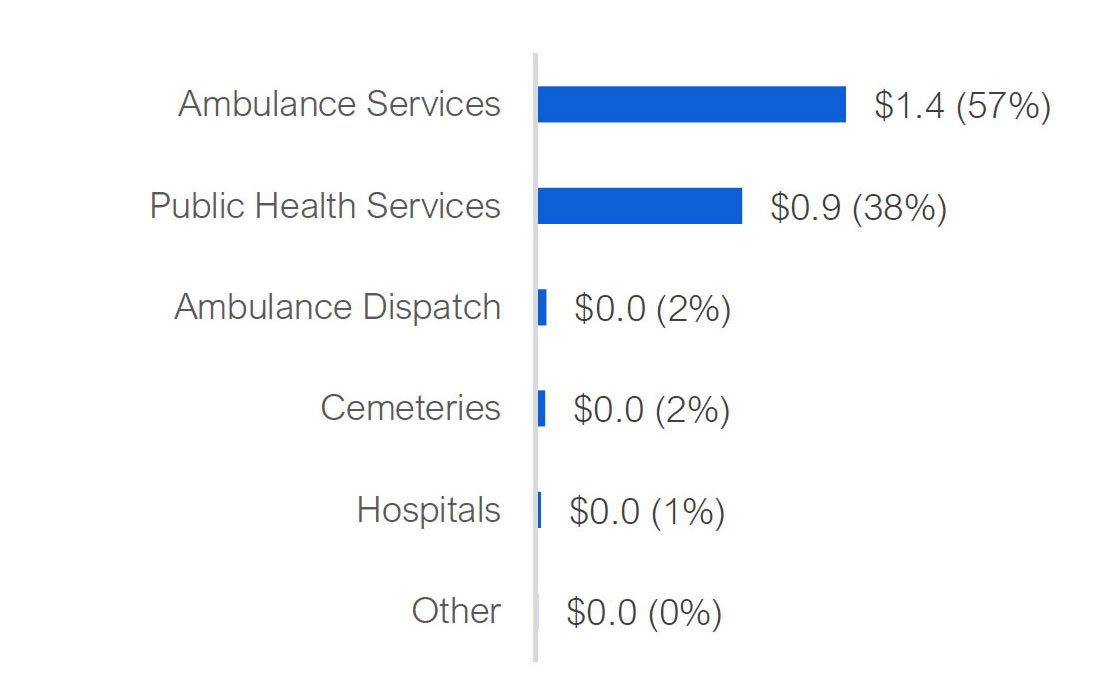
Health services accounted for $2.4 billion in municipal spending in 2018, with an average annual growth rate of 3.8 per cent since 2009. Almost the entire amount is divided between ambulance services ($1.4 billion, 57 per cent) and public health services ($0.9 billion, 38 per cent), with cemeteries, hospitals, and ambulance dispatch accounting for $0.1 billion.
Figure 3-22 Health services expense, 2009 to 2018, ($ billions)
Source: Ministry of Municipal Affairs and Housing’s Financial Information Return (FIR).
Figure 3-23 Health services expense by source, 2018, ($ billions)
Source: Ministry of Municipal Affairs and Housing’s Financial Information Return (FIR).
Net Debt and Accumulated Surplus / (Deficit)
Net Debt
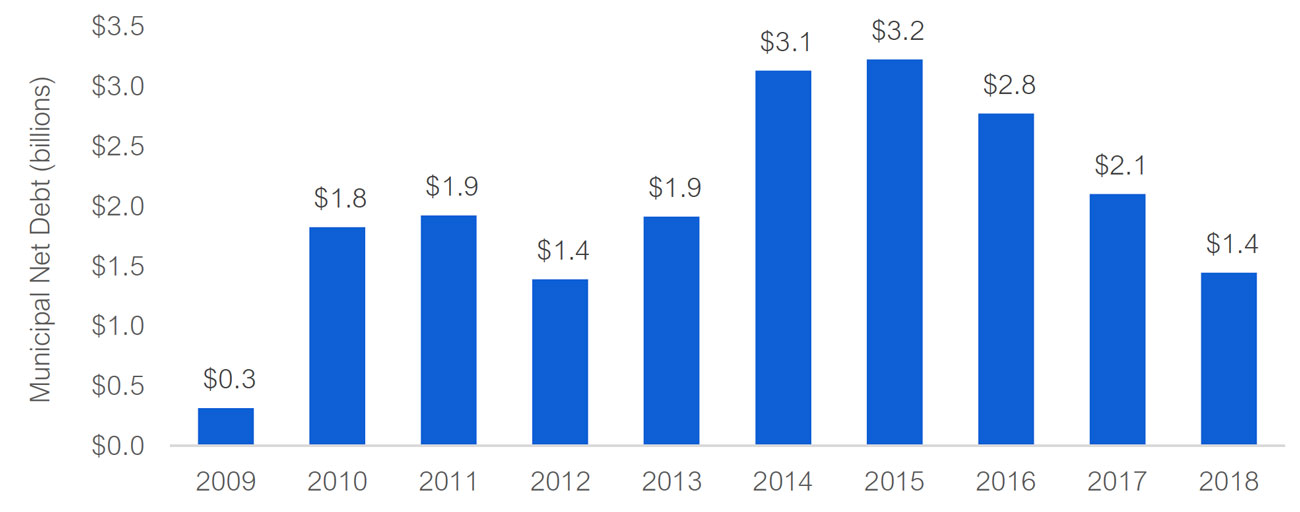
Net debt is the difference between municipalities’ financial assets and total liabilities, and represents municipalities’ net financial worth. Starting in 2009, municipalities’ combined net debt increased from $0.3 billion to $3.2 billion by 2015. However, since 2015, municipalities’ combined net debt has declined steadily, reaching $1.4 billion in 2018.
Figure 3-24 Municipal combined net debt, 2009 to 2018 ($ billions)
Source: Ministry of Municipal Affairs and Housing’s Financial Information Return (FIR).
In comparison, the Province recorded net debt of $193.6 billion in 2009-10, which rose to $338.5 billion in 2018-19. Municipalities’ significantly smaller net debt can be partly attributed to Provincial rules that only allow municipalities to issue long-term debt for capital projects.
Accumulated Surplus / (Deficit)
Accumulated surplus / (deficit) is the sum of municipalities’ budget surpluses and deficits over time. The accumulated surplus / (deficit) calculation is similar to net debt except that it also includes the value of municipalities’ infrastructure assets. Consequently, the accumulated surplus / (deficit) represents municipalities’ total net worth, as opposed to net debt which represents municipalities’ net financial worth.
In 2018, municipalities recorded a combined accumulated surplus of $172.6 billion, up from $119.2 billion in 2009. Municipalities’ accumulated surplus grew significantly from 2009 to 2018, due to a large increase in municipal infrastructure assets ($54.0 billion) and only a small increase in net debt ($1.1 billion).
Figure 3-25 Municipal combined accumulated surplus, 2009 to 2018 ($ billions)
Source: Ministry of Municipal Affairs and Housing’s Financial Information Return (FIR).
In contrast to municipalities’ accumulated surplus, the Province recorded an accumulated deficit of $131.0 billion in 2009-10, which increased to an accumulated deficit of $216.6 billion by 2018-19.
Municipal Reserve Funds
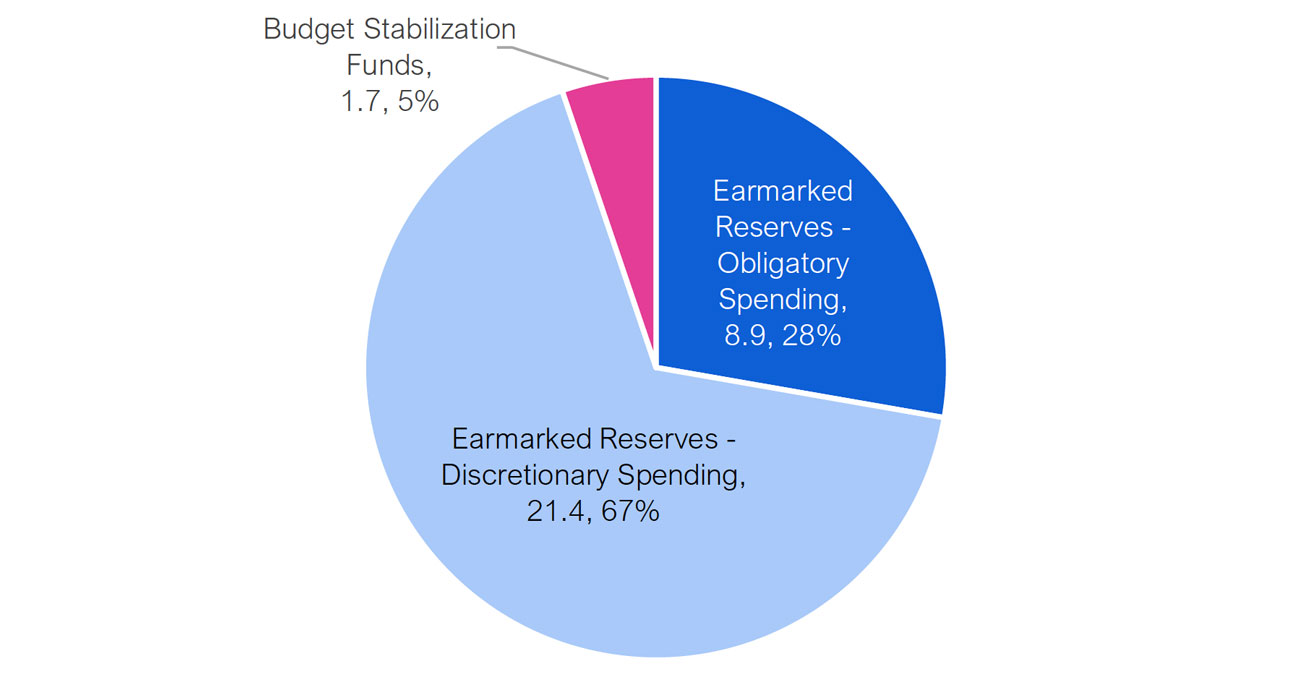
Municipalities maintain reserve funds to finance future spending requirements and protect budgets against unexpected changes in revenue and expenses. In 2018, these reserves totalled $31.9 billion across all municipalities.
Of this amount, $30.3 billion in reserve funds were earmarked for specific purposes. Approximately $8.9 billion of earmarked funds were committed for future spending that municipalities are obligated to provide, either by contract or law, which includes cost-sharing agreements with other levels of government or spending on capital projects funded through development charges. The remaining $21.4 billion in earmarked reserve funds were set aside by municipalities to fund discretionary services and other expected future expenses, such as spending on capital projects, replacement of equipment, and employee benefits.
Finally, after accounting for reserve funds that have been earmarked for specific purposes, the FAO estimates that municipalities held a combined $1.7 billion in reserve funds that were available for budget stabilization, such as mitigating the impact of recessions.
Figure 3-26 Municipal combined reserve funds by purpose, 2018 ($ billions)
Source: FAO and Ministry of Municipal Affairs and Housing’s Financial Information Return (FIR).
4 | 2018 Budget Balances by Population Size and Region
Largest Budget Surpluses and Deficits in 2018
In 2018, 389 municipalities recorded budget surpluses and 55 recorded budget deficits.[20] The six municipalities that recorded the largest budget surpluses accounted for approximately half of the $7.4 billion total combined budget surplus among all municipalities: Toronto, Ottawa, York Region, Peel Region, Vaughan and Halton Region. On the other hand, the municipalities with the largest budget deficits were Dryden, Huntsville, Grimsby, Georgian Bluffs, Tiny Township and Wilmot Township. For information on the 2018 budget balances for every Ontario municipality, visit the FAO’s website at: https://bit.ly/33Dfkdy.
| Municipality | Surplus/ (Deficit) ($ millions) | As per cent of revenue |
| Top Six | ||
| City of Toronto | 1,434 | 10.4% |
| City of Ottawa | 575 | 13.9% |
| York Region | 520 | 18.8% |
| Peel Region | 460 | 16.4% |
| City of Vaughan | 358 | 41.6% |
| Halton Region | 350 | 29.9% |
| Bottom Six | ||
| Dryden | -8.3 | -28.8% |
| Huntsville | -4.0 | -18.7% |
| Grimsby | -1.5 | -4.3% |
| Georgian Bluffs | -1.5 | -9.4% |
| Tiny Township | -1.4 | -8.0% |
| Wilmot Township | -1.3 | -6.3% |
The municipalities with the largest budget surpluses as a per cent of revenue were Cassey Township (70.2 per cent), Kerns Township (55.7 per cent) and North Glengarry Township (54.2 per cent). Conversely, the municipalities with the largest budget deficits as a share of revenue were Admaston-Bromley Township (31.6 per cent), Dryden (28.8 per cent) and Amaranth Township (26.1 per cent).
Budget Balances by Population Size
The FAO categorized Ontario’s 444 municipalities into five different population groups: those with populations up to 10,000 (representing 270 municipalities), from 10,000 to 250,000 (158 municipalities), from 250,000 to 750,000 (11 municipalities), from 750,000 to 1.5 million (four municipalities) and the City of Toronto.
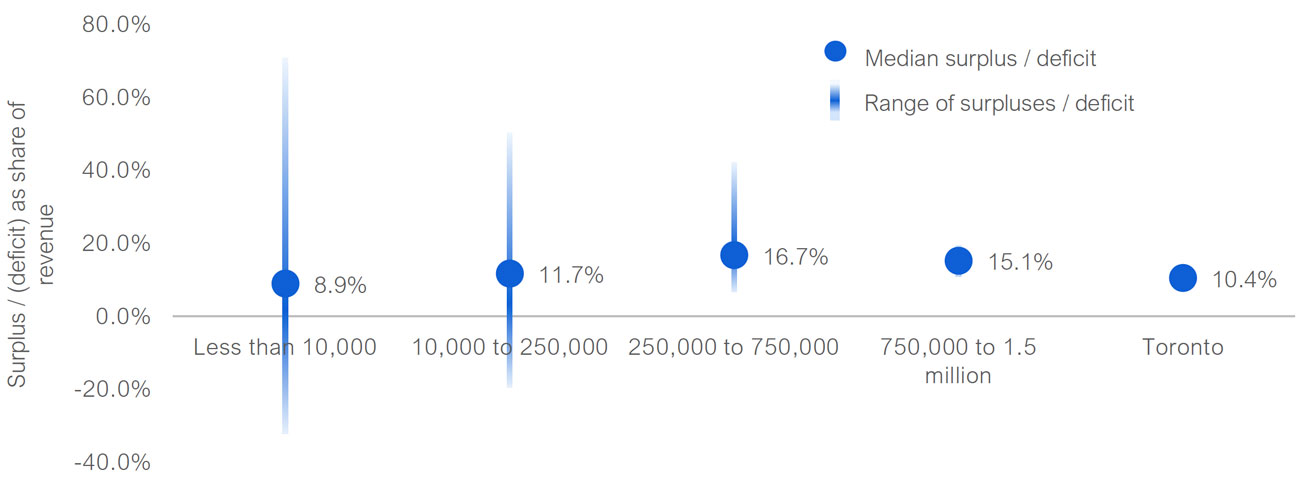
In 2018, the population group with the lowest median[21] budget surplus as a share of revenue was municipalities with populations up to 10,000, followed by the City of Toronto. Municipalities with populations up to 10,000 had a median budget surplus equivalent to 8.9 per cent of revenues. Municipalities with populations above 10,000 but below 250,000 recorded a median budget surplus equivalent to 11.7 per cent of revenue. For municipalities with populations between 250,00 and 750,000, the median budget surplus in 2018 was 16.7 per of revenue, while for municipalities with populations between 750,000 and 1.5 million, the median budget surplus was 15.1 per cent of revenue. Finally, the City of Toronto recorded a budget surplus in 2018 of 10.4 per cent of its revenue.
Figure 4-1 Municipal budget surplus / (deficit) as a share of revenue by size of population
Source: Ministry of Municipal Affairs and Housing’s Financial Information Return (FIR).
The largest variation in budget balances occurred in the two smallest population groups. Municipalities with populations under 10,000 ranged from a budget deficit of 31.6 per cent of revenue to a budget surplus of 70.2 per cent of revenue. Municipalities with populations between 10,000 and 250,000 ranged from a budget deficit of 18.7 per cent of revenue to a budget surplus of 49.6 per cent of revenue. In the 250,000 to 750,000 population group, municipalities recorded budget surpluses as a share of revenue that ranged between 7.3 per cent and 41.6 per cent. For municipalities with populations between 750,000 and 1.5 million, the variation in budget surpluses was relatively small, ranging between 11.5 per cent to 18.8 per cent of revenue.
The considerable variation in budget balances in the two smallest population groups is due to both the number of municipalities in the groups, at 428, and their relative exposure to volatile capital transfers from the federal and provincial governments. For any year, these transfers could represent up to 71 per cent of total revenue for a small municipality and change significantly each year.[22]
Budget Balances by Region
The FAO reviewed financial trends across Ontario’s 11 economic regions, calculating the median budget balance for each region.[23] In 2018, the regions with the highest median budget balances were the Greater Toronto Area (budget surplus of 15.9 per cent of revenue), the London region (budget surplus of 15.1 per cent of revenue), and the Windsor-Sarnia region (budget surplus of 14.8 per cent of revenue). In contrast, the regions with the lowest median budget balances as a share of revenue were Kingston-Pembroke (budget surplus of 6.9 per cent of revenue), the Northwest and Hamilton-Niagara Peninsula regions (budget surpluses of 7.5 per cent of revenue) and the Northeast region (budget surplus of 7.8 per cent of revenue).
Figure 4-2 Median municipal budget surpluses as a per cent of revenue by economic region (2018)
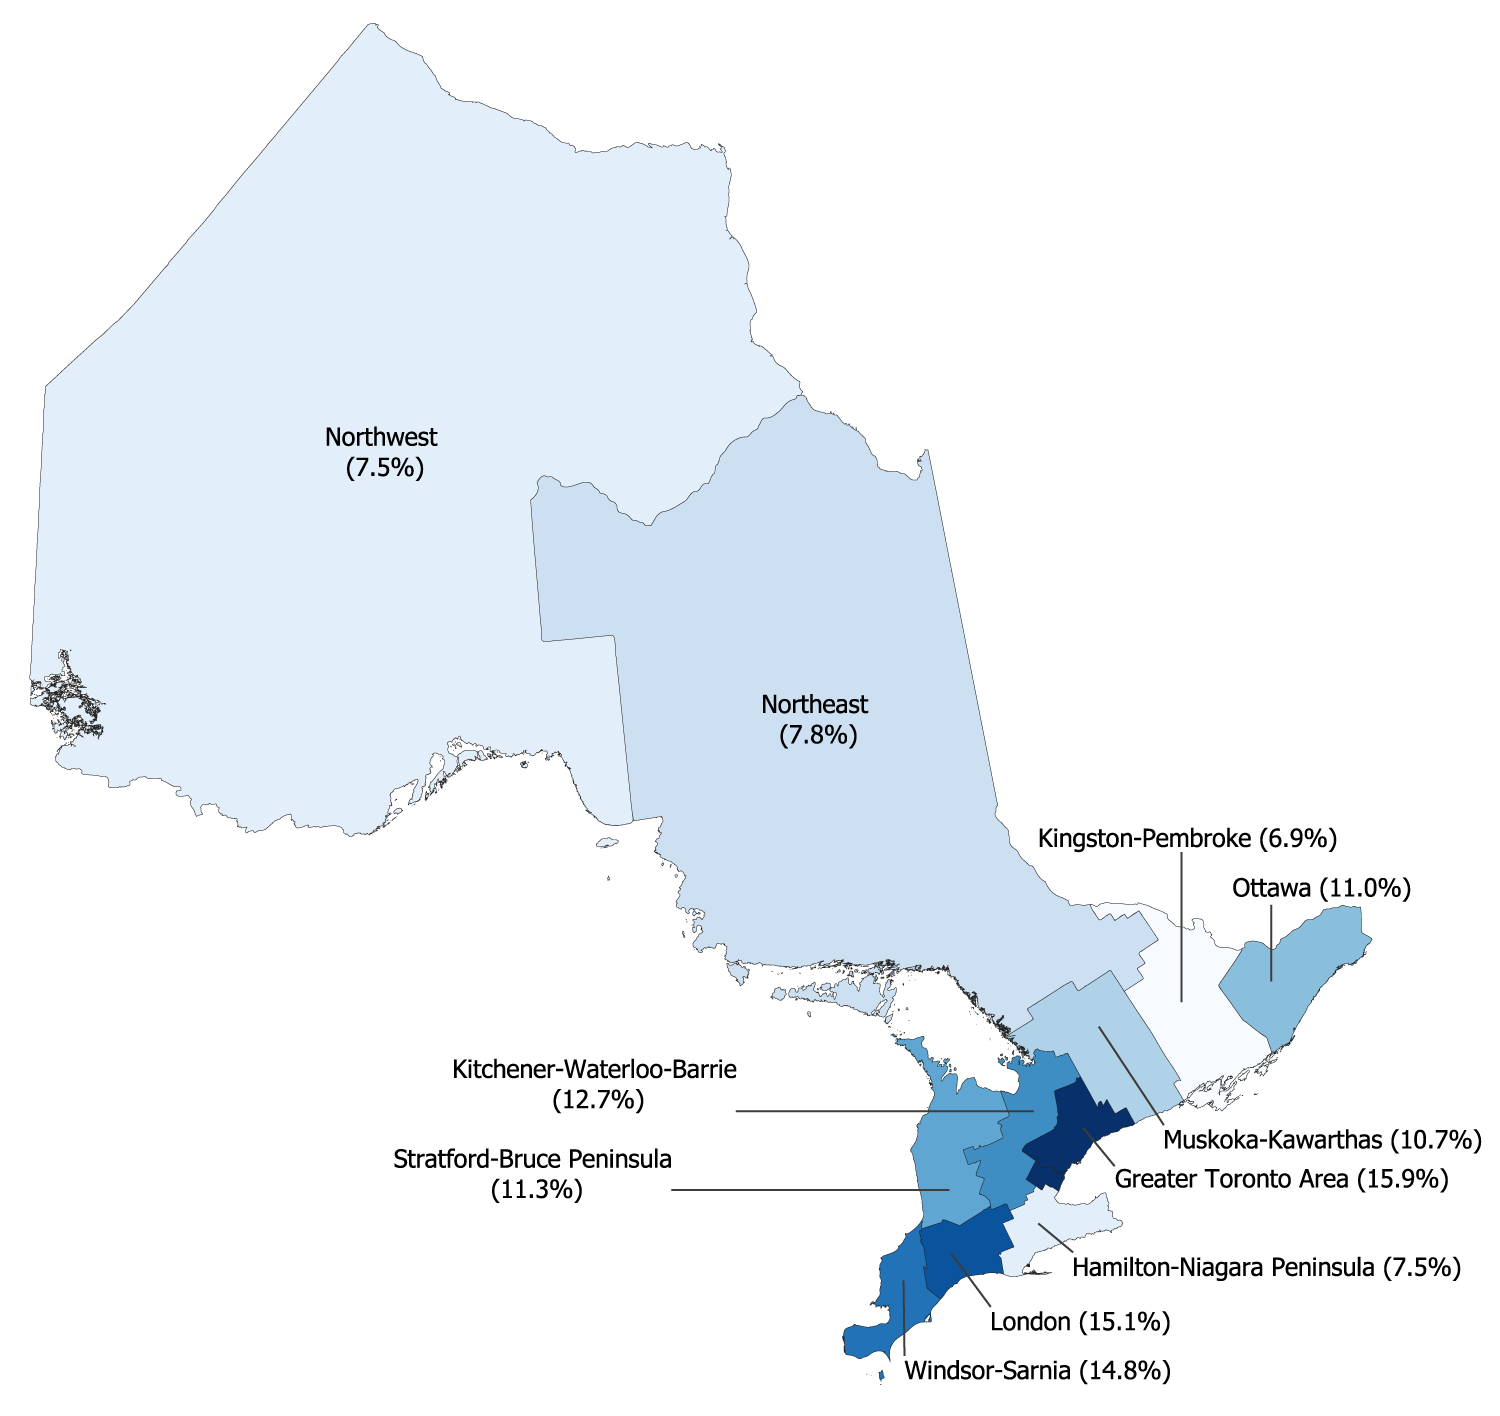
Note: The region labeled as Greater Toronto Area in this figure is defined by Statistics Canada as the Economic Region of Toronto.
Source: Ministry of Municipal Affairs and Housing’s Financial Information Return (FIR) and Statistics Canada.
5 | The Impact of COVID-19 on Municipal Budgets
Beginning in March 2020, the Governments of Ontario and Canada implemented strict economic and social measures to contain the COVID-19 pandemic, including the mandatory closure of non-essential businesses and facilities. These measures resulted in a severe contraction of Ontario’s economy, which the FAO projects will result in a decline in Ontario’s real GDP of 6.8 per cent in 2020, followed by an increase in real GDP of 5.1 per cent in 2021.[24] The economic downturn, along with the added spending required to address the COVID-19 pandemic, has resulted in a significant impact on municipal finances.
This chapter provides the FAO’s assessment of the impact of the COVID-19 pandemic on municipal finances in 2020 and 2021. First, the FAO estimates the financial impact of the pandemic on municipal budget balances. The second section discusses cost savings measures implemented by municipalities to address their budget shortfalls and the impact of the Province’s financial support to municipalities (including federal support through the Safe Restart Agreement). The final section discusses the remaining budget gap, after accounting for municipal cost savings measures and federal-provincial support, and discusses the implications for municipal budgets.
COVID-19 Impact on Municipal Finances in 2020 and 2021
As noted in Chapter 3, in 2018 municipalities recorded a combined budget surplus of $7.4 billion. Prior to the onset of the COVID-19 pandemic, the FAO estimates that municipalities were on track to run combined budget surpluses of $7.9 billion in 2020 and $8.4 billion in 2021. However, the COVID-19 pandemic will result in significantly lower revenues and higher expenses for municipalities. The FAO projects that the COVID-19 pandemic will result in a negative financial impact on municipalities’ budgets of $4.1 billion in 2020 and $2.7 billion in 2021, for a combined negative impact of $6.8 billion over two years. As a result, before taking into account cost savings measures implemented by municipalities and federal-provincial financial support, the FAO estimates that municipalities would have recorded combined budget surpluses of only $3.8 billion in 2020 and $5.7 billion in 2021, due to the COVID-19 pandemic.
Figure 5-1 Estimated financial impact of the COVID-19 pandemic on combined municipal budget surpluses in 2020 and 2021 ($ billions)
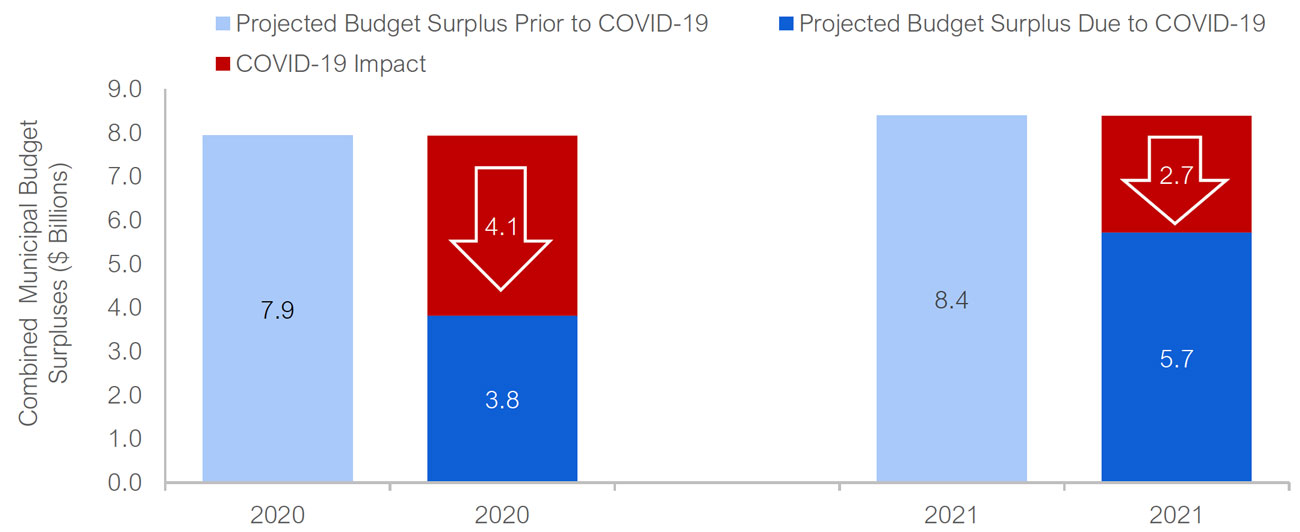
Note: Figures are presented on an accrual accounting basis. Reflects the estimated impact of the COVID-19 pandemic on combined municipal budget balances in 2020 and 2021, prior to cost savings measures implemented by municipalities and federal-provincial financial support.
Source: FAO.
The FAO’s projection of the impact of COVID-19 on municipal budgets reflects the estimated impact from the additional restrictions announced by the Province on November 20, 2020, including moving Toronto and Peel Region into lockdown.[25] The FAO assumes that the restrictions will be gradually lifted starting in January and February of 2021. However, if COVID-19 cannot be contained and significant restrictions continue beyond the beginning of 2021, the financial impact on municipalities could be more severe than estimated in this report.
Revenue Impact
The FAO estimates that municipalities’ combined revenue will decrease by $2.8 billion in 2020 and $1.9 billion in 2021 due to the pandemic, for a total revenue loss of $4.7 billion over two years. The reduction is spread across several revenue sources:
- Transit fees are expected to decline by $1.2 billion in 2020 due to a projected 60 per cent reduction in ridership over the year. Based on the outlooks of several transit agencies,[26] the FAO assumes that ridership will recover to 42 per cent below normal levels in 2021, resulting in a $0.9 billion reduction in transit revenues in 2021.
- Recreation, culture and other user fees are expected to decline by $0.5 billion in 2020 and $0.3 billion in 2021, mainly due to the closure of municipal recreational facilities due to the pandemic.
- Revenue from licences and permits is expected to drop by $0.3 billion in 2020 and $0.2 billion in 2021 due to the cancellation of events in municipal facilities.
- The City of Toronto’s Municipal Land Transfer Tax (MLTT) is estimated to decline by $44 million in 2020 and $50 million in 2021. Despite a projected rise in housing prices, revenue from the MLTT is expected to be negatively impacted by a decline in the volume of sales compared to pre-COVID-19 pandemic estimates.
- Revenue from fines and penalties is expected to decline by $0.1 billion in 2020 and 2021 due to lower revenue from fewer parking and driving-related fines.
- Other revenue is expected to decline by $0.6 billion in 2020 and $0.3 billion in 2021, mainly due to lower parking fees, the loss of gaming revenue and lower investment returns.
| Revenue by Source | 2020 | 2021 | Total | Total per cent Change |
|---|---|---|---|---|
| Transit fees | -1,202 | -917 | -2,119 | -51.9% |
| Recreation, culture and other user fees | -508 | -290 | -798 | -4.1% |
| Licences, permits, rents, etc. | -341 | -234 | -575 | -18.0% |
| City of Toronto Municipal Land Transfer Tax | -44 | -50 | -94 | -4.5% |
| Fines and penalties | -146 | -116 | -262 | -19.3% |
| Other | -579 | -311 | -890 | -1.0% |
| Total Revenue Impact of COVID-19 | -2,819 | -1,918 | -4,738 | -4.0% |
Notably, the FAO does not expect property tax revenues to be materially impacted due to COVID-19. As previously discussed, property tax revenues are typically more stable compared to other revenue sources because changes to property tax assessments can be offset by changes to tax rates, which are set every year. In addition, while some people and businesses may be unable to pay their property tax due to the economic recession, it is still likely that most property tax payable will be collected. Under the Municipal Act, 2001, municipalities have the ability to sell a property in the third year of arrears to collect property tax payable.[27] After this process, if there is still uncollectable property tax, the amount owing would be written off and recorded as an expense.
Expense Impact[28]
Municipal expenses are expected to increase by $1.3 billion in 2020 and $0.8 billion in 2021 for a total of $2.1 billion over two years. The changes impact four key sectors:
- Social housing expense is estimated to be $0.3 billion higher in 2020 and $0.2 billion higher in 2021 due to the costs of providing temporary housing arrangements for people living in shelters, additional costs for materials and supplies (e.g., sanitizers, soap, masks) and cleaning.
- Health expenditures are expected to increase by $0.2 billion in 2020 and 2021, mainly due to the costs for testing, contact tracing, staffing and personal protective equipment.
- Spending on social and family services is expected to increase by $0.2 billion in 2020 and $0.1 billion in 2021 for the additional costs to prevent and contain outbreaks in long-term care homes. Notably, the FAO expects that there will be minimal impact to social assistance programs due to the support provided to individuals from federal government programs, including the Canadian Emergency Response Benefit, enhancements to the Employment Insurance program, and the Canada Recovery Benefit.
- Other expenses are expected to increase by $0.5 billion in 2020 and $0.2 billion in 2021 due to higher spending on overtime for staff, cleaning supplies, policing and waste management services.
| Expense by Function | 2020 | 2021 | Total | Total per cent Change |
|---|---|---|---|---|
| Social housing | 337 | 227 | 564 | 12.5% |
| Health | 222 | 157 | 379 | 7.1% |
| Social and family | 218 | 136 | 354 | 1.9% |
| Other | 522 | 238 | 761 | 1.0% |
| Total Expense Impact of COVID-19 | 1,299 | 758 | 2,057 | 2.0% |
By Population Size and Region
In this section, the FAO presents the estimated impact of the COVID-19 pandemic on municipal budgets by population size and economic region.[29] The FAO estimates that municipal budget balances will deteriorate by a combined $6.8 billion over 2020 and 2021, equivalent to 5.7 per cent of municipalities’ revenue.
Financial Impact by Population Size
The FAO reviewed the financial impact of the COVID-19 pandemic on Ontario’s 444 municipalities by four different population groups: those with populations up to 250,000 (representing 428 municipalities), from 250,000 to 750,000 (11 municipalities), from 750,000 to 1.5 million (four municipalities) and the City of Toronto. The FAO found that municipalities in the first two population groups, up to 250,000 and 250,000 to 750,000, are expected to experience similar financial losses from the COVID-19 pandemic, at an average of 3.6 per cent of revenue in 2020 and 2021. Municipalities with populations between 750,000 and 1.5 million will experience a larger financial impact from the COVID-19 pandemic, at a combined 5.1 per cent of revenue over the next two years. Finally, the City of Toronto is projected to experience the largest relative financial loss from the COVID-19 pandemic, equivalent to 10.7 per cent of revenue over 2020 and 2021.
As previously discussed, COVID-19 significantly reduced revenue from public transit ridership and increased expenses for social services, social housing and health services. Since cities with higher populations tend to rely more heavily on transit fees as a source of revenue and have higher social services, social housing and health services spending, the Province’s four municipalities with populations over 750,000[30] and the City of Toronto are expected to experience the largest relative financial impact from the COVID-19 pandemic.
Figure 5-2 Financial impact in 2020 and 2021 from COVID-19 on municipal budgets by municipal population, as a per cent of revenue
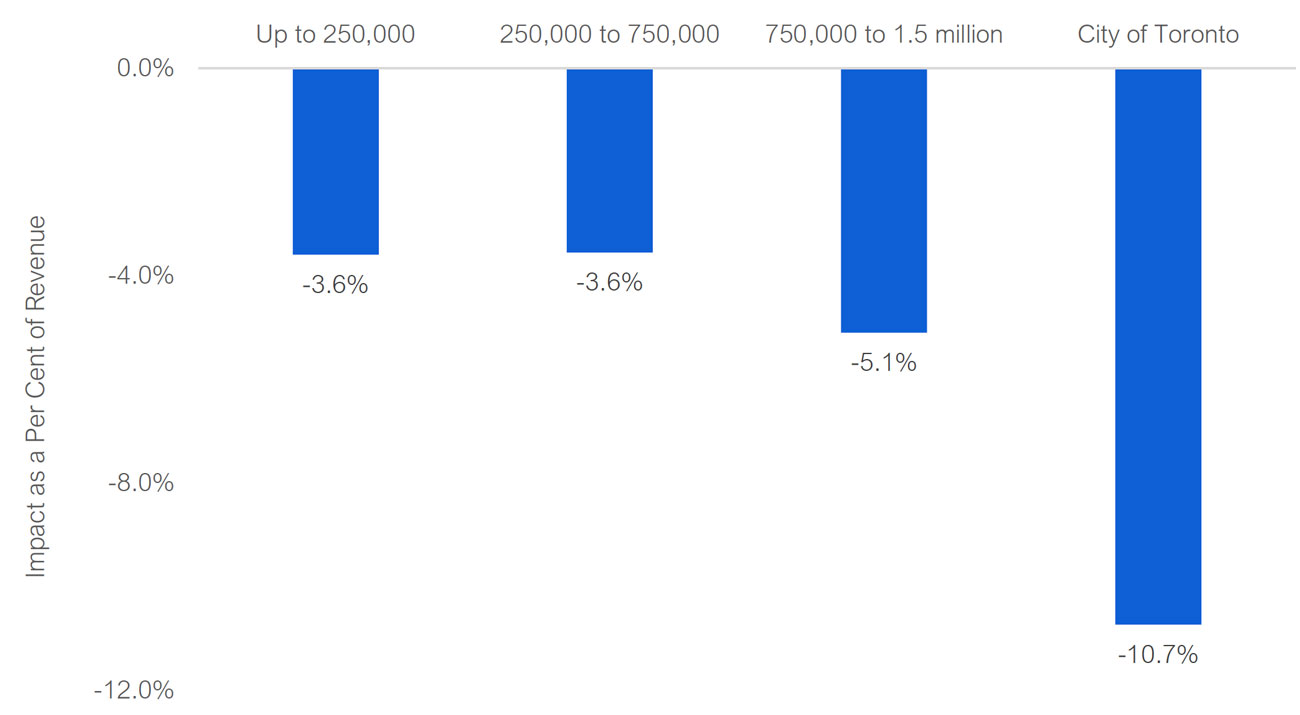
Note: Figures represent estimated financial impacts on municipal budgets prior to cost savings measures implemented by municipalities and federal-provincial financial support.
Source: FAO.
Financial Impact by Region
The FAO estimates that municipalities within the Greater Toronto Area will experience the largest relative financial impact from the COVID-19 pandemic, with a loss equivalent to 7.5 per cent of revenue in 2020 and 2021, or $4.6 billion. The next hardest hit economic region is Ottawa, with an estimated financial impact over two years equivalent to 5.2 per cent of revenue, or $604 million, followed by the Hamilton-Niagara Peninsula at 4.1 per cent of revenue, or $442 million. On the other hand, the economic region with the smallest relative financial impact from the pandemic is the Northwest region, with an estimated financial loss of 2.4 per cent of revenue, or $46 million.
Municipalities in the Greater Toronto Area, Ottawa and the Hamilton-Niagara Peninsula economic regions all experienced relatively more severe financial impacts from the COVID-19 pandemic, compared to municipalities in the other economic regions, due to higher relative public transit revenues and spending for social services, social housing and health services.
Figure 5-3 Financial impact in 2020 and 2021 from COVID-19 on municipal budgets by economic region, as a per cent of revenue
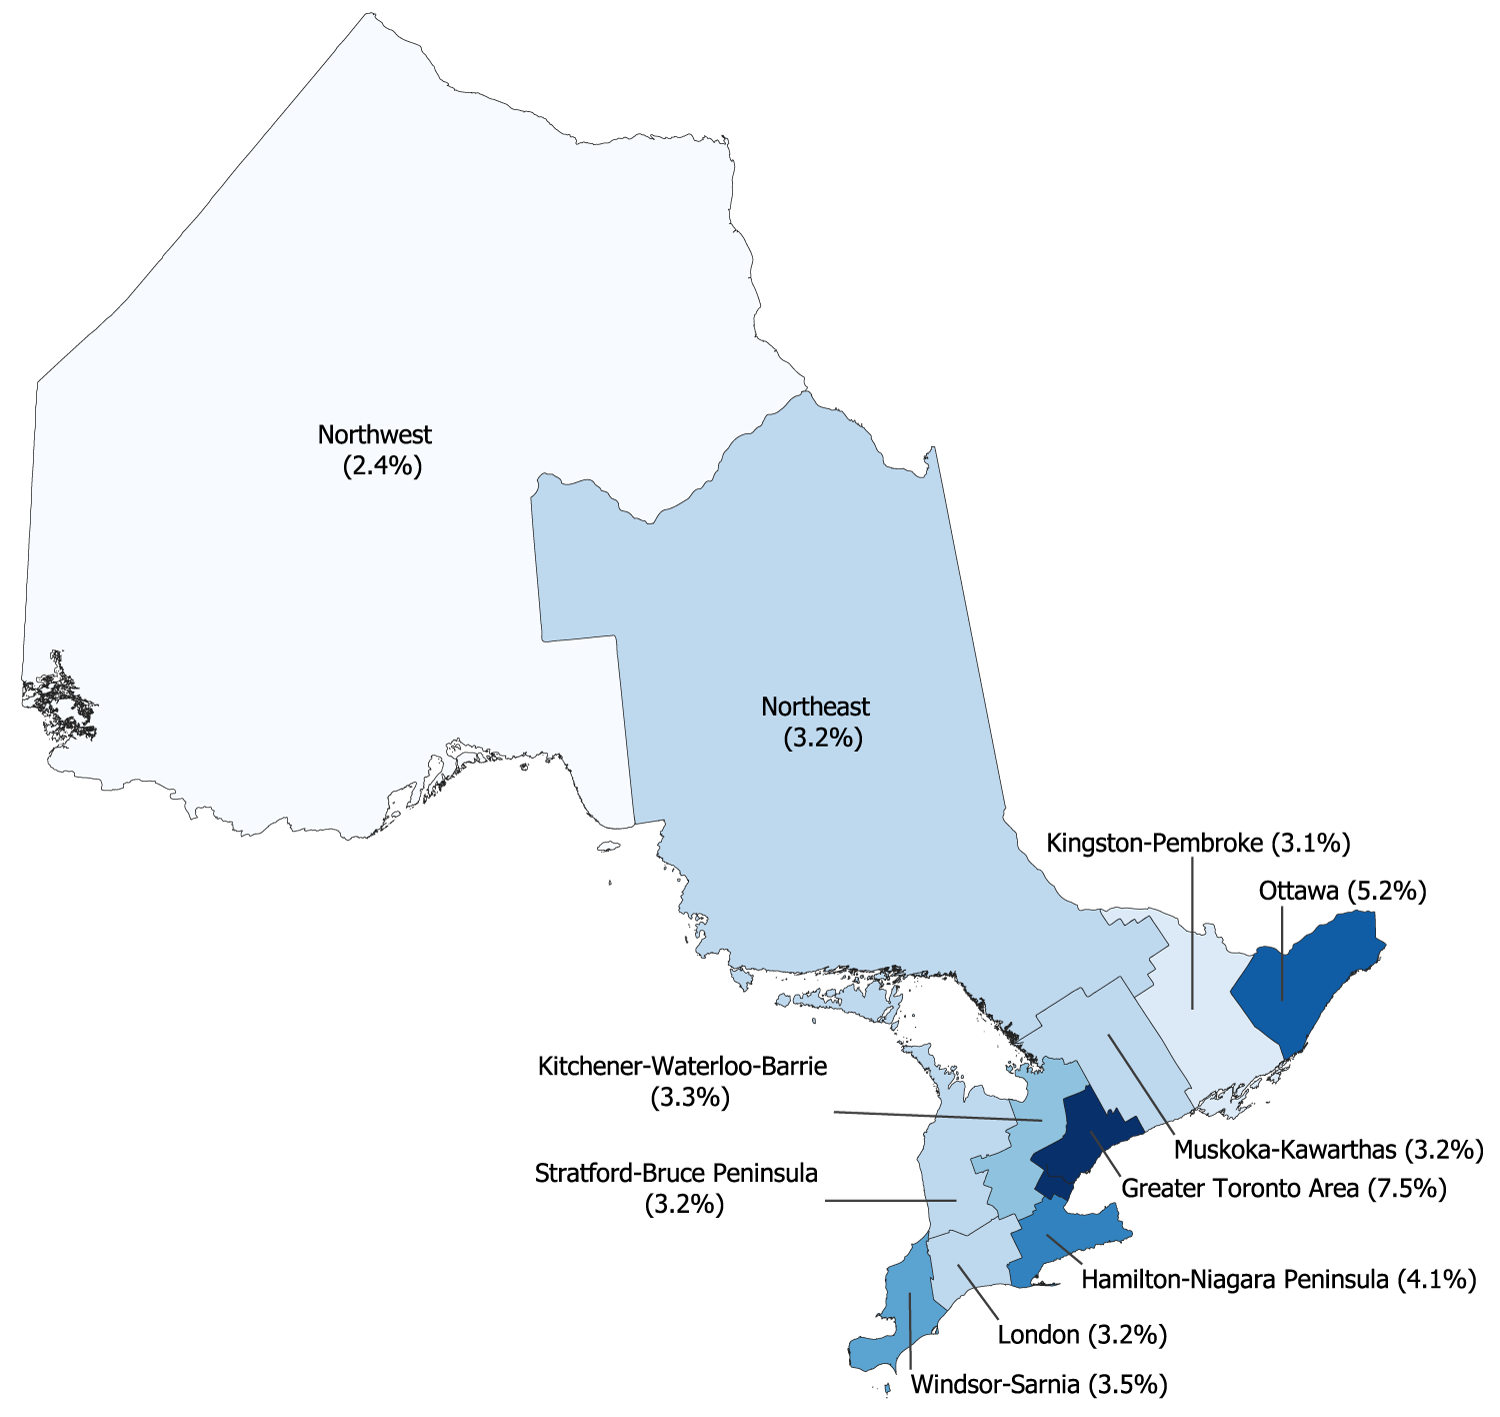
Note: The region labeled as Greater Toronto Area in this figure is defined by Statistics Canada as the Economic Region of Toronto. Figures represent estimated financial impacts on municipal budgets prior to cost savings measures implemented by municipalities and federal-provincial financial support.
Source: FAO and Statistics Canada.
Cost Savings Measures and Federal-Provincial Financial Support
he FAO estimates that the COVID-19 pandemic will result in a negative financial impact to municipalities of $6.8 billion over two years. In response, municipalities implemented cost savings measures and the Province announced up to $4.0 billion in financial support (including federal support through the Safe Restart Agreement).
Cost Savings Measures
The FAO estimates that municipalities have implemented cost savings measures that will reduce spending by $1.1 billion in 2020. Changes to staffing, such as implementing unpaid leave for full-time staff or laying off seasonal and part-time staff, are expected to save municipalities $353 million in 2020, representing 31 per cent of all estimated savings. In addition, municipalities are projected to save $301 million from reductions in public transit services, consisting of 27 per cent of savings. The closure of recreational and other facilities is estimated to save $201 million, or 18 per cent. Finally, other savings measures, such as the cancellation of programs, is estimated to save $265 million, representing 24 per cent of all savings in 2020.
Figure 5-4 $1.1 billion in estimated municipal cost savings measures in 2020, by category, $ millions
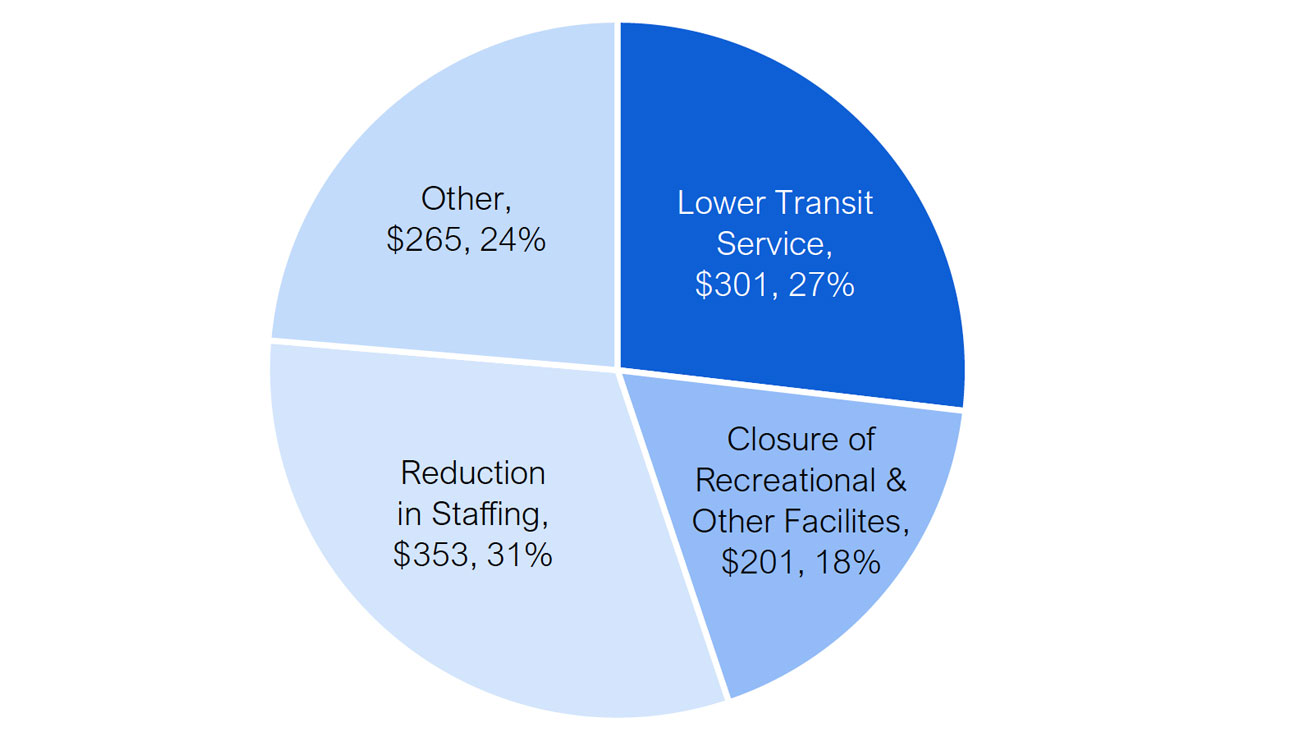
Source: FAO analysis of the municipalities’ financial updates.
The FAO’s estimate of $1.1 billion in cost savings measures implemented by municipalities is for 2020 and does not include any potential savings measures for 2021. As of the writing of this report, municipalities are preparing their 2021 budgets, which may include additional savings measures for 2021.
Federal-Provincial Support
On July 27, 2020, the Province announced that, as part of the Safe Restart Agreement with the federal government, municipalities would receive up to $4.0 billion in support to help mitigate the financial impact of the COVID-19 pandemic.[31] The $4.0 billion in support includes prior announcements and falls under four categories:
- $2.0 billion for municipal transit agencies;
- $1.4 billion for general municipal operating pressures;
- $0.5 billion for homelessness programs, food banks and other social services; and
- $0.1 billion for public health services to support the cost of monitoring, detecting and containing COVID-19.
The Province is contributing $2.2 billion, or 56 per cent of the total support to municipalities, with the federal government contributing $1.8 billion, or 44 per cent.
| Support ($ millions) | Provincial Contribution | Federal Contribution | Total Support |
|---|---|---|---|
| Municipal Transit | 1,000 | 1,000 | 2,000 |
| General Operating Pressures | 613 | 777 | 1,390 |
| Social Services | 510 | – | 510 |
| Public Health Services | 100 | – | 100 |
| Total Support | 2,223 | 1,777 | 4,000 |
Importantly, the $4.0 billion in support is only available to offset general operating pressures in 2020[32] and municipal transit pressures between 2020 and the first quarter of 2021 (through March 31, 2021).[33] To date, the Province has allocated $2.0 billion of the available funding to municipalities: $666 million in support for municipal transit, $695 million to address general operating pressures, $510 million for social services and $100 million for public health services.[34] The remaining $2.0 billion in available funding will only be provided to municipalities that are able to demonstrate outstanding general operating pressures in 2020 (up to $695 million in remaining available support) and transit pressures in 2020 and the first quarter of 2021 (up to $1,334 million in remaining available support).
| Support ($ millions) | Total Available Support | Allocated to Municipalities | Remaining Available Support |
|---|---|---|---|
| Municipal Transit | 2,000 | 666 | 1,334 |
| General Operating Pressures | 1,390 | 695 | 695 |
| Social Services | 510 | 510 | – |
| Public Health Services | 100 | 100 | – |
| Total Support | 4,000 | 1,971 | 2,029 |
The FAO projects that, by the end of 2020, municipalities will drawdown $1,053 million of the remaining available support: $536 million to address remaining 2020 transit pressures and $517 million to address remaining 2020 general operating pressures.[35] As a result, by the end of 2020, $798 million of transit support and $178 million of general operating support will be unused, for a total of $976 million in unused federal-provincial financial support.
| Support ($ millions) | Remaining Available Support | Projected 2020 Drawdown of Remaining Support | Unused Support as of December 31, 2020 |
|---|---|---|---|
| Municipal Transit | 1,334 | 536 | 798 |
| General Operating Pressures | 695 | 517 | 178 |
| Social Services | – | – | – |
| Public Health Services | – | – | – |
| Total Support | 2,029 | 1,053 | 976 |
In summary, $3.0 billion of the $4.0 billion in federal-provincial support will be used in 2020, leaving $1.0 billion potentially available for municipalities to offset COVID-19 budget pressures in 2021. However, as noted above and discussed further in the next section, not all municipal budget pressures in 2021 are eligible for the remaining federal-provincial support.
Implications for Municipal Budgets in 2020 and 2021
2020 Municipal Budgets
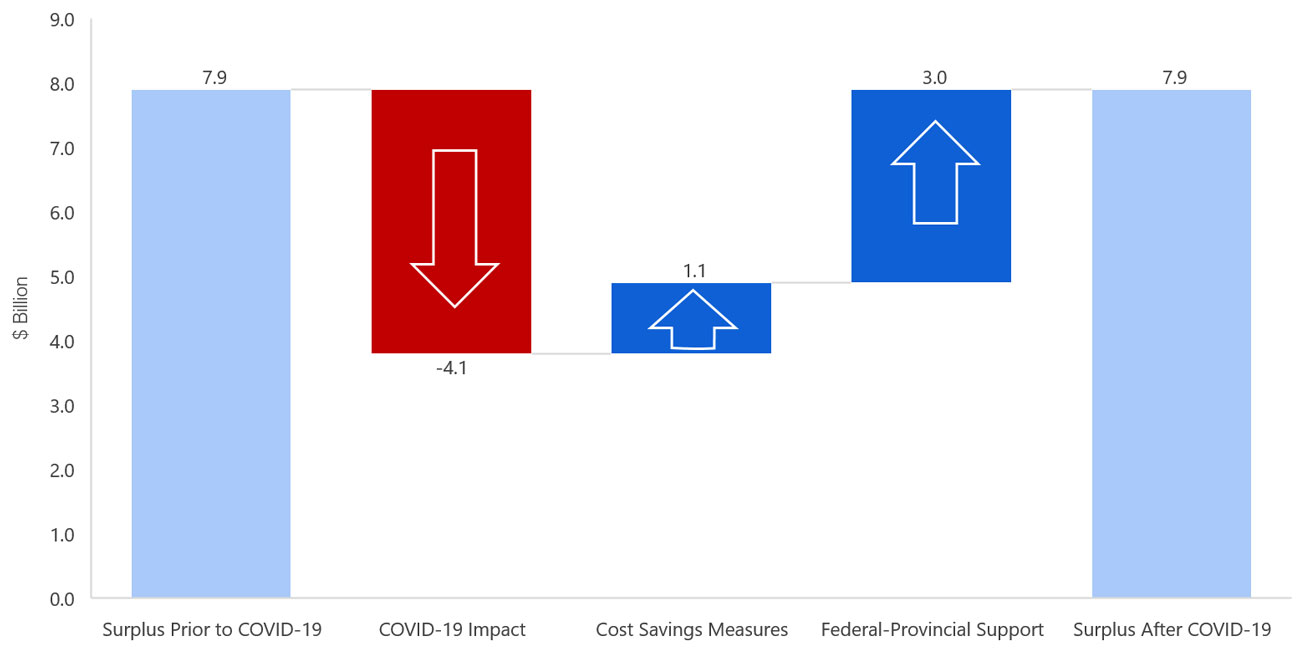
Prior to the onset of the COVID-19 pandemic, municipalities were projected to run a combined budget surplus of $7.9 billion in 2020. The FAO estimates that the COVID-19 pandemic will result in a $4.1 billion financial impact to municipalities in 2020. However, municipal cost savings measures totalling $1.1 billion and $3.0 billion in federal-provincial support (of the $4.0 billion in available support) will allow municipalities to completely mitigate the $4.1 billion financial impact from COVID-19 in 2020.
Figure 5-5 Impact of COVID-19 on combined municipal budget balance in 2020 ($ billions)
Note: Figures are presented on an accrual accounting basis.
Source: FAO.
2021 Municipal Budgets
Prior to the onset of the COVID-19 pandemic, municipalities were projected to run a combined budget surplus of $8.4 billion in 2021. The FAO estimates that the COVID-19 pandemic will result in a $2.7 billion financial impact to municipalities in 2021. Of this $2.7 billion financial impact, $0.9 billion is from municipal transit pressures and $1.8 billion is from other budget pressures such as social services, health and general operating costs.
As of the writing of this report, municipalities are preparing their budgets for 2021. Given that budget decisions have not been finalized, the FAO provides the following observations:
Remaining Federal-Provincial Support: The FAO projects that municipalities will utilize $3.0 billion of the $4.0 billion in federal-provincial support in 2020, leaving up to $1.0 billion available for municipalities in 2021 ($0.2 billion for general operating pressures and $0.8 billion for transit pressures). However, under the Province’s funding terms, the federal-provincial support is only available to offset general operating pressures in 2020 and transit pressures in 2020 and the first quarter of 2021. Therefore, although municipalities face general operating pressures of $1.8 billion in 2021, municipalities will not be able to access the remaining $0.2 billion in federal-provincial support earmarked for general operating pressures unless the Province changes the rules governing access to this funding.
Regarding transit support, the FAO estimates that the full-year 2021 municipal transit pressure from COVID-19 is $0.9 billion, of which $0.3 billion is from the first quarter of 2021. Therefore, of the remaining $0.8 billion in federal-provincial support earmarked for transit pressures, only $0.3 billion will be provided to municipalities in 2021, leaving $0.5 billion unallocated unless the Province changes the rules governing access to this funding.
In summary, of the $4.0 billion in federal-provincial support announced by the Province, the FAO projects that municipalities will receive $3.0 billion in 2020 and $0.3 billion in 2021. This leaves unallocated federal-provincial support of $0.7 billion that municipalities will not be able to access, even though municipalities will still have $2.4 billion in remaining 2021 budget pressures from the COVID-19 pandemic.
Utilization of Reserve Funds: For the remaining $2.4 billion in 2021 budget pressures, municipalities may decide to utilize reserve funds as available. As noted earlier in this report, as of 2018, municipalities had a combined $1.7 billion in reserve funds earmarked for budget stabilization, such as mitigating the impact of recessions. The FAO projects that these budget stabilization reserve funds will reach a combined $1.8 billion by 2021. Note that the actual amount of available reserve funds will vary by municipality.
Additional Mitigation Measures: Municipalities may decide to implement additional measures in 2021 to either increase revenue (e.g., increase taxes or user fees) or reduce spending (e.g., lower services or cutbacks in staffing). In 2020, municipalities will achieve an estimated $1.1 billion in cost saving measures. However, many of these measures were time limited during the full lockdown at the beginning of the COVID-19 pandemic (e.g., closure of recreational facilities and unpaid staff leave) and municipalities may find it difficult to find this level of savings in 2021.
Reduced Budget Surpluses: Municipalities may decide to run reduced budget surpluses or budget deficits in 2021.[36] The FAO estimates that, without any further measures, the remaining $2.4 billion financial impact in 2021 will reduce municipalities’ combined budget surplus to $6.0 billion. However, while $6.0 billion represents a significant budget surplus in aggregate, some individual municipalities may face budget deficits, particularly on a cash operating basis. As noted previously, Provincial legislation requires municipalities to plan for balanced cash operating budgets, so even if a municipality is projecting an accrual-based balanced budget, action would still need to be taken if the municipality is facing a cash operating budget deficit.
6 | Appendices
A. Comparison to Municipal Operating Budgets
In this report, the FAO presents municipal budgets on an accrual accounting basis, which aligns with municipalities’ audited annual financial statements, the presentation of the Province’s finances in Ontario Budgets and the Public Accounts of Ontario, and is consistent with public sector accounting standards. However, every year municipalities present operating and capital budgets based on modified-cash concepts. Part of the reason for the different budget presentations is that under the Municipal Act, 2001, municipalities must plan to have a balanced budget every year on a cash operating budget basis rather than an accrual budget basis.[37]
Differences between these two budget presentations results in some municipalities recording accrual-based budget deficits but cash operating budget surpluses. It also results in some municipalities recording significant accrual-based budget surpluses but smaller budget surpluses on a cash operating basis. In contrast to accrual-based budgets, municipalities’ cash operating budgets:
- On the revenue-side, exclude dedicated revenue to capital (such as development charges), donations of capital, federal and provincial cash transfers for the purposes of capital and net income from government businesses enterprises; and
- On the expense-side, exclude amortization expense and other non-cash adjustments (e.g., pensions), and include transfers to reserve funds and capital funded from the operating budget.
After adjusting for these differences, the FAO estimates that municipalities recorded a combined cash operating budget surplus of approximately $0.9 billion in 2018, compared to an accrual-based budget surplus of $7.4 billion.
B. Development of this Report
Authority
The Financial Accountability Officer decided to undertake the analysis presented in this report under paragraph 10(1)(a) of the Financial Accountability Officer Act, 2013.
Key Questions
The following key questions were used as a guide while undertaking research for this report:
- What was the state of municipal finances prior to the pandemic? How do municipal finances differ by region and the size of the municipality?
- What is the impact of the COVID-19 pandemic on municipal finances, including by region and municipal population group?
- Is the federal and provincial financial support to municipalities through the Safe Restart Agreement adequate to fully offset the impact of COVID-19 on municipal finances?
- If there is any remaining financial shortfall after the support from the Safe Restart Agreement, what are the implications for municipal budgets?
Methodology
This report was prepared based on publicly available information, including the Financial Information Return (FIR) from the Ministry of Municipal Affairs and Housing.[38] The FIR provides detailed financial information for Ontario’s 444 municipalities, based on their annual financial statements. The most recent year with data from all municipalities is 2018.
Based on this data, the FAO projected municipal budget balances to 2021, prior to the impact of COVID-19, using a combination of growth rates from historical trends and economic indicators.
The FAO estimated the impact of COVID-19 on major municipal revenue and expenditure categories using data from the FAO’s economic projections, real-time statistics on the impact of COVID-19, external research on the financial impact to municipalities, and COVID-19 financial updates from 18 municipalities. These 18 municipalities, which were selected to represent municipalities of different population sizes and regions in Ontario, include: City of Brampton, City of Greater Sudbury, City of Guelph, City of Hamilton, City of Kitchener, City of London, City of Markham, City of Mississauga, City of Ottawa, City of Peterborough, City of Toronto, City of Windsor, Halton Region, Niagara Region, Peel Region, Town of Oakville, Uxbridge Township, and Waterloo Region.
More information on the FAO’s data and methodology is available upon request.
All dollar amounts are in Canadian, current dollars (i.e., not adjusted for inflation) unless otherwise noted.
| Year | Combined budget surpluses ($ billions) |
|---|---|
| 2009 | 3.6 |
| 2010 | 6.1 |
| 2011 | 5.2 |
| 2012 | 5.3 |
| 2013 | 4.5 |
| 2014 | 4.4 |
| 2015 | 6.2 |
| 2016 | 6.0 |
| 2017 | 7.4 |
| 2018 | 7.4 |
| Year | Total revenue ($ billions) |
|---|---|
| 2009 | 38.9 |
| 2010 | 43.0 |
| 2011 | 42.8 |
| 2012 | 43.4 |
| 2013 | 43.5 |
| 2014 | 45.0 |
| 2015 | 47.9 |
| 2016 | 48.7 |
| 2017 | 51.3 |
| 2018 | 54.3 |
| Source | $ billions | Per cent |
|---|---|---|
| Fines and Penalties | 0.6 | 1 |
| Land Transfer Tax | 0.7 | 1 |
| Licenses, Permits, Rents, etc | 1.4 | 3 |
| Other Revenue | 6.8 | 12 |
| User Fees & Service Charges | 10.8 | 20 |
| Transfers from Other Governments | 12.2 | 22 |
| Property Taxation | 21.8 | 40 |
| Year | Property tax revenue ($ billions) |
|---|---|
| 2009 | 15.8 |
| 2010 | 16.4 |
| 2011 | 16.9 |
| 2012 | 17.6 |
| 2013 | 18.1 |
| 2014 | 18.7 |
| 2015 | 19.4 |
| 2016 | 20.1 |
| 2017 | 20.8 |
| 2018 | 21.8 |
| Source | $ billions | Per cent |
|---|---|---|
| Rebates | -0.3 | -1 |
| Industrial | 0.8 | 4 |
| Other | 1.0 | 5 |
| Commercial | 4.6 | 21 |
| Residential | 15.7 | 72 |
| Year | Revenue from other governments ($ billions) |
|---|---|
| 2009 | 9.2 |
| 2010 | 12.0 |
| 2011 | 10.5 |
| 2012 | 9.9 |
| 2013 | 9.7 |
| 2014 | 9.8 |
| 2015 | 10.4 |
| 2016 | 10.3 |
| 2017 | 10.6 |
| 2018 | 12.2 |
| Use of revenue | $ billions | Per cent |
|---|---|---|
| Planning and development | 0.1 | 0 |
| General government | 0.1 | 1 |
| Recreation and cultural services | 0.1 | 1 |
| Protection services | 0.2 | 2 |
| Environmental services | 0.5 | 4 |
| Social Housing | 0.7 | 5 |
| Health services | 1.2 | 10 |
| Transportation services | 1.6 | 13 |
| Other | 1.9 | 15 |
| Social and family services | 5.9 | 48 |
| Year | User fee revenue ($ billions) |
|---|---|
| 2009 | 7.3 |
| 2010 | 7.8 |
| 2011 | 8.3 |
| 2012 | 8.8 |
| 2013 | 8.7 |
| 2014 | 9.1 |
| 2015 | 9.4 |
| 2016 | 10.1 |
| 2017 | 10.2 |
| 2018 | 10.8 |
| Source | $ billions | Per cent |
|---|---|---|
| Health services | 0.0 | 0 |
| General government | 0.2 | 2 |
| Social housing | 0.2 | 2 |
| Planning and development | 0.2 | 2 |
| Protection services | 0.3 | 3 |
| Other | 0.3 | 3 |
| Social and family services | 0.4 | 4 |
| Recreation and cultural services | 0.7 | 7 |
| Transportation services | 2.2 | 20 |
| Environmental services | 6.2 | 57 |
| Year | Total expense ($ billions) | Real per capita expense (2018 $) |
|---|---|---|
| 2009 | 35.2 | 3,218 |
| 2010 | 36.9 | 3,253 |
| 2011 | 37.5 | 3,181 |
| 2012 | 38.2 | 3,162 |
| 2013 | 39.0 | 3,167 |
| 2014 | 40.6 | 3,199 |
| 2015 | 41.6 | 3,218 |
| 2016 | 42.6 | 3,196 |
| 2017 | 44.0 | 3,203 |
| 2018 | 46.8 | 3,274 |
| Function | $ billions | Per cent |
|---|---|---|
| Transportation | 10.7 | 23 |
| Social and Family | 10.4 | 22 |
| Protection | 8.0 | 17 |
| Environmental | 7.0 | 15 |
| Rec and Cultural | 4.6 | 10 |
| General Government | 2.2 | 5 |
| Health | 2.4 | 5 |
| Planning and Development | 1.1 | 2 |
| Other | 0.4 | 1 |
| Year | Transportation expense ($ billions) |
|---|---|
| 2009 | 7.8 |
| 2010 | 8.2 |
| 2011 | 8.3 |
| 2012 | 8.7 |
| 2013 | 9.1 |
| 2014 | 9.5 |
| 2015 | 9.4 |
| 2016 | 9.7 |
| 2017 | 9.9 |
| 2018 | 10.7 |
| Source | $ billions | Per cent |
|---|---|---|
| Transit | 5.1 | 48 |
| Roads | 3.9 | 37 |
| Winter control | 0.8 | 8 |
| Other | 0.3 | 3 |
| Street lighting | 0.3 | 2 |
| Parking | 0.2 | 2 |
| Air Transportation | 0.1 | 1 |
| Year | Social and family expense ($ billions) |
|---|---|
| 2009 | 9.0 |
| 2010 | 9.2 |
| 2011 | 8.6 |
| 2012 | 8.6 |
| 2013 | 8.5 |
| 2014 | 8.7 |
| 2015 | 9.0 |
| 2016 | 9.1 |
| 2017 | 9.6 |
| 2018 | 10.4 |
| Source | $ billions | Per cent |
|---|---|---|
| General Assistance | 4.4 | 43 |
| Child Care | 2.1 | 20 |
| Assistance to Aged Persons | 1.8 | 17 |
| Public Housing | 1.2 | 11 |
| Non-Profit/Co-op Housing | 0.5 | 5 |
| Other | 0.4 | 4 |
| Rent Supplements | 0.2 | 2 |
| Year | Protection services expense ($ billions) |
|---|---|
| 2009 | 5.8 |
| 2010 | 6.2 |
| 2011 | 6.5 |
| 2012 | 6.7 |
| 2013 | 6.9 |
| 2014 | 7.3 |
| 2015 | 7.4 |
| 2016 | 7.6 |
| 2017 | 7.7 |
| 2018 | 8.0 |
| Source | $ billions | Per cent |
|---|---|---|
| Police | 4.5 | 56 |
| Fire | 2.4 | 30 |
| Protection and Inspection | 0.3 | 4 |
| Building Permits and Inspection | 0.3 | 4 |
| Provincial Offences Act | 0.2 | 2 |
| Conservation Authority | 0.2 | 2 |
| Court Security | 0.1 | 1 |
| Emergency Measures | 0.0 | 1 |
| Prisoner Transportation | 0.0 | 0 |
| Other | 0.0 | 0 |
| Year | Environmental services expense ($ billions) |
|---|---|
| 2009 | 5.0 |
| 2010 | 5.2 |
| 2011 | 5.4 |
| 2012 | 5.7 |
| 2013 | 5.7 |
| 2014 | 5.9 |
| 2015 | 6.3 |
| 2016 | 6.4 |
| 2017 | 6.7 |
| 2018 | 7.0 |
| Source | $ billions | Per cent |
|---|---|---|
| Wastewater Treatment & Disposal | 1.4 | 20 |
| Water Distribution | 1.3 | 18 |
| Wastewater Collection | 1.1 | 16 |
| Water Treatment | 1.0 | 14 |
| Water Diversion | 0.7 | 11 |
| Solid Waste Disposal | 0.5 | 7 |
| Urban Storm Sewer | 0.4 | 6 |
| Solid Waste Collection | 0.3 | 4 |
| Other | 0.2 | 3 |
| Rural Storm Sewer | 0.0 | 0 |
| Year | Recreation and cultural services expense ($ billions) |
|---|---|
| 2009 | 3.4 |
| 2010 | 3.4 |
| 2011 | 3.8 |
| 2012 | 3.7 |
| 2013 | 3.8 |
| 2014 | 4.0 |
| 2015 | 4.2 |
| 2016 | 4.3 |
| 2017 | 4.4 |
| 2018 | 4.6 |
| Source | $ billions | Per cent |
|---|---|---|
| Recreation Facilities (Other) | 1.4 | 30 |
| Parks | 0.9 | 21 |
| Libraries | 0.8 | 18 |
| Recreation Programs | 0.8 | 17 |
| Cultural Services | 0.4 | 9 |
| Recreation Facilities (Golf, Marina, Ski) | 0.1 | >2 |
| Museums | 0.1 | 2 |
| Other | 0.1 | 1 |
| Year | Health services expense ($ billions) |
|---|---|
| 2009 | 1.7 |
| 2010 | 1.9 |
| 2011 | 1.9 |
| 2012 | 2.0 |
| 2013 | 2.1 |
| 2014 | 2.1 |
| 2015 | 2.2 |
| 2016 | 2.2 |
| 2017 | 2.4 |
| 2018 | 2.4 |
| Source | $ billions | Per cent |
|---|---|---|
| Ambulance Services | 1.4 | 57 |
| Public Health Services | 0.9 | 38 |
| Ambulance Dispatch | 0.0 | 2 |
| Cemeteries | 0.0 | 2 |
| Hospitals | 0.0 | 1 |
| Other | 0.0 | 0 |
| Year | Net debt ($ billions) |
|---|---|
| 2009 | 0.3 |
| 2010 | 1.8 |
| 2011 | 1.9 |
| 2012 | 1.4 |
| 2013 | 1.9 |
| 2014 | 3.1 |
| 2015 | 3.2 |
| 2016 | 2.8 |
| 2017 | 2.1 |
| 2018 | 1.4 |
| Year | Accumulated surplus ($ billions) |
|---|---|
| 2009 | 119.2 |
| 2010 | 125.4 |
| 2011 | 130.6 |
| 2012 | 136.2 |
| 2013 | 140.8 |
| 2014 | 145.2 |
| 2015 | 151.8 |
| 2016 | 157.8 |
| 2017 | 165.3 |
| 2018 | 172.6 |
| Purpose | $ billions | Per cent |
|---|---|---|
| Earmarked Reserves – Obligatory Spending | 8.9 | 28 |
| Earmarked Reserves – Discretionary Spending | 21.4 | 67 |
| Budget Stabilization Funds | 1.7 | 5 |
| Population | Surplus as a per cent of revenue (per cent) |
|---|---|
| Less than 10,000 | 8.9 |
| 10,000 to 250,000 | 11.7 |
| 250,000 to 750,000 | 16.7 |
| 750,000 to 1.5 million | 15.1 |
| City of Toronto | 10.4 |
| Economic Region | Surplus as a per cent of revenue (per cent) |
|---|---|
| Northwest | 7.5 |
| Northeast | 7.8 |
| Kingston-Pembroke | 6.9 |
| Ottawa | 11.0 |
| Muskoka-Kawarthas | 10.7 |
| Kitchener-Waterloo-Barrie | 12.7 |
| Greater Toronto Area | 15.9 |
| Hamilton-Niagara Peninsula | 7.5 |
| Stratford-Bruce Peninsula | 11.3 |
| London | 15.1 |
| Windsor-Sarnia | 14.8 |
| 2020 | 2021 | |
|---|---|---|
| Projected Budget Surplus Prior to COVID-19 | 7.9 | 8.4 |
| COVID-19 Impact | 4.1 | 2.7 |
| Projected Budget Surplus Due to COVID-19 | 3.8 | 5.7 |
| Population | Impact (per cent) |
|---|---|
| Up to 250,000 | -3.6 |
| 250,000 to 750,000 | -3.6 |
| 750,000 to 1.5 million | -5.1 |
| City of Toronto | -10.7 |
| Economic Region | Impact (per cent) |
|---|---|
| Northwest | 2.4 |
| Northeast | 3.2 |
| Kingston-Pembroke | 3.1 |
| Ottawa | 5.2 |
| Muskoka-Kawarthas | 3.2 |
| Kitchener-Waterloo-Barrie | 3.3 |
| Greater Toronto Area | 7.5 |
| Hamilton-Niagara Peninsula | 4.1 |
| Stratford-Bruce Peninsula | 3.2 |
| London | 3.2 |
| Windsor-Sarnia | 3.5 |
| Category | $ millions | Per cent |
|---|---|---|
| Lower Transit Service | 301 | 27 |
| Closure of Recreational & Other Facilities | 201 | 18 |
| Reduction in Staffing | 353 | 31 |
| Other | 265 | 24 |
| Impact ($ billions) | |
|---|---|
| Surplus Prior to COVID-19 | 7.9 |
| COVID-19 Impact | -4.1 |
| Cost Savings Measures | 1.1 |
| Federal-Provincial Support | 3.0 |
| Surplus After COVID-19 | 7.9 |
Footnotes
[1] The most recent year for which comprehensive actual data is available is 2018.
[2] In this report, the FAO presents municipal budgets on an accrual accounting basis, which aligns with municipalities’ audited annual financial statements, the presentation of the Province’s finances in Ontario Budgets and the Public Accounts of Ontario, and is consistent with public sector accounting standards . However, m unicipalities also publicly present operating and capital budgets based on modified-cash concepts. Under Provincial legislation, municipalities must plan to have a balanced budget every year on a cash operating budget basis, rather than an accrual budget basis, and can only issue long-term debt for capital projects. In Appendix A, the FAO provides information on the differences between the two accounting presentations.
[3] The calculation is similar to net debt except that it also includes the value of municipalities’ infrastructure assets.
[4] Notably, the FAO does not expect property tax revenues to be materially impacted due to the COVID-19 pandemic. See Chapter 5 for more information.
[5] Municipalities cannot plan for cash operating budget deficits but can plan to run budget deficits on an accrual accounting basis. See Appendix A for more information.
[6] Municipal responsibilities are largely assigned through the Municipal Act, 2001 and the City of Toronto Act, 2006.
[7] Part XIII Debt and Investment, Municipal Act, 2001.
[9] For the FAO’s review of the impact of the COVID-19 pandemic on Ontario’s economy and the Province’s finances, see FAO, “Economic and Budget Outlook,” Fall 2020.
[10] FAO, “Ontario Health Sector: A Preliminary Review of the Impact of the COVID-19 Outbreak on Hospital Capacity,” 2020.
[11] FAO, “Federal and Provincial COVID-19 Response Measures,” 2020.
[12] Letter from the Association of Municipalities Ontario, “Re: Financial Assistance for Municipal Governments,” May 8, 2020.
[13] Government of Ontario, “Historic Agreement Delivers up to $4 Billion to Support Municipalities and Transit,” July 27, 2020.
[14] In this report, the FAO presents municipal budgets on an accrual accounting basis, which aligns with municipalities’ audited annual financial statements, the presentation of the Province’s finances in Ontario Budgets and the Public Accounts of Ontario, and is consistent with public sector accounting standards . Municipalities also publicly present operating and capital budgets based on modified-cash concepts. See Appendix A for more information.
[15] The municipal fiscal year is the same as the calendar year and the numbers provided are for the period ending December 31, unless otherwise noted. The latest year for which actual complete data is available is 2018.
[16] For more information, see https://www.ontario.ca/document/tools-municipal-budgeting-and-long-term-financial-planning/understanding-municipal-debt.
[17] Municipal property tax revenue excludes revenue from the Education Property Tax and includes revenue from payments-in-lieu of taxation.
[18] Figures represent property tax assessment values from the Ministry of Municipal Affairs and Housing’s Financial Information Return.
[19] Transfers from other municipalities represent cash transfers across municipalities for shared capital projects.
[20] As noted previously, in this report, the FAO presents municipal budgets on an accrual accounting basis, which aligns with municipalities’ audited annual financial statements, the presentation of the Province’s finances in Ontario Budgets and the Public Accounts of Ontario, and is consistent with public sector accounting standards. Municipalities also publicly present operating and capital budgets based on modified-cash concepts. See Appendix A for more information.
[21] The median is the middle number in each group. The FAO presents the median by population group, rather than the average, to reduce the impact of the dominant city in each group, particularly in the comparison by economic regions below.
[22] The municipalities with the highest capital transfer revenue as a share of revenue in 2018 were the townships of Casey (71 per cent), Kerns (60 per cent), and Dorion (53 per cent). Casey Township experienced a large change in its capital transfer revenue as a share of revenue, which increased by 66 percentage points from 2017, followed by Kerns at 58 percentage points.
[23] Defined by Statistics Canada, Ontario’s economic regions are groupings of census divisions used to create a standard geographical unit for analyzing regional economic activity. For more information, see https://www.statcan.gc.ca/eng/subjects/standard/sgc/2016/introduction#a5.3.
[24] See FAO, “Economic and Budget Outlook,” Fall 2020.
[25] Government of Ontario, “Ontario Taking Further Action to Stop the Spread of COVID-19,” November 20, 2020.
[26] The FAO’s 2021 transit assumptions are based on forecast information for the City of London, Ontario; the City of London, UK; and New York City, US. See COVID-19 Financial Impacts, London Transit, London, Ontario; Finance Report and Revised Budget, Transport for London, London, UK; and McKinsey Analysis – Financial Impact Assessment on 2020 Revenue of COVID-19, Metropolitan Transportation Authority, New York City, US.
[27] Municipal Act, 2001, s. 279.
[28] Expense impacts exclude cost mitigation measures that were implemented by municipalities. See Cost Savings Measure section below for more information.
[29] Defined by Statistics Canada, Ontario’s economic regions are groupings of census divisions used to create a standard geographical unit for analyzing regional economic activity. For more information, see https://www.statcan.gc.ca/eng/subjects/standard/sgc/2016/introduction#a5.3.
[30] The municipalities in this group are the City of Mississauga, City of Ottawa, Peel Region and York Region.
[31] See Government of Ontario, “Historic Agreement Delivers up to $4 Billion to Support Municipalities and Transit,” July 27, 2020 and FAO, “Federal and Provincial COVID-19 Response Measures,” September 10, 2020.
[32] Letter from the Ministry of Municipal Affairs and Housing to municipalities. For an example, see https://www.thebluemountains.ca/document_viewer.cfm?event_doc=3717.
[33] See Toronto Transit Commission, “COVID-19: Restart and Recovery Update,” September 24, 2020.
[34] For the allocations by municipality for the municipal transit and general operating pressures streams see, “Municipal Funding under the Safe Restart Agreement.”
[35] Note that not all municipalities will require additional funding to support general operating pressures. For example, Chatham-Kent reports that it will not apply for additional operating funding support because it cannot identify sufficient pressures. https://sydenhamcurrent.ca/2020/10/21/c-k-not-applying-for-phase-2-of-the-safe-restart-agreement-fund/.
[36] Municipalities cannot plan for cash operating budget deficits but can plan to run budget deficits on an accrual accounting basis. See Appendix A for more information.
[37] See City of Toronto 2019 Budget Public Book, Operating Budget Policies, for more information.