


Labour market experiences strong but uneven recovery
Summary
This report provides an update on Ontario’s labour market performance in 2021. It presents a summary of the overall labour market in the province, followed by information for demographic groups, industries, major cities, immigrants and visible minorities. The report highlights some major challenges facing Ontario’s labour market and provides a brief update on the impact of the COVID-19 Omicron variant on the labour market in January 2022.
Total employment in Ontario rebounded strongly in 2021 as pandemic-related restrictions were eased
- Following the sharp job loss caused by the COVID-19 pandemic shutdowns, Ontario employment rebounded strongly in 2021, with jobs increasing by 344,800 (a 4.9 per cent rise compared to 2020). This marked the largest annual job gain on record and raised employment essentially to the 2019 pre-pandemic level.
- The province's annual unemployment rate declined to 8.0 per cent in 2021, down from 9.6 per cent in 2020. Despite this progress, the unemployment rate in 2021 was well above the pre-pandemic rate, as a larger number of job seekers entered the labour market looking for work.
Employment recovery was uneven, with some groups remaining far below pre-pandemic levels
- Strong job gains were observed among all age groups. Despite recording the fastest job growth in 2021, youth (15-24 years) employment was 6.9 per cent below the 2019 pre-pandemic level.
- Female workers saw larger job gains in 2021 compared to males. However, overall female employment in the province remained slightly below the pre-pandemic level, reflecting weak job recovery among young females.
- Almost all major industry groups recorded higher employment in 2021. Faced with ongoing restrictions, employment in low-wage industries with close customer contact, including accommodation and food services, wholesale and retail trade, and transportation and warehousing, remained below pre-pandemic levels.
- Employment increased noticeably across most major Ontario cities. However, employment in 2021 remained below pre-pandemic levels for 11 of the 16 major cities, with Greater Sudbury (5.6 per cent lower than 2019) the farthest from recovery.
Lingering effects of the pandemic continue to pose challenges to many workers
- Despite the strong overall job recovery, there are challenges related to long-term labour market trends and the lingering impacts of the pandemic. Some workers have struggled with unemployment for long periods of time, others are affected by a shift in skill requirements to softer and more advanced technical abilities, and hiring difficulties persist despite record job vacancies, notably in accommodation and food services. ;
Omicron variant caused temporary setback in the province’s labour market in early 2022
- With select COVID-19-restrictions re-enacted in January 2022, employment dropped by 145,700 while the unemployment rate rose more than a full percentage point to 7.3 per cent. However, employment is expected to rebound as the economy reopened in February.[1]
Figure 1 Employment among some groups remained below the pre-pandemic level
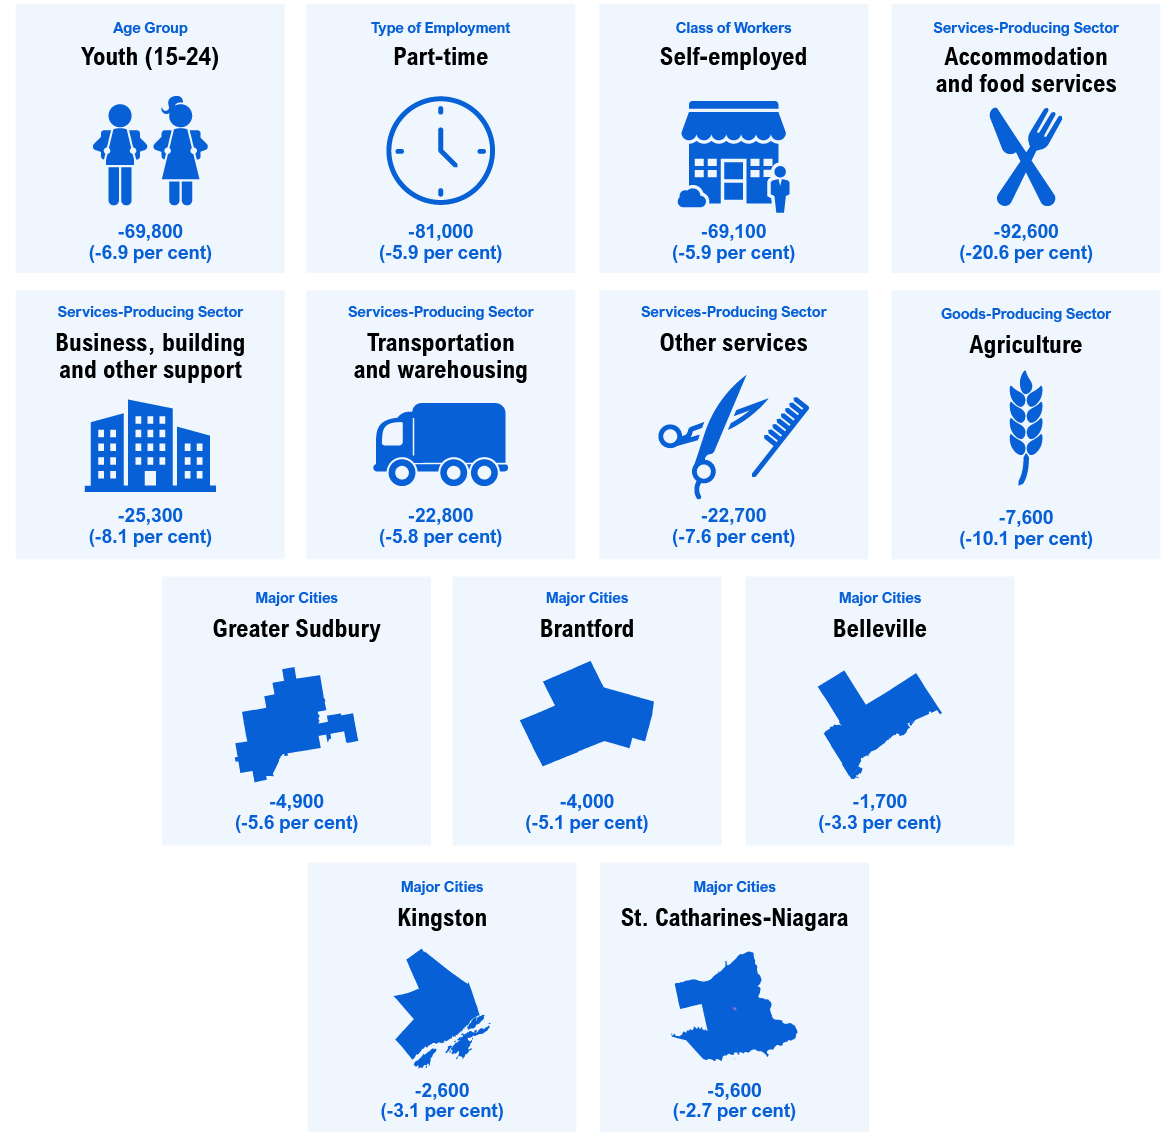
Note: The numbers represent the employment change from 2019 to 2021. The figure highlights several groups that experienced the slowest recovery in employment. However, it does not include all groups where employment remains below pre-pandemic 2019 levels.
Source: Statistics Canada and FAO.
Accessible version
| Change in Employment from 2019 to 2021 (Thousands) | Change in Employment from 2019 to 2021 (Per Cent) | |
|---|---|---|
| Youth (15-24) | -69.8 | -6.9 |
| Part-time | -81.0 | -5.9 |
| Self-employed | -69.1 | -5.9 |
| Accommodation and food services | -92.6 | -20.6 |
| Business, building and other support | -25.3 | -8.1 |
| Transportation and warehousing | -22.8 | -5.8 |
| Other services | -22.7 | -7.6 |
| Agriculture | -7.6 | -10.1 |
| Greater Sudbury | -4.9 | -5.6 |
| Brantford | -4.0 | -5.1 |
| Belleville | -1.7 | -3.3 |
| Kingston | -2.6 | -3.1 |
| St. Catharines-Niagara | -5.6 | -2.7 |
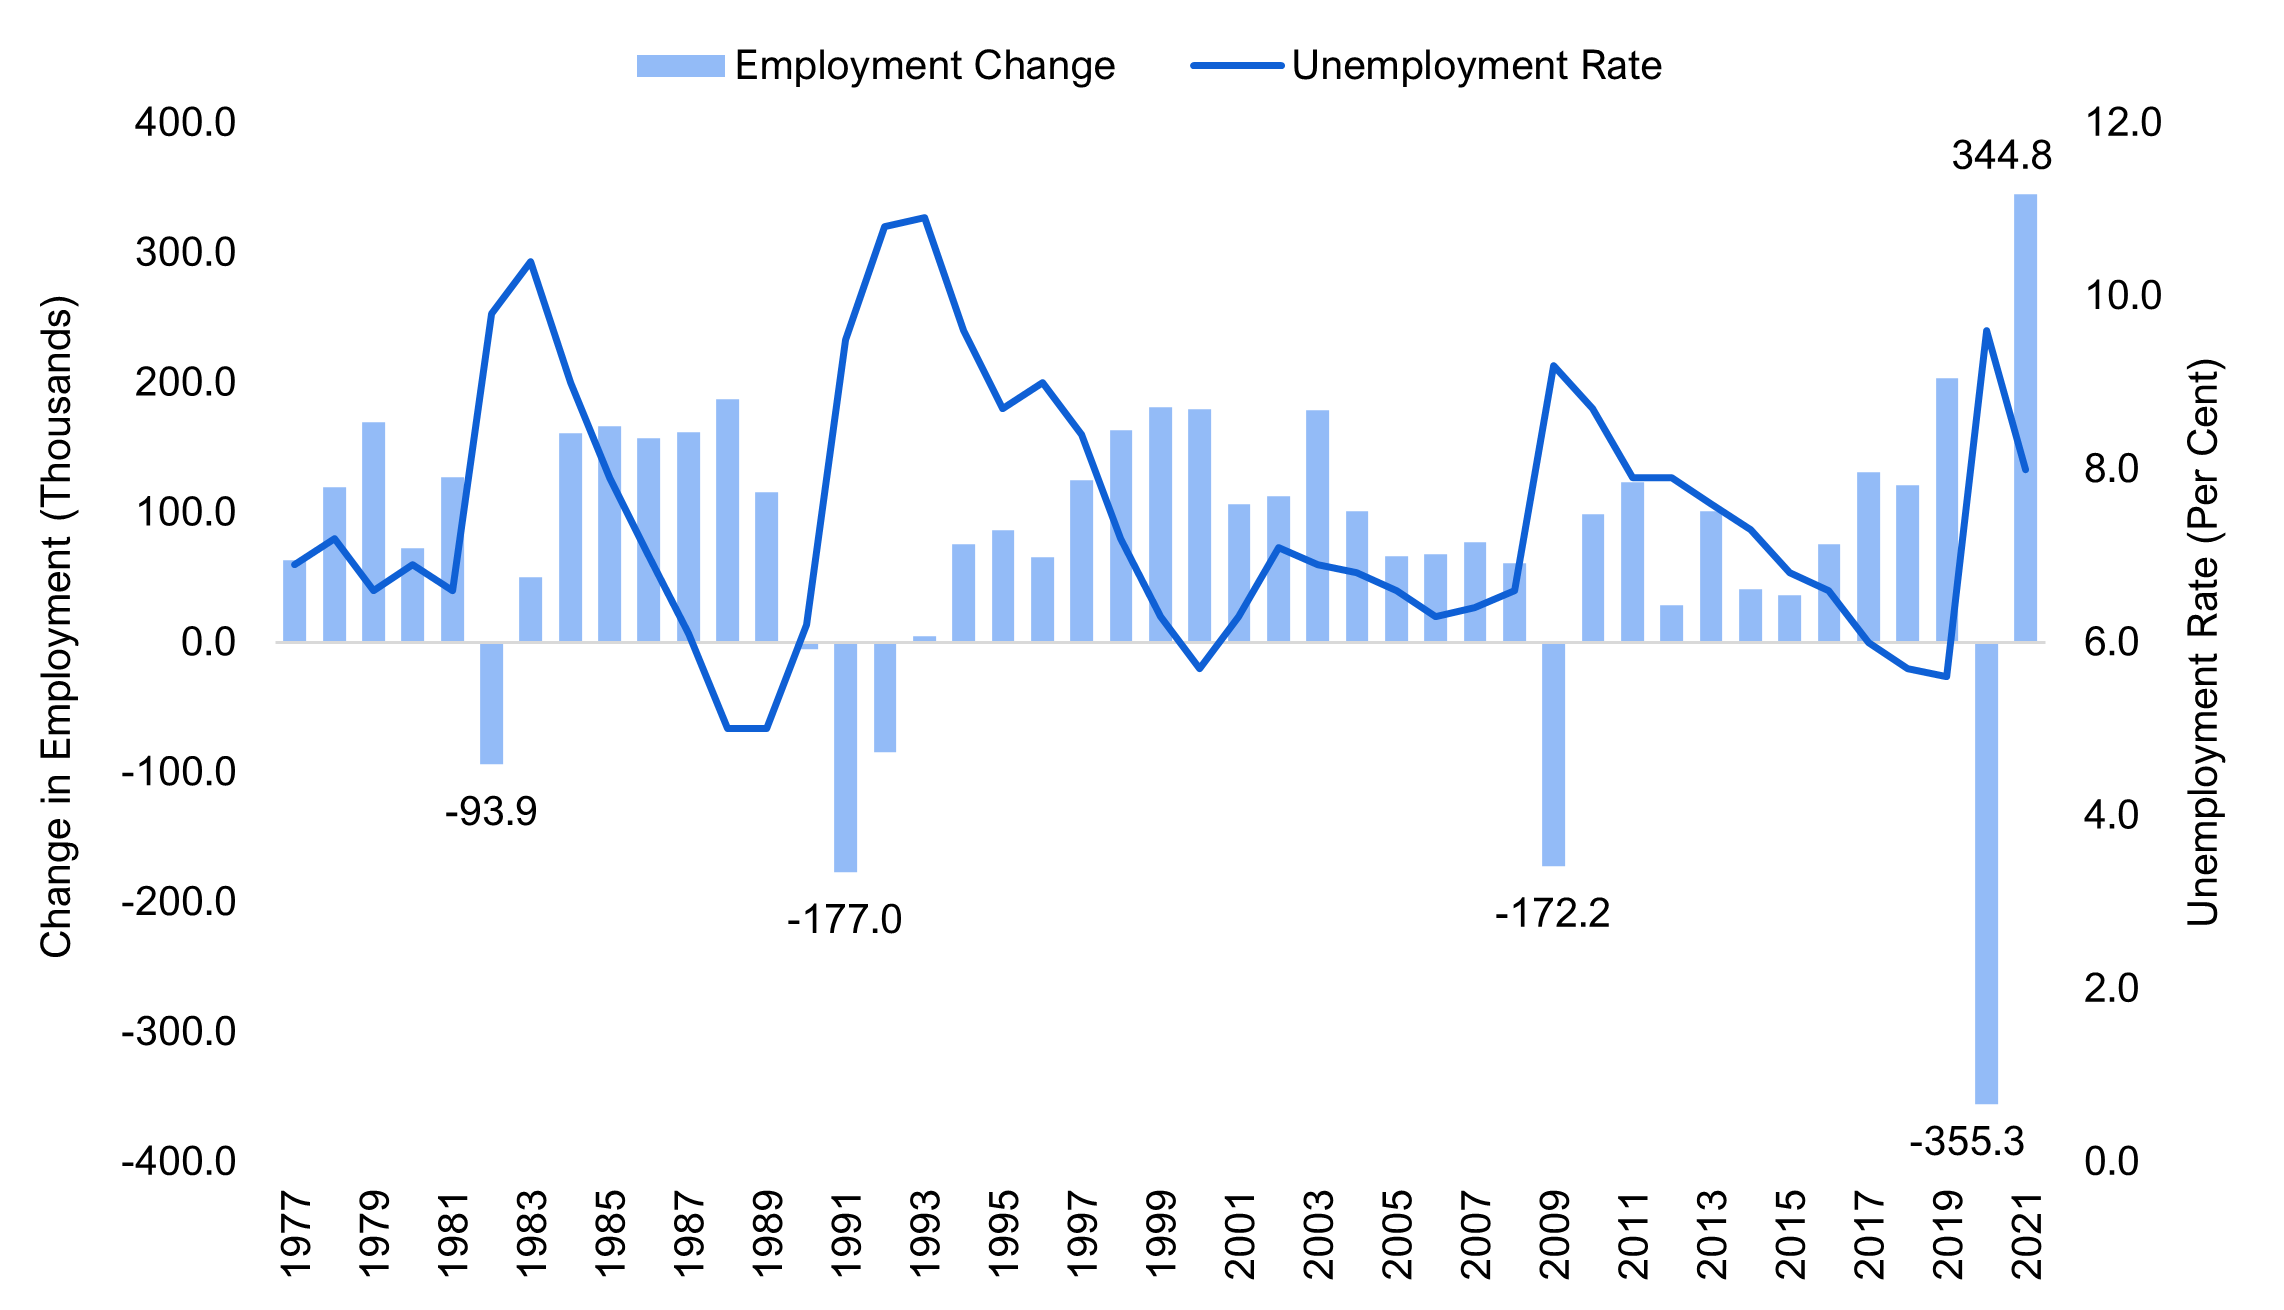
Jobs rebounded strongly in 2021 as the economy gradually reopened
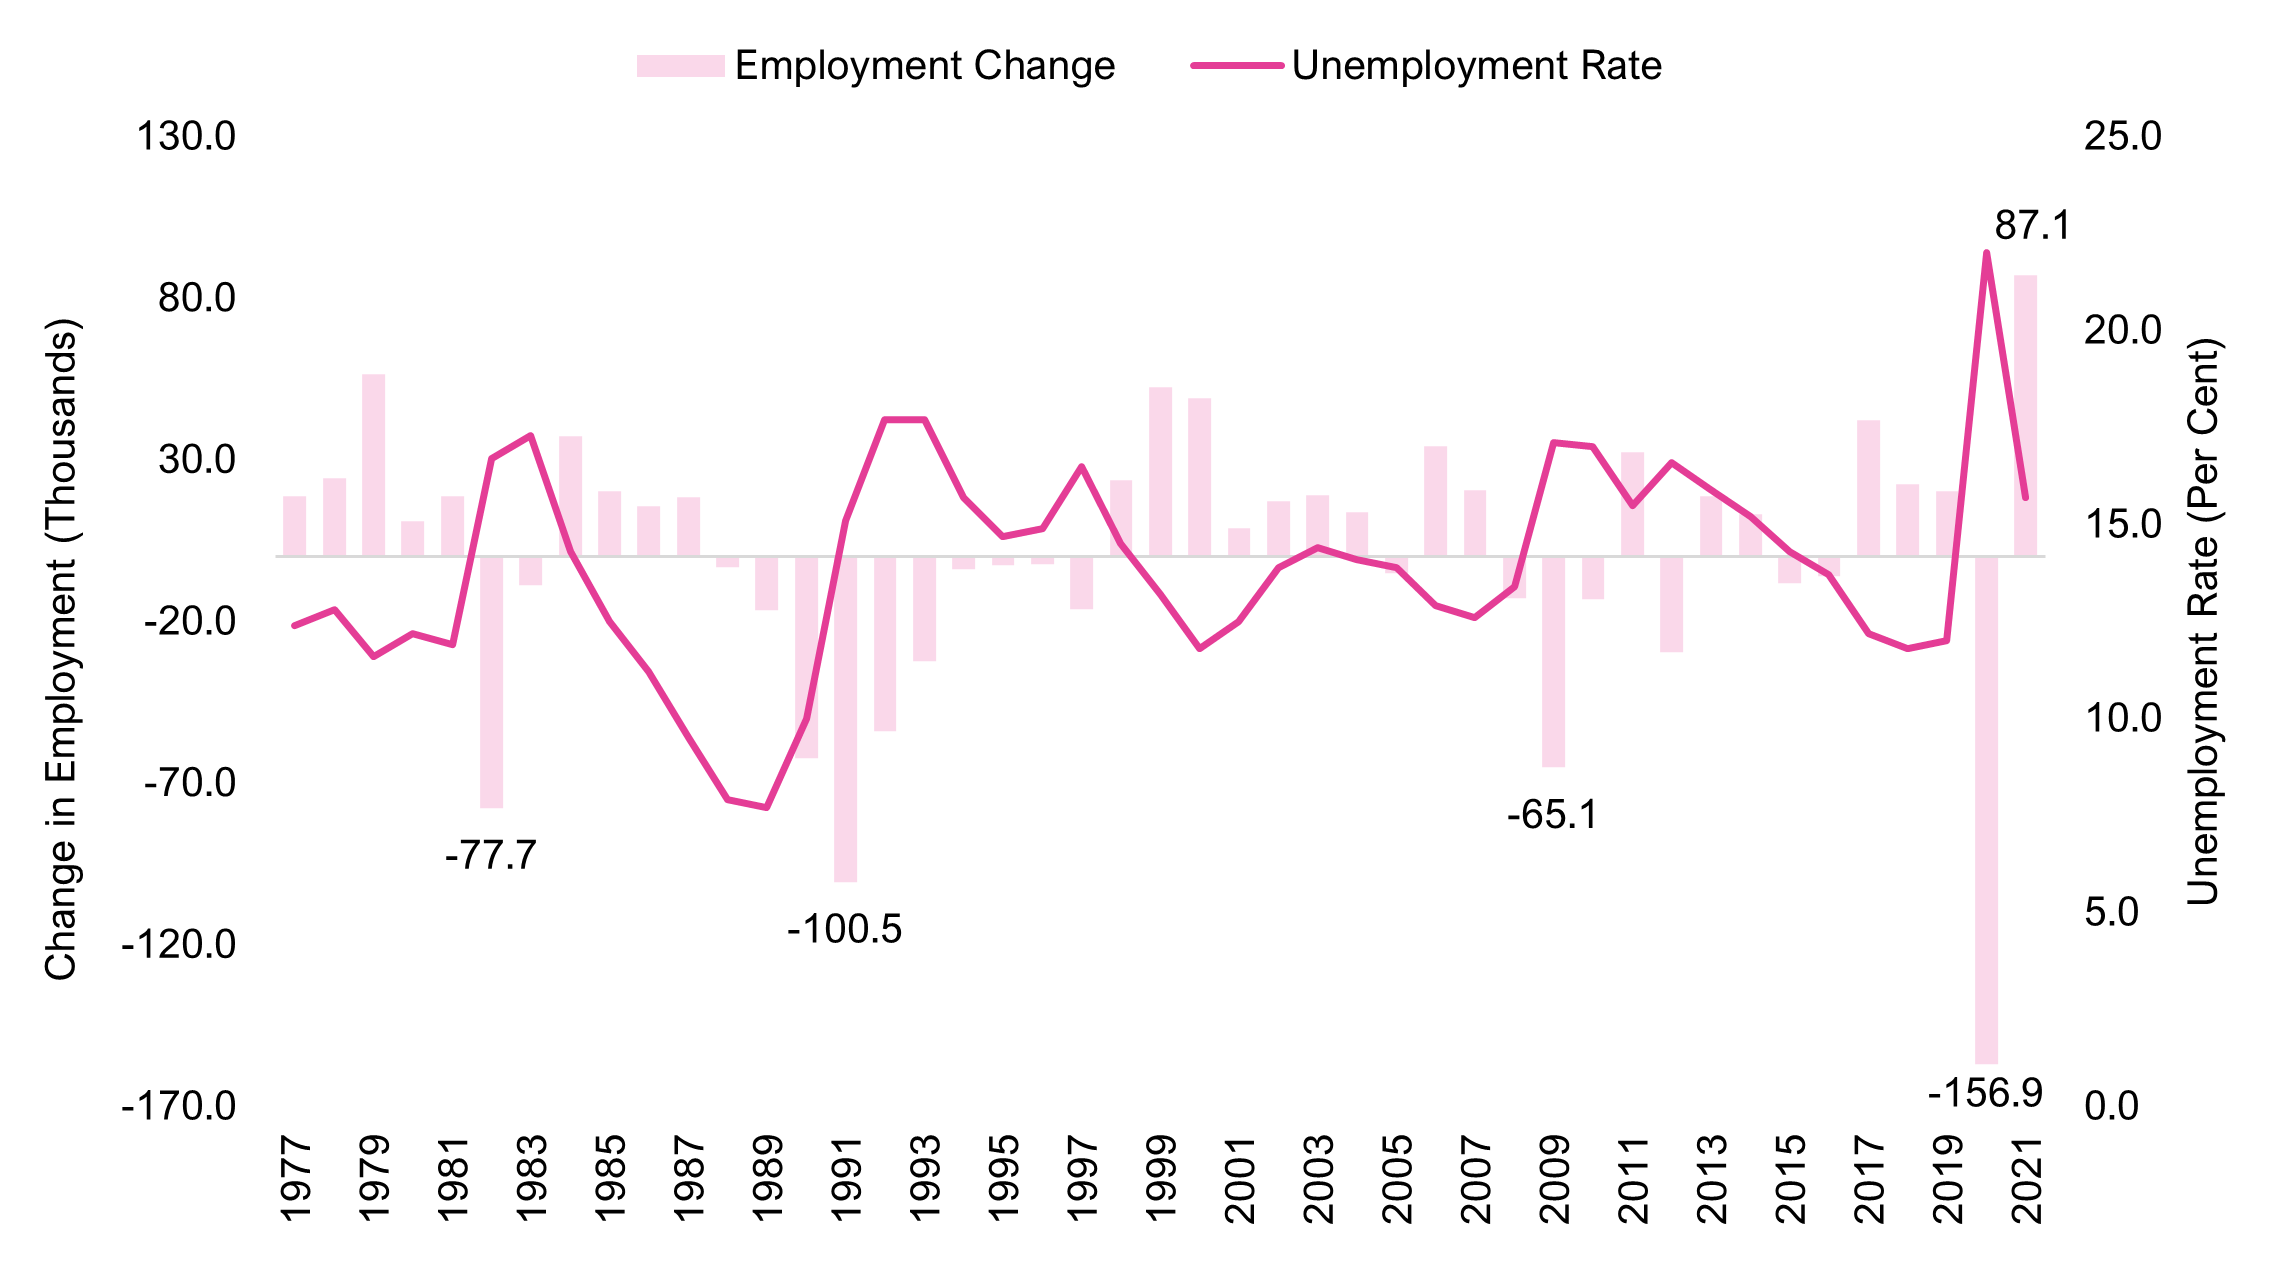
Ontario’s labour market rebounded strongly in 2021, following the record job loss in 2020. According to Statistics Canada’s Labour Force Survey, the province gained 344,800 jobs in 2021 (a 4.9 per cent increase), the largest annual increase in employment on record.[2] The record job gains brought employment essentially back to the pre-pandemic 2019 level (0.1 per cent below).
As pandemic-related restrictions were eased in 2021, more people entered the job market looking for work, raising the province’s labour force participation rate to 64.9 per cent, matching its pre-pandemic rate. The annual unemployment rate declined to 8.0 per cent in 2021, down from 9.6 per cent in 2020. Despite the improvement, the unemployment rate remained above the pre-pandemic rate of 5.6 per cent in 2019.
Figure 2 Ontario saw strongest job gains on record in 2021
Source: Statistics Canada and FAO.
Accessible version
| Year | Employment Change (Thousands) | Unemployment Rate (Per Cent) |
|---|---|---|
| 1977 | 63.2 | 6.9 |
| 1978 | 119.7 | 7.2 |
| 1979 | 169.2 | 6.6 |
| 1980 | 72.3 | 6.9 |
| 1981 | 127.4 | 6.6 |
| 1982 | -93.9 | 9.8 |
| 1983 | 50.4 | 10.4 |
| 1984 | 161.2 | 9.0 |
| 1985 | 166.4 | 7.9 |
| 1986 | 157.3 | 7.0 |
| 1987 | 161.7 | 6.1 |
| 1988 | 187.5 | 5.0 |
| 1989 | 115.9 | 5.0 |
| 1990 | -4.9 | 6.2 |
| 1991 | -177.0 | 9.5 |
| 1992 | -84.2 | 10.8 |
| 1993 | 5.1 | 10.9 |
| 1994 | 75.6 | 9.6 |
| 1995 | 86.4 | 8.7 |
| 1996 | 65.9 | 9.0 |
| 1997 | 124.8 | 8.4 |
| 1998 | 163.2 | 7.2 |
| 1999 | 181.4 | 6.3 |
| 2000 | 179.6 | 5.7 |
| 2001 | 106.4 | 6.3 |
| 2002 | 112.9 | 7.1 |
| 2003 | 178.7 | 6.9 |
| 2004 | 101.4 | 6.8 |
| 2005 | 66.7 | 6.6 |
| 2006 | 68.0 | 6.3 |
| 2007 | 77.5 | 6.4 |
| 2008 | 61.2 | 6.6 |
| 2009 | -172.2 | 9.2 |
| 2010 | 99.1 | 8.7 |
| 2011 | 123.6 | 7.9 |
| 2012 | 28.5 | 7.9 |
| 2013 | 101.4 | 7.6 |
| 2014 | 41.0 | 7.3 |
| 2015 | 36.3 | 6.8 |
| 2016 | 76.0 | 6.6 |
| 2017 | 131.1 | 6.0 |
| 2018 | 120.8 | 5.7 |
| 2019 | 203.6 | 5.6 |
| 2020 | -355.3 | 9.6 |
| 2021 | 344.8 | 8.0 |
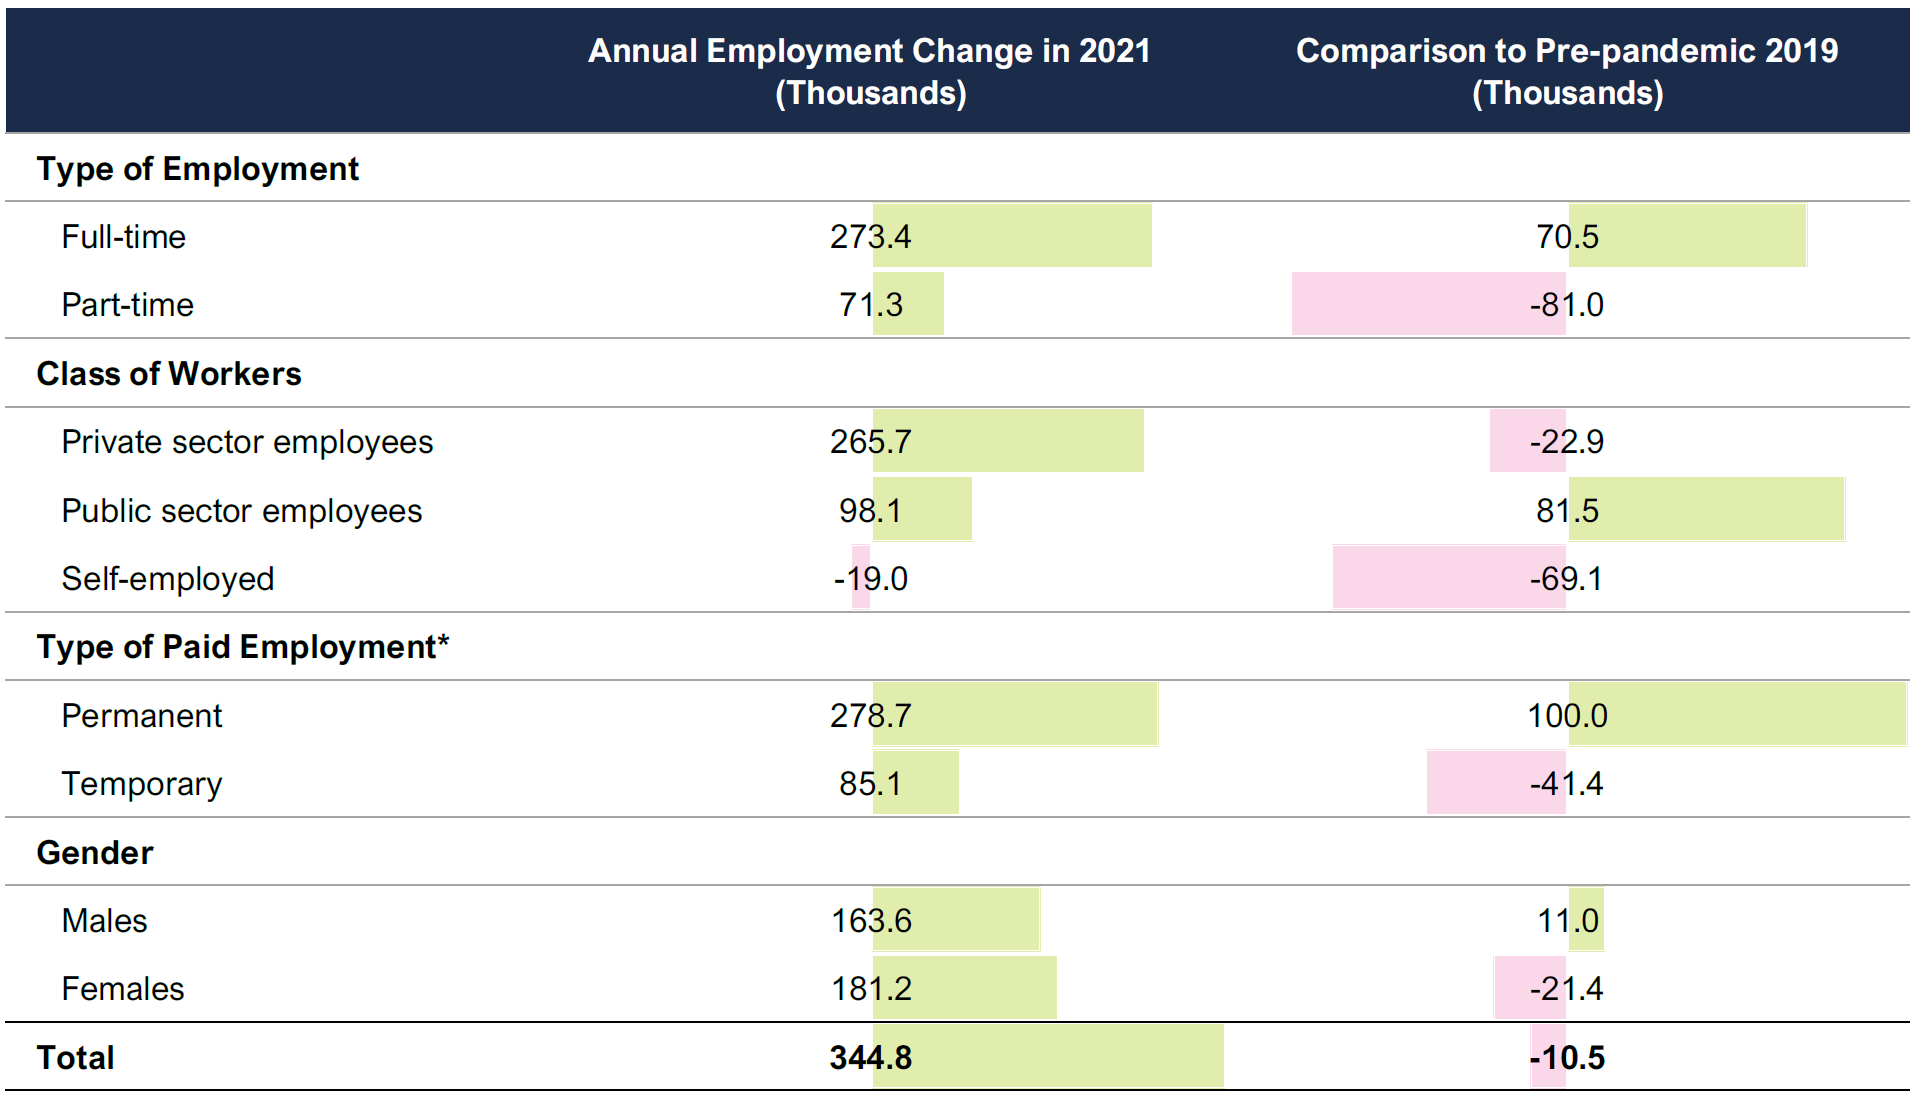
On an average annual basis, job gains occurred in both the public (98,100 or 7.2 per cent) and private sectors (265,700 or 5.8 per cent). In the public sector, employment gains were recorded in educational services, and health care and social assistance, while private-sector job growth was widespread across various sectors including professional, scientific and technical services; wholesale and retail trade; and manufacturing.
Just over three-quarters of these paid job gains in 2021 were in permanent positions. In contrast to paid employment, self-employment continued to decline, dropping 1.7 per cent (-19,000) in 2021, following a 4.3 per cent loss in the previous year. The decline in self-employment was concentrated in business, building and other support services.
Part-time employment grew at a faster pace (5.8 per cent or 71,300) in 2021 compared to full-time employment (4.7 per cent or 273,400). Despite the growth, part-time employment remained 5.9 per cent below the 2019 pre-pandemic level.
As a number of sectors that employ a high share of women reopened throughout 2021, Ontario’s total female employment increased by 181,200 (5.5 per cent), larger than the 163,600 (4.4 per cent) job gains by male workers. However, total female employment in 2021 remained slightly below the pre-pandemic level due to weak job recovery among young females,[3] while total male employment was slightly above the 2019 level.
Figure 3 Employment for many workers did not recover to pre-pandemic level
*Paid employment does not include self-employment.
Note: Numbers may not add due to rounding.
Source: Statistics Canada and FAO.
Accessible version
| Annual Employment Change in 2021 (Thousands) |
Comparison to Pre-pandemic 2019 (Thousands) |
|
|---|---|---|
| Type of Employment | ||
| Full-time | 273.4 | 70.5 |
| Part-time | 71.3 | -81.0 |
| Class of Workers | ||
| Private sector employees | 265.7 | -22.9 |
| Public sector employees | 98.1 | 81.5 |
| Self-employed | -19.0 | -69.1 |
| Type of Paid Employment* | ||
| Permanent | 278.7 | 100.0 |
| Temporary | 85.1 | -41.4 |
| Gender | ||
| Male | 163.6 | 11.0 |
| Female | 181.2 | -21.4 |
| Total | 344.8 | -10.5 |
Labour market outcome by demographic groups
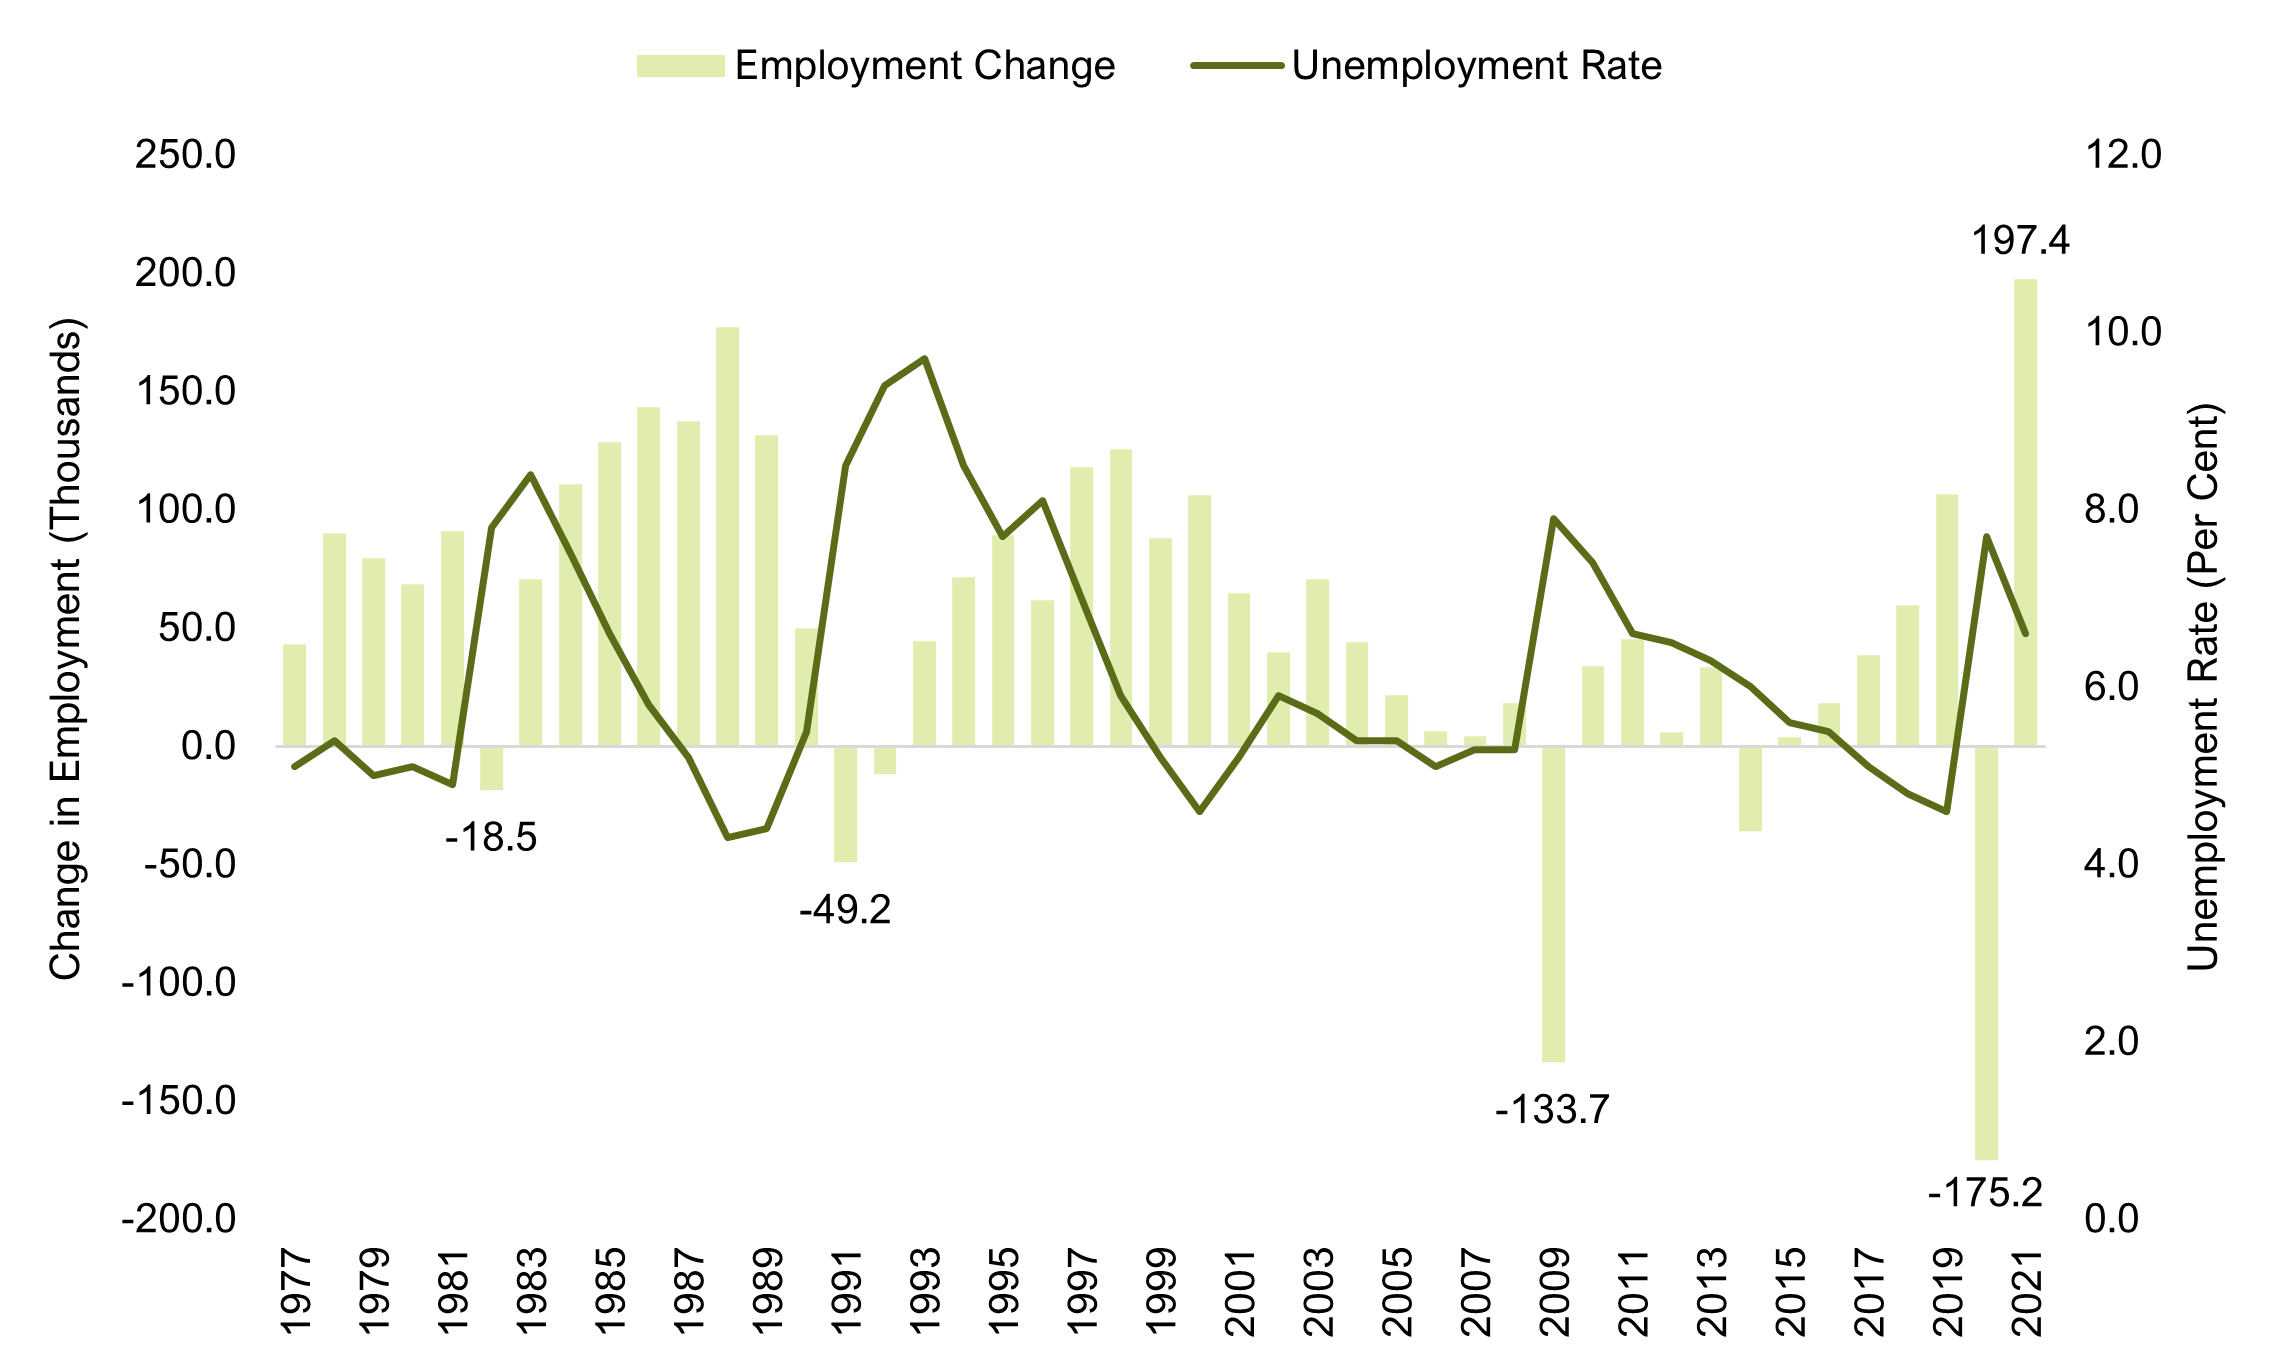
Healthy gains in 2021 lifted core‑age employment slightly above the pre-pandemic level
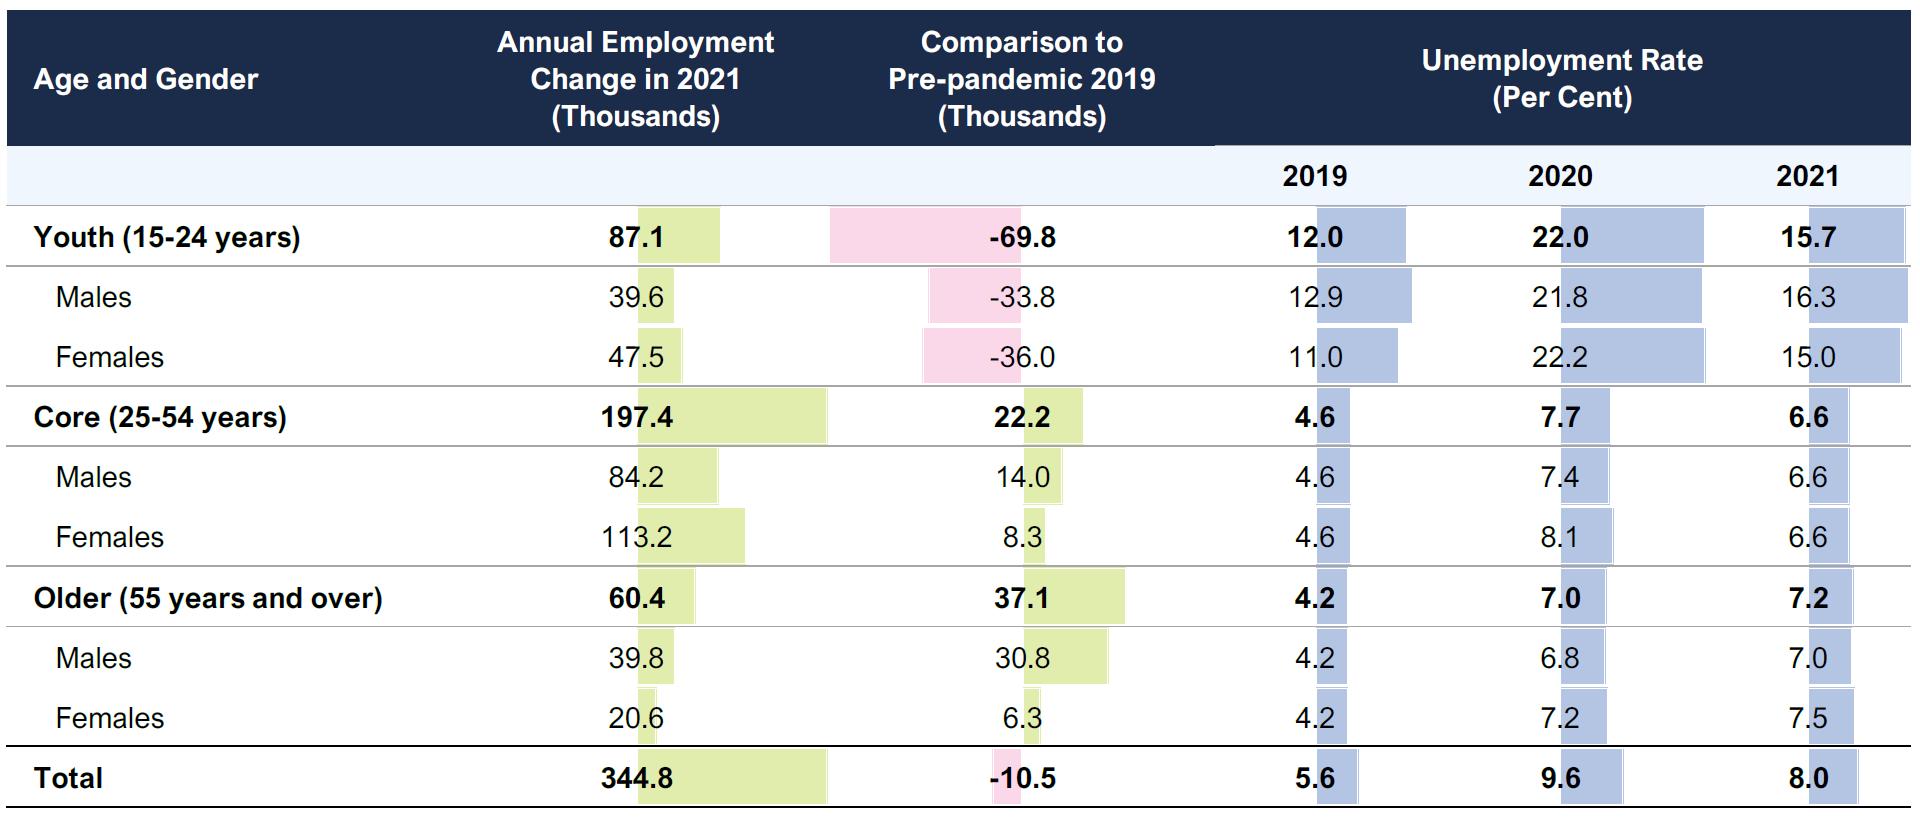
Jobs for core‑age workers (25‑54 years) increased by 197,400 (or 4.3 per cent) in 2021, bringing employment slighly above the 2019 pre-pandemic level. Core-age female workers saw larger job gains (113,200 or 5.2 per cent) compared to their male counterparts (84,200 or 3.5 per cent), with employment in both groups recovering above pre-pandemic levels. The unemployment rate among core‑age workers declined from 7.7 per cent in 2020 to 6.6 per cent in 2021, with female workers experiencing a sharper drop compared to males. The labour force participation rate among Ontario’s core-age workers rebounded to 86.9 per cent in 2021, the highest since 2005. The increase brought the participation rate among core-age female workers to 82.8 per cent, the highest on record.
Figure 4 Strong recovery in Ontario’s core-age employment in 2021
Source: Statistics Canada and FAO.
Accessible version
| Year | Employment Change (Thousands) | Unemployment Rate (Per Cent) |
|---|---|---|
| 1977 | 43.0 | 5.1 |
| 1978 | 90.3 | 5.4 |
| 1979 | 79.5 | 5.0 |
| 1980 | 68.6 | 5.1 |
| 1981 | 91.0 | 4.9 |
| 1982 | -18.5 | 7.8 |
| 1983 | 70.6 | 8.4 |
| 1984 | 110.7 | 7.5 |
| 1985 | 128.6 | 6.6 |
| 1986 | 143.2 | 5.8 |
| 1987 | 137.6 | 5.2 |
| 1988 | 177.4 | 4.3 |
| 1989 | 131.4 | 4.4 |
| 1990 | 50.1 | 5.5 |
| 1991 | -49.2 | 8.5 |
| 1992 | -11.7 | 9.4 |
| 1993 | 44.5 | 9.7 |
| 1994 | 71.5 | 8.5 |
| 1995 | 89.1 | 7.7 |
| 1996 | 61.7 | 8.1 |
| 1997 | 117.9 | 7.0 |
| 1998 | 125.5 | 5.9 |
| 1999 | 87.8 | 5.2 |
| 2000 | 106.0 | 4.6 |
| 2001 | 64.7 | 5.2 |
| 2002 | 39.9 | 5.9 |
| 2003 | 70.5 | 5.7 |
| 2004 | 44.1 | 5.4 |
| 2005 | 21.7 | 5.4 |
| 2006 | 6.4 | 5.1 |
| 2007 | 4.3 | 5.3 |
| 2008 | 18.3 | 5.3 |
| 2009 | -133.7 | 7.9 |
| 2010 | 33.9 | 7.4 |
| 2011 | 45.1 | 6.6 |
| 2012 | 5.8 | 6.5 |
| 2013 | 33.4 | 6.3 |
| 2014 | -35.9 | 6.0 |
| 2015 | 3.7 | 5.6 |
| 2016 | 18.4 | 5.5 |
| 2017 | 38.3 | 5.1 |
| 2018 | 59.7 | 4.8 |
| 2019 | 106.4 | 4.6 |
| 2020 | -175.2 | 7.7 |
| 2021 | 197.4 | 6.6 |
The vast majority (85.7 per cent) of employment gains for core-age workers were in full-time jobs (169,200 or 4.1 per cent), while the rest were in part-time positions (28,000 or 5.7 per cent). Nearly 60 per cent of the annual increase in core-age employment took place in educational services; professional, scientific and technical services; and wholesale and retail trade sectors.
Youth employment rises strongly but remains below pre-pandemic level
The pandemic‑related shutdowns had a pronounced impact on the province’s young workers (15‑24 years), who tend to have less labour market experience and be employed in less stable jobs. Despite record job gains (87,100 or 10.2 per cent) in 2021, youth employment in Ontario remained 6.9 per cent below 2019 levels. After reaching a historic peak of 22 per cent in 2020, the youth unemployment rate declined to a still-elevated 15.7 per cent in 2021. Although the labour force participation rate among young Ontarians recovered slightly in 2021 (+1.5 percentage points to 60.3 per cent), it was the second lowest on record.
Figure 5 Young Ontarians recovered just over half the jobs lost in 2020
Source: Statistics Canada and FAO.
Accessible version
| Year | Employment Change (Thousands) | Unemployment Rate (Per Cent) |
| 1977 | 18.9 | 12.4 |
| 1978 | 24.5 | 12.8 |
| 1979 | 56.4 | 11.6 |
| 1980 | 11.0 | 12.2 |
| 1981 | 18.8 | 11.9 |
| 1982 | -77.7 | 16.7 |
| 1983 | -8.6 | 17.3 |
| 1984 | 37.2 | 14.3 |
| 1985 | 20.3 | 12.5 |
| 1986 | 15.6 | 11.2 |
| 1987 | 18.5 | 9.5 |
| 1988 | -3.2 | 7.9 |
| 1989 | -16.6 | 7.7 |
| 1990 | -62.3 | 10.0 |
| 1991 | -100.5 | 15.1 |
| 1992 | -54.0 | 17.7 |
| 1993 | -32.3 | 17.7 |
| 1994 | -3.8 | 15.7 |
| 1995 | -2.7 | 14.7 |
| 1996 | -2.2 | 14.9 |
| 1997 | -16.1 | 16.5 |
| 1998 | 23.7 | 14.5 |
| 1999 | 52.4 | 13.2 |
| 2000 | 49.0 | 11.8 |
| 2001 | 8.9 | 12.5 |
| 2002 | 17.1 | 13.9 |
| 2003 | 19.1 | 14.4 |
| 2004 | 13.8 | 14.1 |
| 2005 | -5.1 | 13.9 |
| 2006 | 34.2 | 12.9 |
| 2007 | 20.6 | 12.6 |
| 2008 | -12.9 | 13.4 |
| 2009 | -65.1 | 17.1 |
| 2010 | -13.0 | 17.0 |
| 2011 | 32.4 | 15.5 |
| 2012 | -29.5 | 16.6 |
| 2013 | 18.9 | 15.9 |
| 2014 | 13.2 | 15.2 |
| 2015 | -8.2 | 14.3 |
| 2016 | -5.9 | 13.7 |
| 2017 | 42.4 | 12.2 |
| 2018 | 22.4 | 11.8 |
| 2019 | 20.4 | 12.0 |
| 2020 | -156.9 | 22.0 |
| 2021 | 87.1 | 15.7 |
Youth part-time employment grew at nearly twice the pace (13.8 per cent or 55,000) compared to full-time employment (7.0 per cent or 32,000) in 2021. Total employment among young females increased at a faster pace (11.5 per cent) compared to their male counterparts (8.9 per cent). Despite the stronger pace of job growth, employment among young female workers remained farther below 2019 levels (-7.3 per cent) compared to young male workers (-6.5 per cent).
By sector, the majority of the annual job gains for young Ontarians were driven by health care and social assistance, wholesale and retail trade, and accommodation and food services industries. Youth employment remained the farthest from pre-pandemic levels in the information, culture and recreation industry (-36.6 per cent).
Older worker unemployment rate reached highest in nearly three decades
Employment among Ontarians aged 55 years and over increased by 60,400 (or 3.8 per cent) in 2021, recovering above the 2019 pre-pandemic level. A strong increase in the number of entrants to the job market helped lift the labour force participation rate of older Ontarians to 38.5 per cent in 2021, the highest on record. With the increase in labour force entrants outpacing job gains, the unemployment rate among this group rose for the second consecutive year to 7.2 per cent, the highest in nearly three decades.
About two-thirds of the annual job gains for older workers took place in professional, scientific and technical services, and manufacturing. Part-time employment among older workers continued to decline (-11,800 or -3.5 per cent) in 2021, partly offsetting gains in full-time jobs (72,200 or 5.8 per cent). Unlike other age groups, older females saw a slower pace of employment gains (2.9 per cent) compared to their male counterparts (4.6 per cent) in 2021.
Figure 6 Summary of labour market outcomes for demographic groups
Note: Numbers may not add due to rounding.
Source: Statistics Canada and FAO.
Accessible version
| Age and Gender (Thousands) |
Annual Employment Change in 2021 (Thousands) |
Comparison to Pre-pandemic 2019 (Thousands) |
Unemployment Rate (Per Cent) |
||
|---|---|---|---|---|---|
| 2019 | 2020 | 2021 | |||
| Youth (15-24 years) | 87.1 | -69.8 | 12.0 | 22.0 | 15.7 |
| Male | 39.6 | -33.8 | 12.9 | 21.8 | 16.3 |
| Female | 47.5 | -36.0 | 11.0 | 22.2 | 15.0 |
| Core (25-54 years) | 197.4 | 22.2 | 4.6 | 7.7 | 6.6 |
| Male | 84.2 | 14.0 | 4.6 | 7.4 | 6.6 |
| Female | 113.2 | 8.3 | 4.6 | 8.1 | 6.6 |
| Older (55 years and over) | 60.4 | 37.1 | 4.2 | 7.0 | 7.2 |
| Male | 39.8 | 30.8 | 4.2 | 6.8 | 7.0 |
| Female | 20.6 | 6.3 | 4.2 | 7.2 | 7.5 |
| Total | 344.8 | -10.5 | 5.6 | 9.6 | 8.0 |
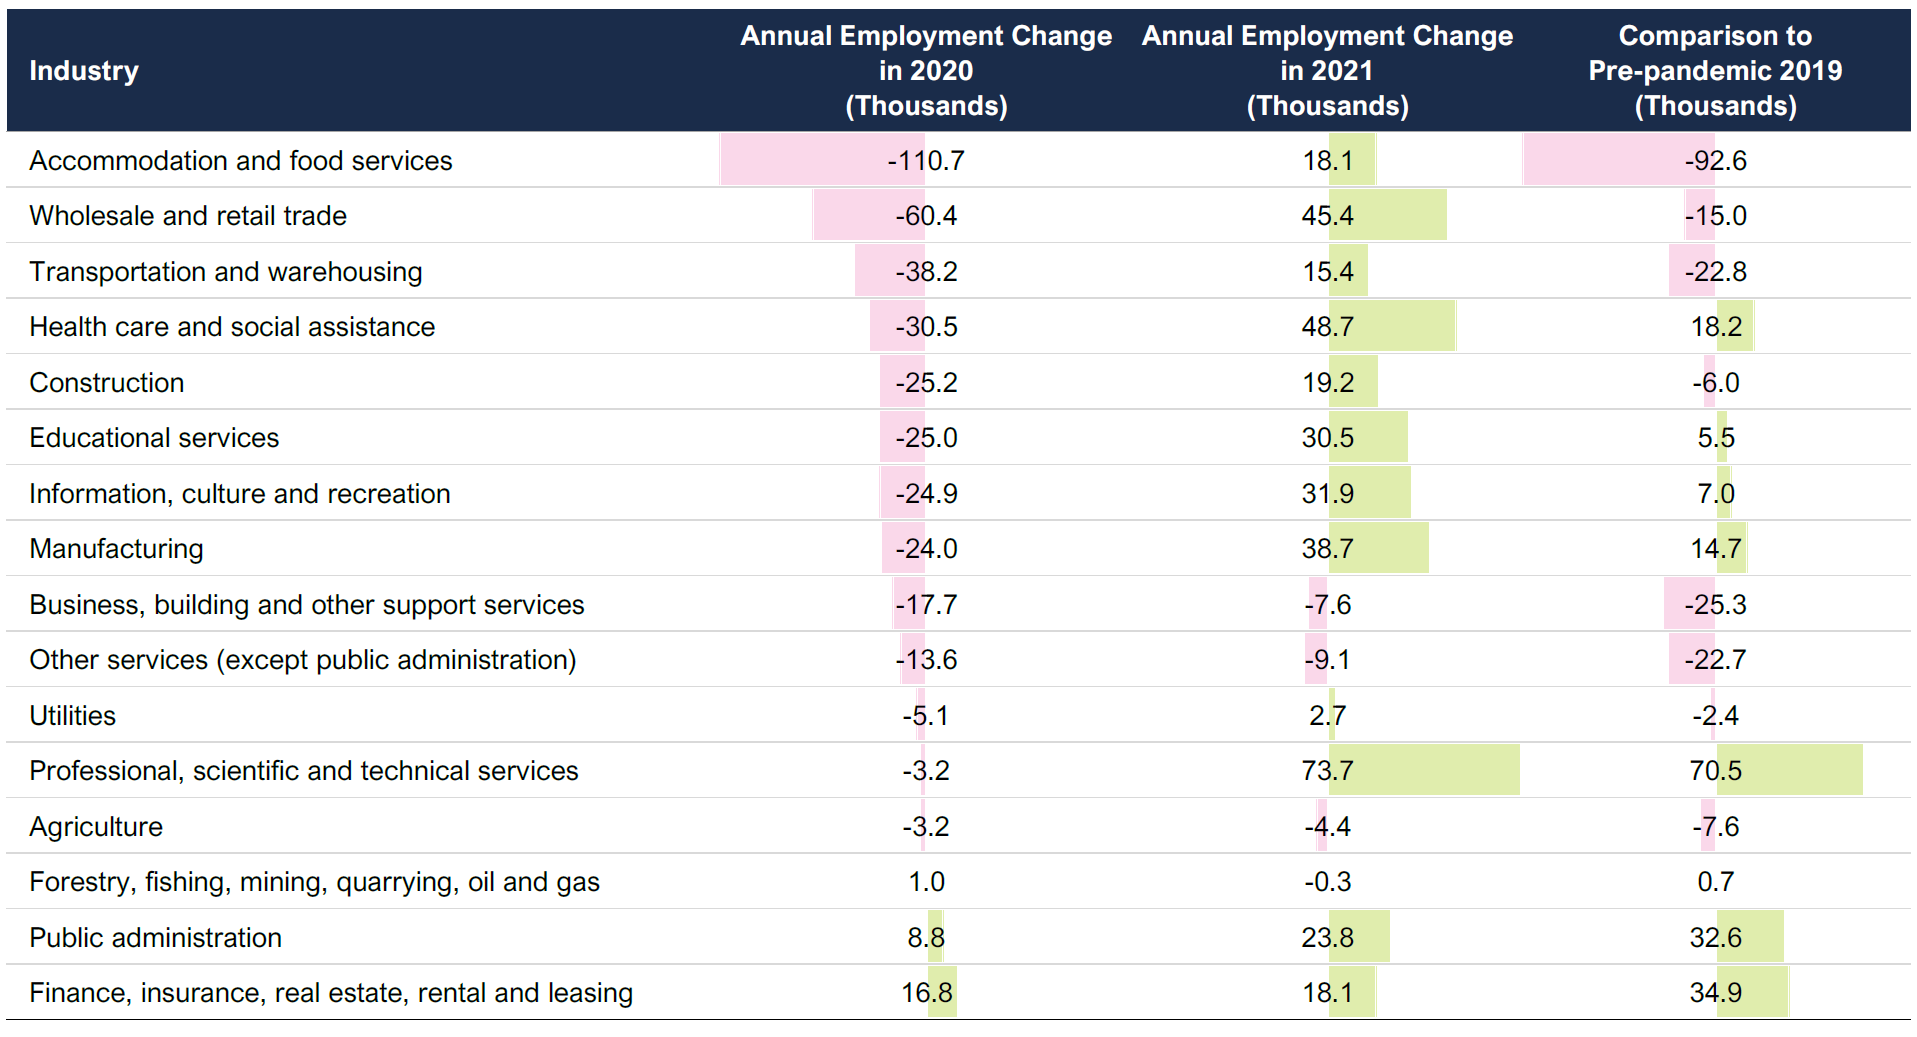
Ontario’s industries saw uneven recovery from pandemic job losses
While a majority of industries in Ontario saw job gains in 2021, the pace of recovery has been uneven and employment in some of the hardest-hit sectors remained below 2019 levels.
Figure 7 Most industries saw jobs rebound in 2021, but employment in many remained below pre-pandemic levels
Source: Statistics Canada and FAO.
Accessible version
| Industry | Annual Employment Change in 2020 (Thousands) |
Annual Employment Change in 2021 (Thousands) |
Comparison to Pre-pandemic 2019 (Thousands) |
|---|---|---|---|
| Accommodation and food services | -110.7 | 18.1 | -92.6 |
| Wholesale and retail trade | -60.4 | 45.4 | -15.0 |
| Transportation and warehousing | -38.2 | 15.4 | -22.8 |
| Health care and social assistance | -30.5 | 48.7 | 18.2 |
| Construction | -25.2 | 19.2 | -6.0 |
| Educational services | -25.0 | 30.5 | 5.5 |
| Information, culture and recreation | -24.9 | 31.9 | 7.0 |
| Manufacturing | -24.0 | 38.7 | 14.7 |
| Business, building and other support services | -17.7 | -7.6 | -25.3 |
| Other services (except public administration) | -13.6 | -9.1 | -22.7 |
| Utilities | -5.1 | 2.7 | -2.4 |
| Professional, scientific and technical services | -3.2 | 73.7 | 70.5 |
| Agriculture | -3.2 | -4.4 | -7.6 |
| Forestry, fishing, mining, quarrying, oil and gas | 1.0 | -0.3 | 0.7 |
| Public administration | 8.8 | 23.8 | 32.6 |
| Finance, insurance, real estate, rental and leasing | 16.8 | 18.1 | 34.9 |
Jobs in the services-producing sector grew by 289,000 (5.2 per cent) in 2021, with the annual employment level remaining just 0.2 per cent below 2019 levels. About two-fifths of the increase in service-sector employment was driven by industries where jobs can be performed remotely such as professional, scientific and technical services (73,700 or 11.1 per cent), public administration (23,800 or 6.2 per cent) and finance, insurance, real estate, rental and leasing (18,100 or 3.0 per cent). These industries saw little to no job loss in the pandemic, and employment in these sectors is well above 2019 levels.
In contrast, employment did not recover to pre-pandemic levels in low-wage industries with close customer contact. Employment in 2021 increased for accommodation and food services (18,100 or 5.4 per cent), wholesale and retail trade (45,400 or 4.4 per cent) and transportation and warehousing (15,400 or 4.3 per cent) – the three hardest-hit industries in 2020. Even with these gains, employment remained below 2019 levels for these industries. Notably, employment in the accommodation and food services industry was the farthest from pre-pandemic levels (92,600 or 20.6 per cent below 2019 level). All job gains in the industry in 2021 were in part-time positions, while full-time employment continued to decline. Employment was below the pre-pandemic level to a smaller extent in wholesale and retail trade (1.4 per cent below 2019 level) and transportation and warehousing (5.8 per cent below 2019 level), reflecting in part a more optimistic business outlook in the sectors.[4]
Employment in 2021 increased in other industries that were highly affected by the pandemic, including health care and social assistance (48,700 or 5.6 per cent), educational services (30,500 or 5.9 per cent) and information, culture and recreation (31,900 or 11.7 per cent). These industries also saw employment rise above 2019 levels. Job gains in health care and social assistance were driven by a surge in employment related to strong demand for many assisting occupations.[5] The gain in educational services likely reflects the reopening of in-person teaching, while the resumed operation of sporting events and recreational facilities bolstered the recovery in the information, culture and recreation industry.[6]
Business, building and other support services (-7,600 or -2.6 per cent) posted a decline in employment in 2021, the third consecutive year of job loss, while the “other services”[7] sector (-9,100 or -3.2 per cent) recorded lower employment for the second straight year. The continuous decline in the business, building and other support services sector has been affected by ongoing teleworking of employees.
Ontario’s goods-producing sector saw employment grow by 55,900 (4.0 per cent) in 2021. Nearly 70 per cent of annual gains were driven by manufacturing (38,700 or 5.2 per cent), the only major goods-producing industry[8] to have employment above its 2019 levels. The agriculture industry recorded lower employment in 2021, the second consecutive annual job loss, reflecting in part a decline in the number of foreign workers entering Ontario through the Temporary Foreign Workers program.[9]
Most major Ontario cities saw job gains in 2021, but few have recovered to pre-pandemic levels
While most of Ontario’s Census Metropolitan Areas (CMAs)[10] saw job gains in 2021, employment still trailed the 2019 pre-pandemic level for a majority of cities. Only five (London, Peterborough, Guelph, Toronto and Ottawa-Gatineau) of the 16 CMAs saw employment recover to the pre-pandemic annual level. Within these five CMAs, the pace of recovery varied substantially.
London was the only CMA to experience employment growth in both 2020 and 2021. Job gains in health care and social assistance, and educational services industries drove this growth, raising total employment in London 11.4 per cent above the 2019 level. Peterborough had the strongest pace (17.7 per cent) of job rebound in 2021 among the CMAs, lifting the city’s employment modestly above the 2019 level. Gains in professional, scientific and technical services helped Guelph employment rise above the pre-pandemic level by 1.3 per cent.
In 2021, jobs rebounded in the province’s two largest CMAs, leaving the employment level just above 2019. Ottawa’s employment gains were driven by public administration and construction, while Toronto’s were driven by higher employment in professional, scientific and technical services, and information, culture and recreation industries.
Despite job growth in 2021, employment in nearly all the other CMAs in Ontario remained below the 2019 level. On a proportional basis, the largest decline in employment over this period occurred in Greater Sudbury (5.6 per cent below 2019) and Brantford (5.1 per cent below 2019). This slow pace of recovery was concentrated among the largest employment sectors in these cities, including wholesale and retail trade, and health care and social assistance in Greater Sudbury, and manufacturing, and wholesale and retail trade in Brantford.
Figure 8 Employment in 11 Census Metropolitan Areas remained below the pre-pandemic level
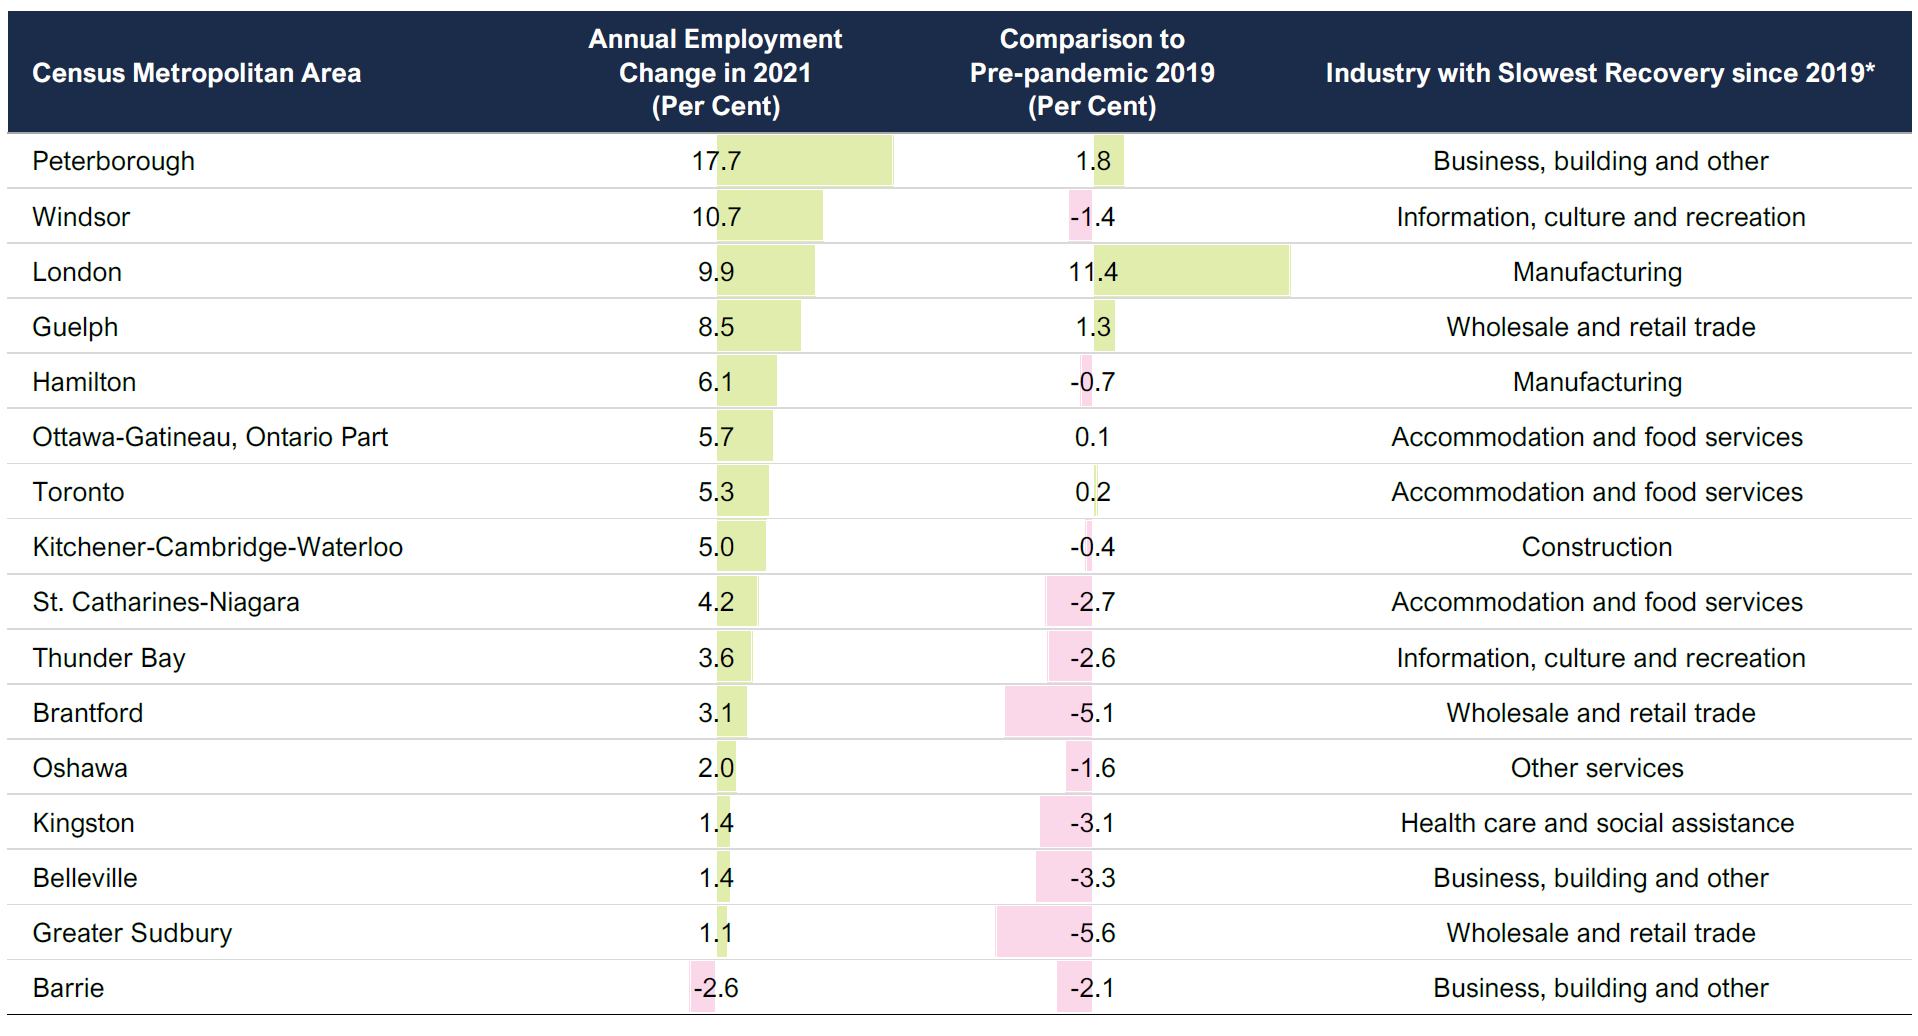
*Based on total employment change from 2019 to 2021.
Source: Statistics Canada and FAO.
Accessible version
| Census Metropolitan Area | Annual Employment Change in 2021 (Per Cent) | Comparison to Pre-pandemic 2019 (Per Cent) | Industry with Slowest Recovery since 2019 |
|---|---|---|---|
| Peterborough | 17.7 | 1.8 | Business, building and other |
| Windsor | 10.7 | -1.4 | Information, culture and recreation |
| London | 9.9 | 11.4 | Manufacturing |
| Guelph | 8.5 | 1.3 | Wholesale and retail trade |
| Hamilton | 6.1 | -0.7 | Manufacturing |
| Ottawa-Gatineau, Ontario Part | 5.7 | 0.1 | Accommodation and food services |
| Toronto | 5.3 | 0.2 | Accommodation and food services |
| Kitchener-Cambridge-Waterloo | 5.0 | -0.4 | Construction |
| St. Catharines-Niagara | 4.2 | -2.7 | Accommodation and food services |
| Thunder Bay | 3.6 | -2.6 | Information, culture and recreation |
| Brantford | 3.1 | -5.1 | Wholesale and retail trade |
| Oshawa | 2.0 | -1.6 | Other services |
| Kingston | 1.4 | -3.1 | Health care and social assistance |
| Belleville | 1.4 | -3.3 | Business, building and other |
| Greater Sudbury | 1.1 | -5.6 | Wholesale and retail trade |
| Barrie | -2.6 | -2.1 | Business, building and other |
Labour market performance of Ontario’s immigrant and visible minority population
Ontario’s recent immigrants saw strong rebound in employment
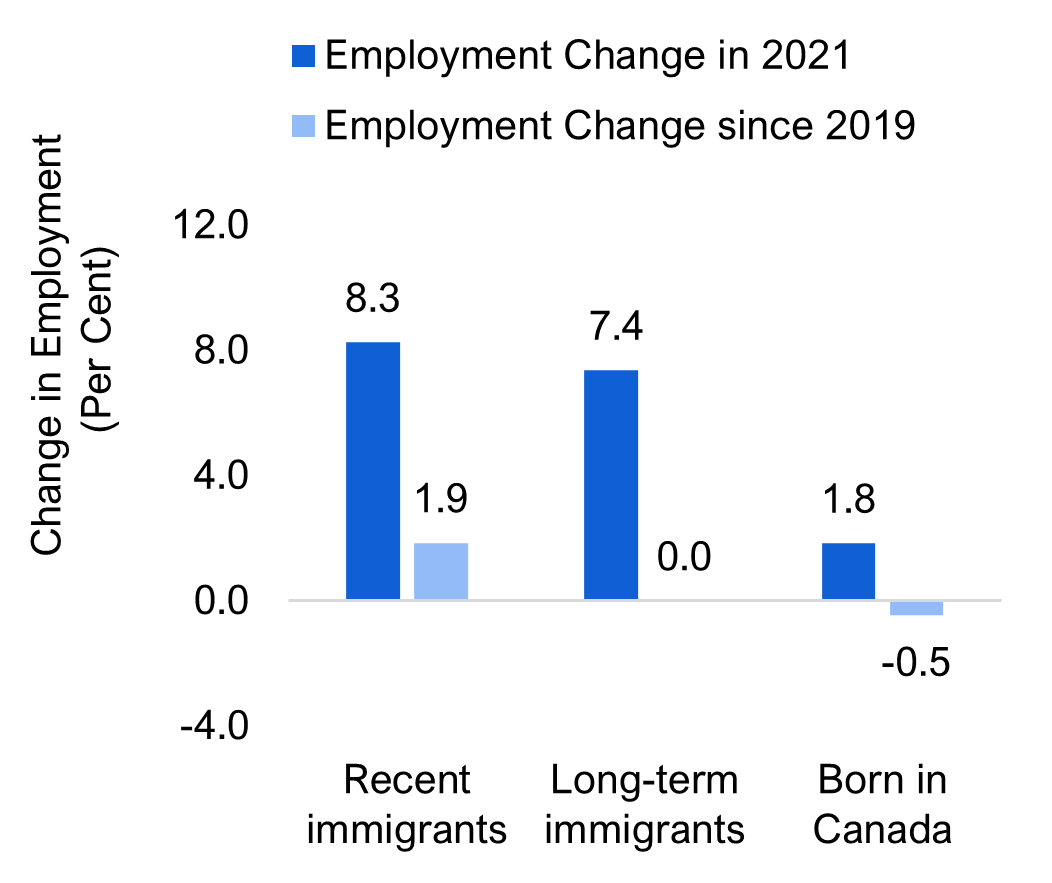
Figure 9 Employment among core-age immigrants rebounded strongly in 2021
Source: Statistics Canada and FAO.
Accessible version
| Employment Change in 2021 (Per Cent) | Employment Change since 2019 (Per Cent) | |
|---|---|---|
| Recent immigrants | 8.3 | 1.9 |
| Long-term immigrants | 7.4 | 0.0 |
| Born in Canada | 1.8 | -0.5 |
After experiencing a sharper pace of employment loss in 2020, Ontario’s core-age (25-54) landed immigrants[11] had faster (7.6 per cent) employment growth in 2021 compared to their counterparts born in Canada (1.8 per cent). Job gains by landed immigrants represented nearly 60 per cent of the total employment increase for all core-age workers in 2021.
A strong job performance in 2021 lifted the employment of recent immigrants[12] 1.9 per cent above the 2019 pre-pandemic level. In contrast, long-term immigrants,[13] who represented a large majority of pre-pandemic total immigrant employment in Ontario, saw a much slower recovery with essentially no job gains over the same period. Employment among those born in Canada remained modestly below pre-pandemic levels (0.5 per cent lower).
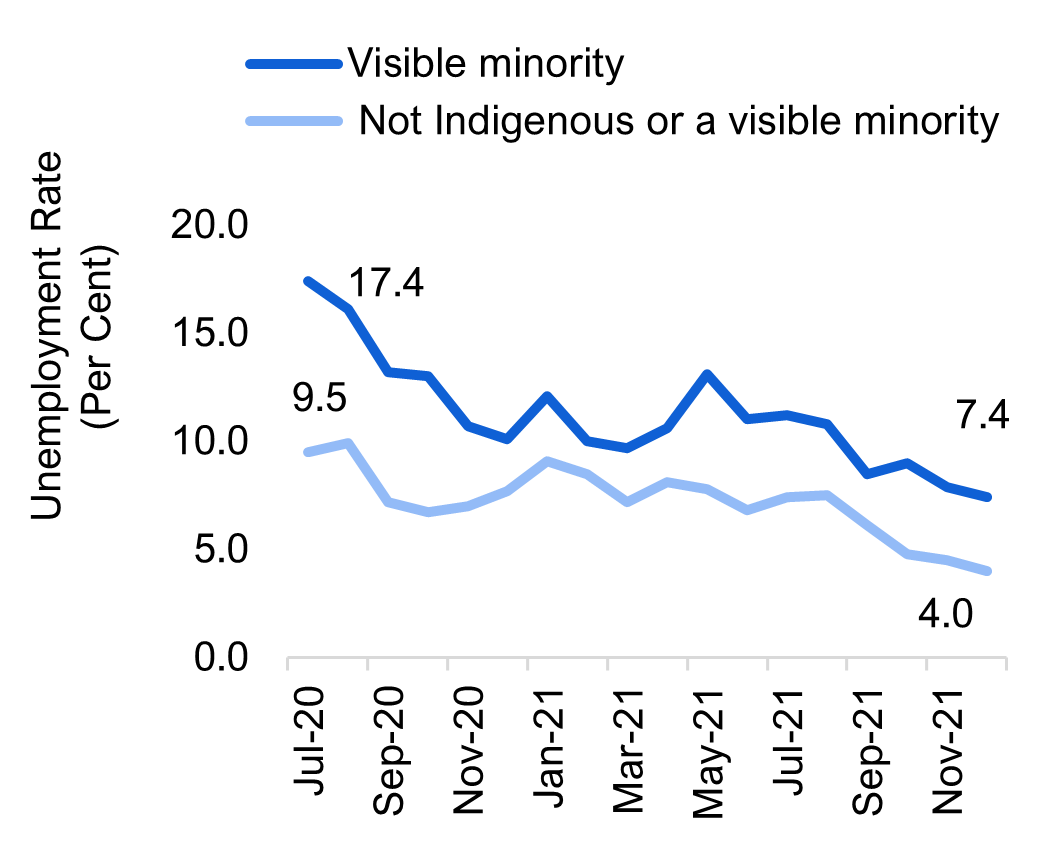
The unemployment rate of Ontario’s visible minority population declined
Figure 10 Unemployment rate continued to decline among visible minority population
Source: Statistics Canada and FAO.
Accessible version
| Date | Visible minority (Per Cent) | Not Indigenous or a visible minority (Per Cent) |
|---|---|---|
| Jul-20 | 17.4 | 9.5 |
| Aug-20 | 16.1 | 9.9 |
| Sep-20 | 13.2 | 7.2 |
| Oct-20 | 13.0 | 6.7 |
| Nov-20 | 10.7 | 7.0 |
| Dec-20 | 10.1 | 7.7 |
| Jan-21 | 12.1 | 9.1 |
| Feb-21 | 10.0 | 8.5 |
| Mar-21 | 9.7 | 7.2 |
| Apr-21 | 10.6 | 8.1 |
| May-21 | 13.1 | 7.8 |
| Jun-21 | 11.0 | 6.8 |
| Jul-21 | 11.2 | 7.4 |
| Aug-21 | 10.8 | 7.5 |
| Sep-21 | 8.5 | 6.1 |
| Oct-21 | 9.0 | 4.8 |
| Nov-21 | 7.9 | 4.5 |
| Dec-21 | 7.4 | 4.0 |
The unemployment rate among Ontario’s visible minority population trended lower throughout 2021, in tandem with the decline experienced by all other workers. Since July 2020,[14] the unemployment rate of Ontario’s visible minority population declined from 17.4 per cent to 7.4 per cent in December 2021. Over the same period, the unemployment rate of Ontarians who do not identify as indigenous or a visible minority declined from 9.5 per cent to 4.0 per cent. As a result, the unemployment rate gap between visible minority workers and all others narrowed from 7.9 percentage points in July 2020 to 3.4 percentage points in December 2021.
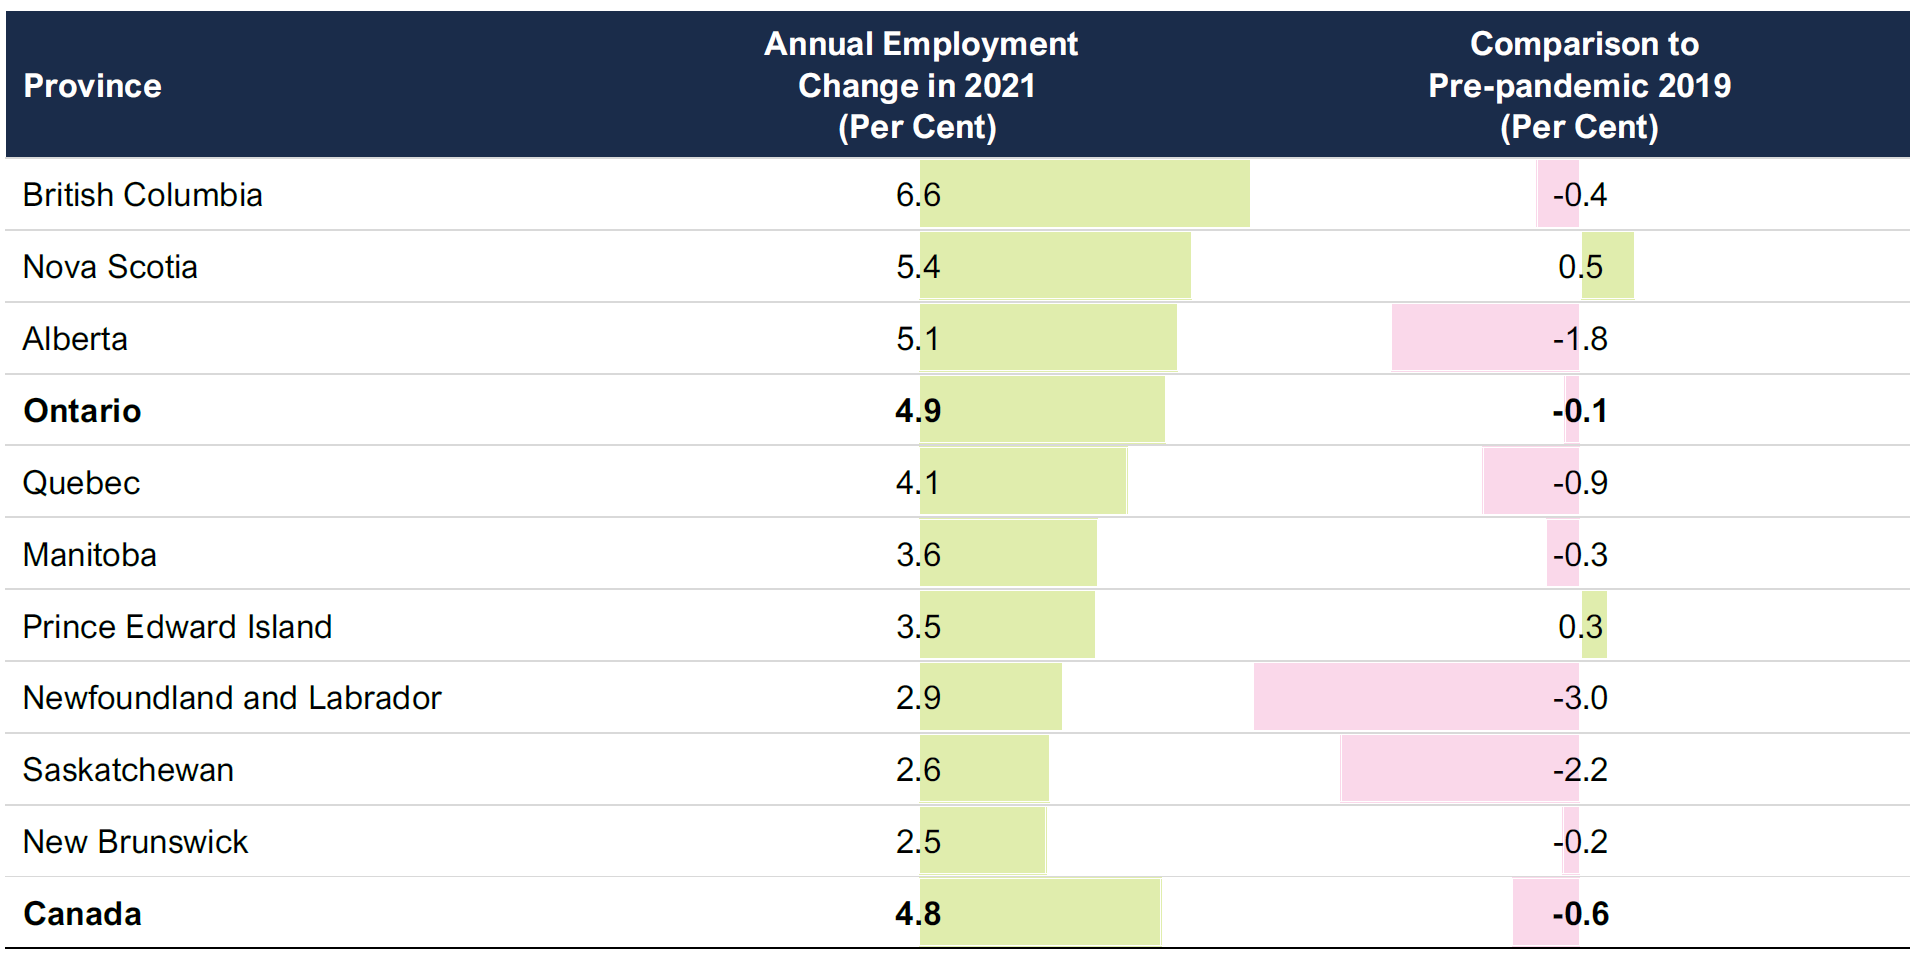
All provinces experienced employment growth in 2021
On an average annual basis, all provinces experienced employment gains in 2021. Ontario (4.9 per cent) recorded the fourth largest pace of job gains, trailing British Columbia (6.6 per cent), Nova Scotia (5.4 per cent) and Alberta (5.1 per cent).
Figure 11 Ontario experienced the fourth fastest pace of job gains among all the provinces in 2021
Source: Statistics Canada and FAO.
Accessible version
| Province | Annual Employment Change in 2021 (Per Cent) |
Comparison to Pre-pandemic 2019 (Per Cent) |
|---|---|---|
| British Columbia | 6.6 | -0.4 |
| Nova Scotia | 5.4 | 0.5 |
| Alberta | 5.1 | -1.8 |
| Ontario | 4.9 | -0.1 |
| Quebec | 4.1 | -0.9 |
| Manitoba | 3.6 | -0.3 |
| Prince Edward Island | 3.5 | 0.3 |
| Newfoundland and Labrador | 2.9 | -3.0 |
| Saskatchewan | 2.6 | -2.2 |
| New Brunswick | 2.5 | -0.2 |
| Canada | 4.8 | -0.6 |
On an annual average basis, 2021 employment in most provinces remained below the pre-pandemic 2019 level. Only two provinces – Prince Edward Island (0.3 per cent) and Nova Scotia (0.5 per cent) – saw higher employment compared to 2019. Ontario ranked third in terms of employment recovery compared to 2019, with jobs remaining 0.1 per cent lower. The job recovery pace was particularly slow in Newfoundland and Labrador (-3.0 per cent), Saskatchewan (-2.2 per cent) and Alberta (-1.8 per cent).
The lingering effects of the pandemic continue to cause labour market challenges
Long-term unemployment elevated
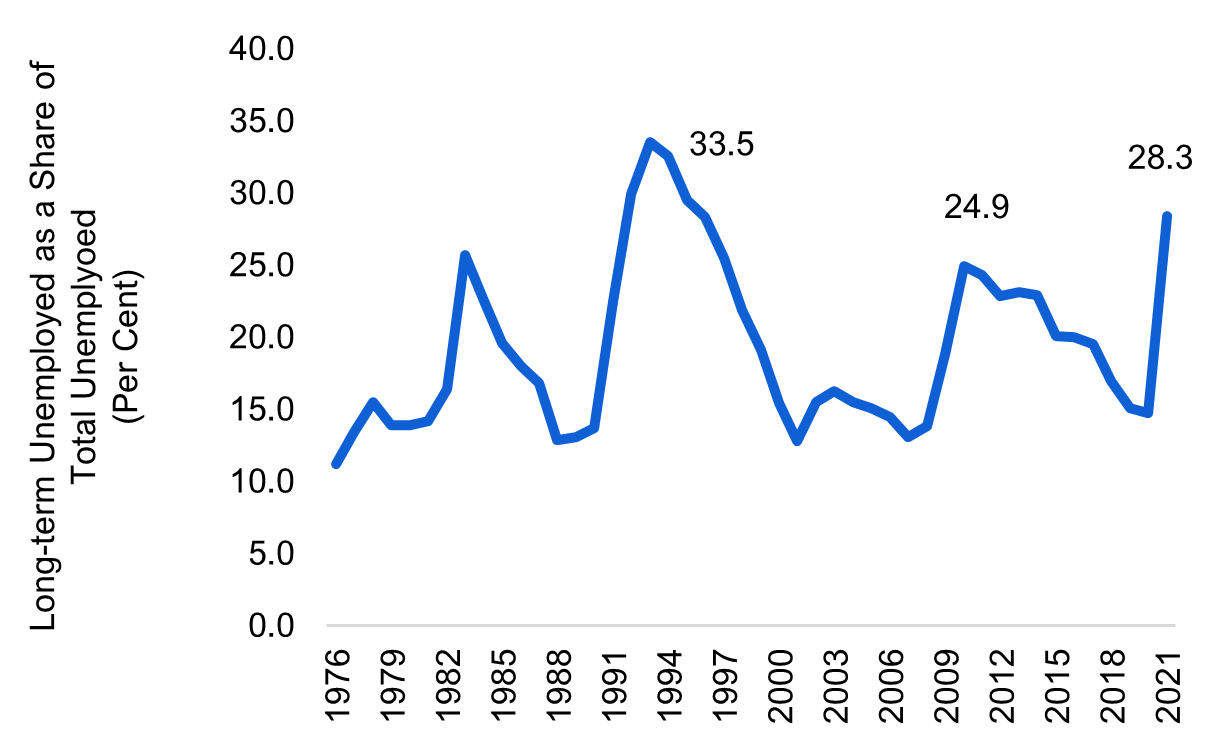
- Even though Ontario’s total employment recovered very close to pre-pandemic levels, the share of unemployed individuals who did not have a job for six months or longer climbed to its highest point since the early 1990s.
- Over 28 per cent of the total unemployed Ontarians remained out of work for six months or longer. More than half of this group were unemployed for a year or longer.
- Long-term detachment from the labour market can result in skill erosion and make reemployment more difficult for job searchers. This could also slow the overall recovery in the labour market.[15]
Shifting skill requirements
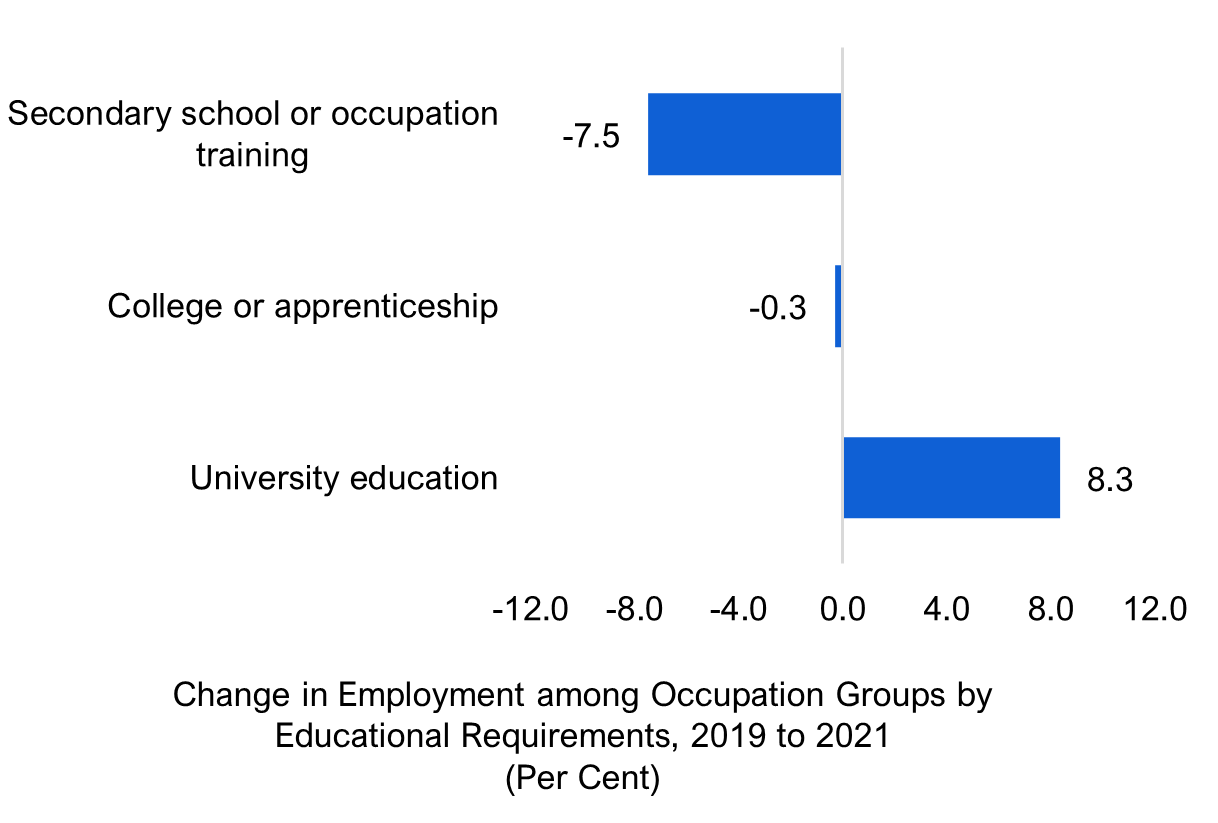
- Since 2019, employment gains have been concentrated in positions that usually require a university education (8.3 per cent or 196,900) while losses were observed in occupations that usually require less education.[16]
- Within specific occupations that saw strong job growth since 2019, the importance of “softer skills” such as active learning, reading comprehension, writing, complex problem solving, as well as specialized technical skills like programming and operations analysis increased.[17]
- A shift in demand for these skills could put Ontarians with lower education levels or fewer resources to upgrade their skills at a higher risk of job displacement.[18]
Job growth slow in some sectors despite record vacancies
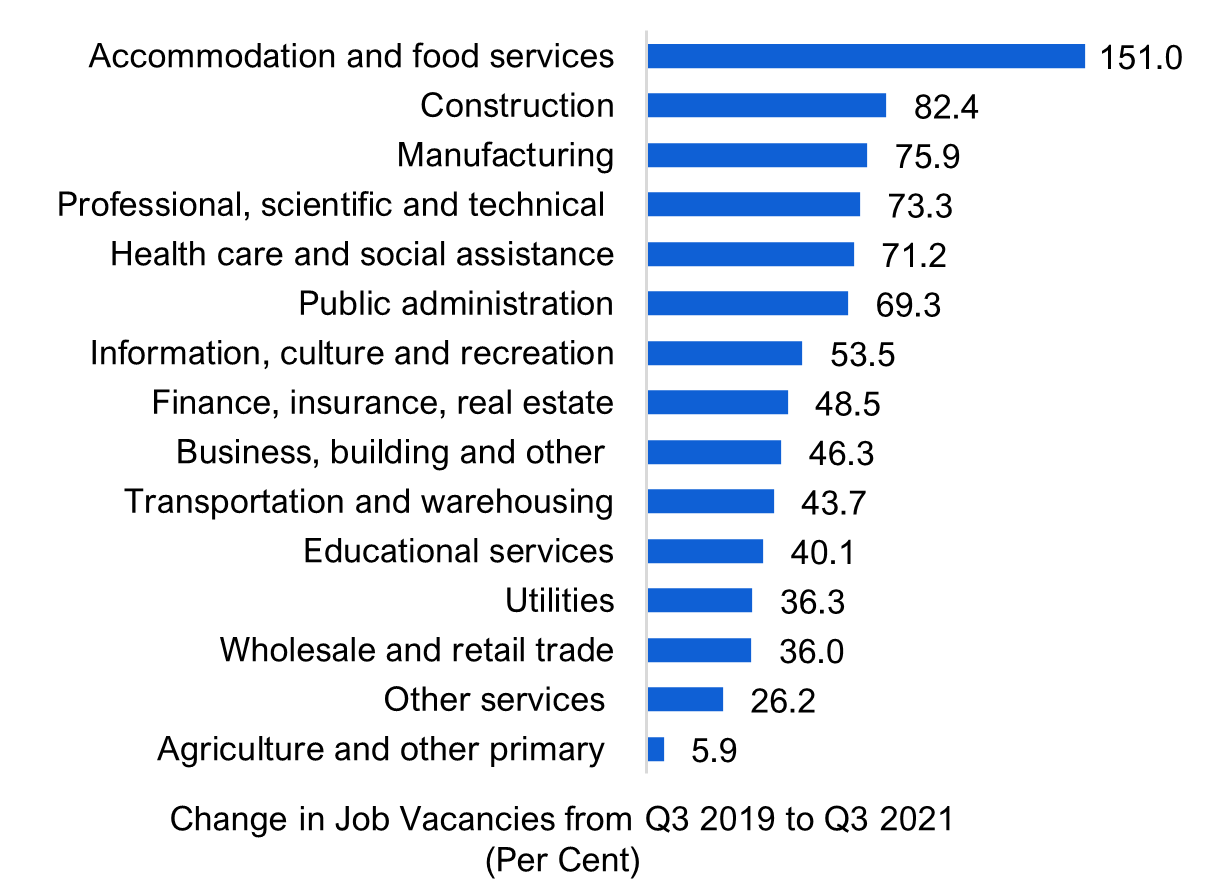
- Employers in several industries have faced increased challenges in hiring new workers, resulting in sharply higher job vacancies coupled with weak employment growth in 2021.
- Despite record job vacancies, accommodation and food services had the slowest employment growth since 2019. This could partly reflect workers switching to other industries amid health concerns and repeated pandemic-related restrictions that have affected business operations.[19] Imbalances in other sectors could reflect skill shortages or geographic mismatch between vacancies and workers.[20]
- Small businesses could face heightened hiring challenges, especially in accommodation and food services.[21] Persistent labour shortages could be detrimental to productivity and competitiveness in the broader economy.
Source: Statistics Canada and FAO.
Accessible version
|
Long-term unemployment elevated |
|
| Year | Long-term unemployed as a share of total unemployed(Per Cent) |
| 1976 | 11.2 |
| 1977 | 13.4 |
| 1978 | 15.5 |
| 1979 | 13.9 |
| 1980 | 13.9 |
| 1981 | 14.2 |
| 1982 | 16.4 |
| 1983 | 25.7 |
| 1984 | 22.5 |
| 1985 | 19.6 |
| 1986 | 18.0 |
| 1987 | 16.8 |
| 1988 | 12.8 |
| 1989 | 13.1 |
| 1990 | 13.7 |
| 1991 | 22.5 |
| 1992 | 29.9 |
| 1993 | 33.5 |
| 1994 | 32.6 |
| 1995 | 29.5 |
| 1996 | 28.3 |
| 1997 | 25.4 |
| 1998 | 21.9 |
| 1999 | 19.1 |
| 2000 | 15.4 |
| 2001 | 12.8 |
| 2002 | 15.5 |
| 2003 | 16.2 |
| 2004 | 15.5 |
| 2005 | 15.1 |
| 2006 | 14.4 |
| 2007 | 13.1 |
| 2008 | 13.8 |
| 2009 | 18.8 |
| 2010 | 24.9 |
| 2011 | 24.3 |
| 2012 | 22.8 |
| 2013 | 23.1 |
| 2014 | 22.9 |
| 2015 | 20.0 |
| 2016 | 20.0 |
| 2017 | 19.5 |
| 2018 | 16.9 |
| 2019 | 15.0 |
| 2020 | 14.7 |
| 2021 | 28.3 |
|
Shifting skill requirement |
|
| Change in Employment among Occupation Groups by Educational Requirements, 2019 to 2021 (Per Cent) | |
| University education | 8.3 |
| College or apprenticeship | -0.3 |
| Secondary school or occupation training | -7.5 |
|
Job growth slow in some sectors despite record vacancies |
|
| Industry | Change in Job Vacancies from Q3 2019 to Q3 2021 (Per Cent) |
|---|---|
| Agriculture and other primary | 5.9 |
| Other services | 26.2 |
| Wholesale and retail trade | 36.0 |
| Utilities | 36.3 |
| Educational services | 40.1 |
| Transportation and warehousing | 43.7 |
| Business, building and other | 46.3 |
| Finance, insurance, real estate | 48.5 |
| Information, culture and recreation | 53.5 |
| Public administration | 69.3 |
| Health care and social assistance | 71.2 |
| Professional, scientific and technical | 73.3 |
| Manufacturing | 75.9 |
| Construction | 82.4 |
| Accommodation and food services | 151.0 |
Update on January 2022 labour market
Since early 2020, the pace of job growth in Ontario has been highly affected by the pandemic, with significant job losses during lockdowns followed by rapid gains as the economy reopened. The swift spread of the Omicron variant prompted the Ontario government to enact select restrictions in January 2022. As a result, employment fell sharply in January, down 145,700 (or -1.9 per cent) compared to December, while the unemployment rate jumped from 6.1 per cent to 7.3 per cent.
With the reopening of the economy underway in February, employment is expected to rebound quickly in coming months. Statistics Canada’s report on February labour market data will be released on March 11.
Figure 12 Monthly employment change highly affected by COVID-19 cases
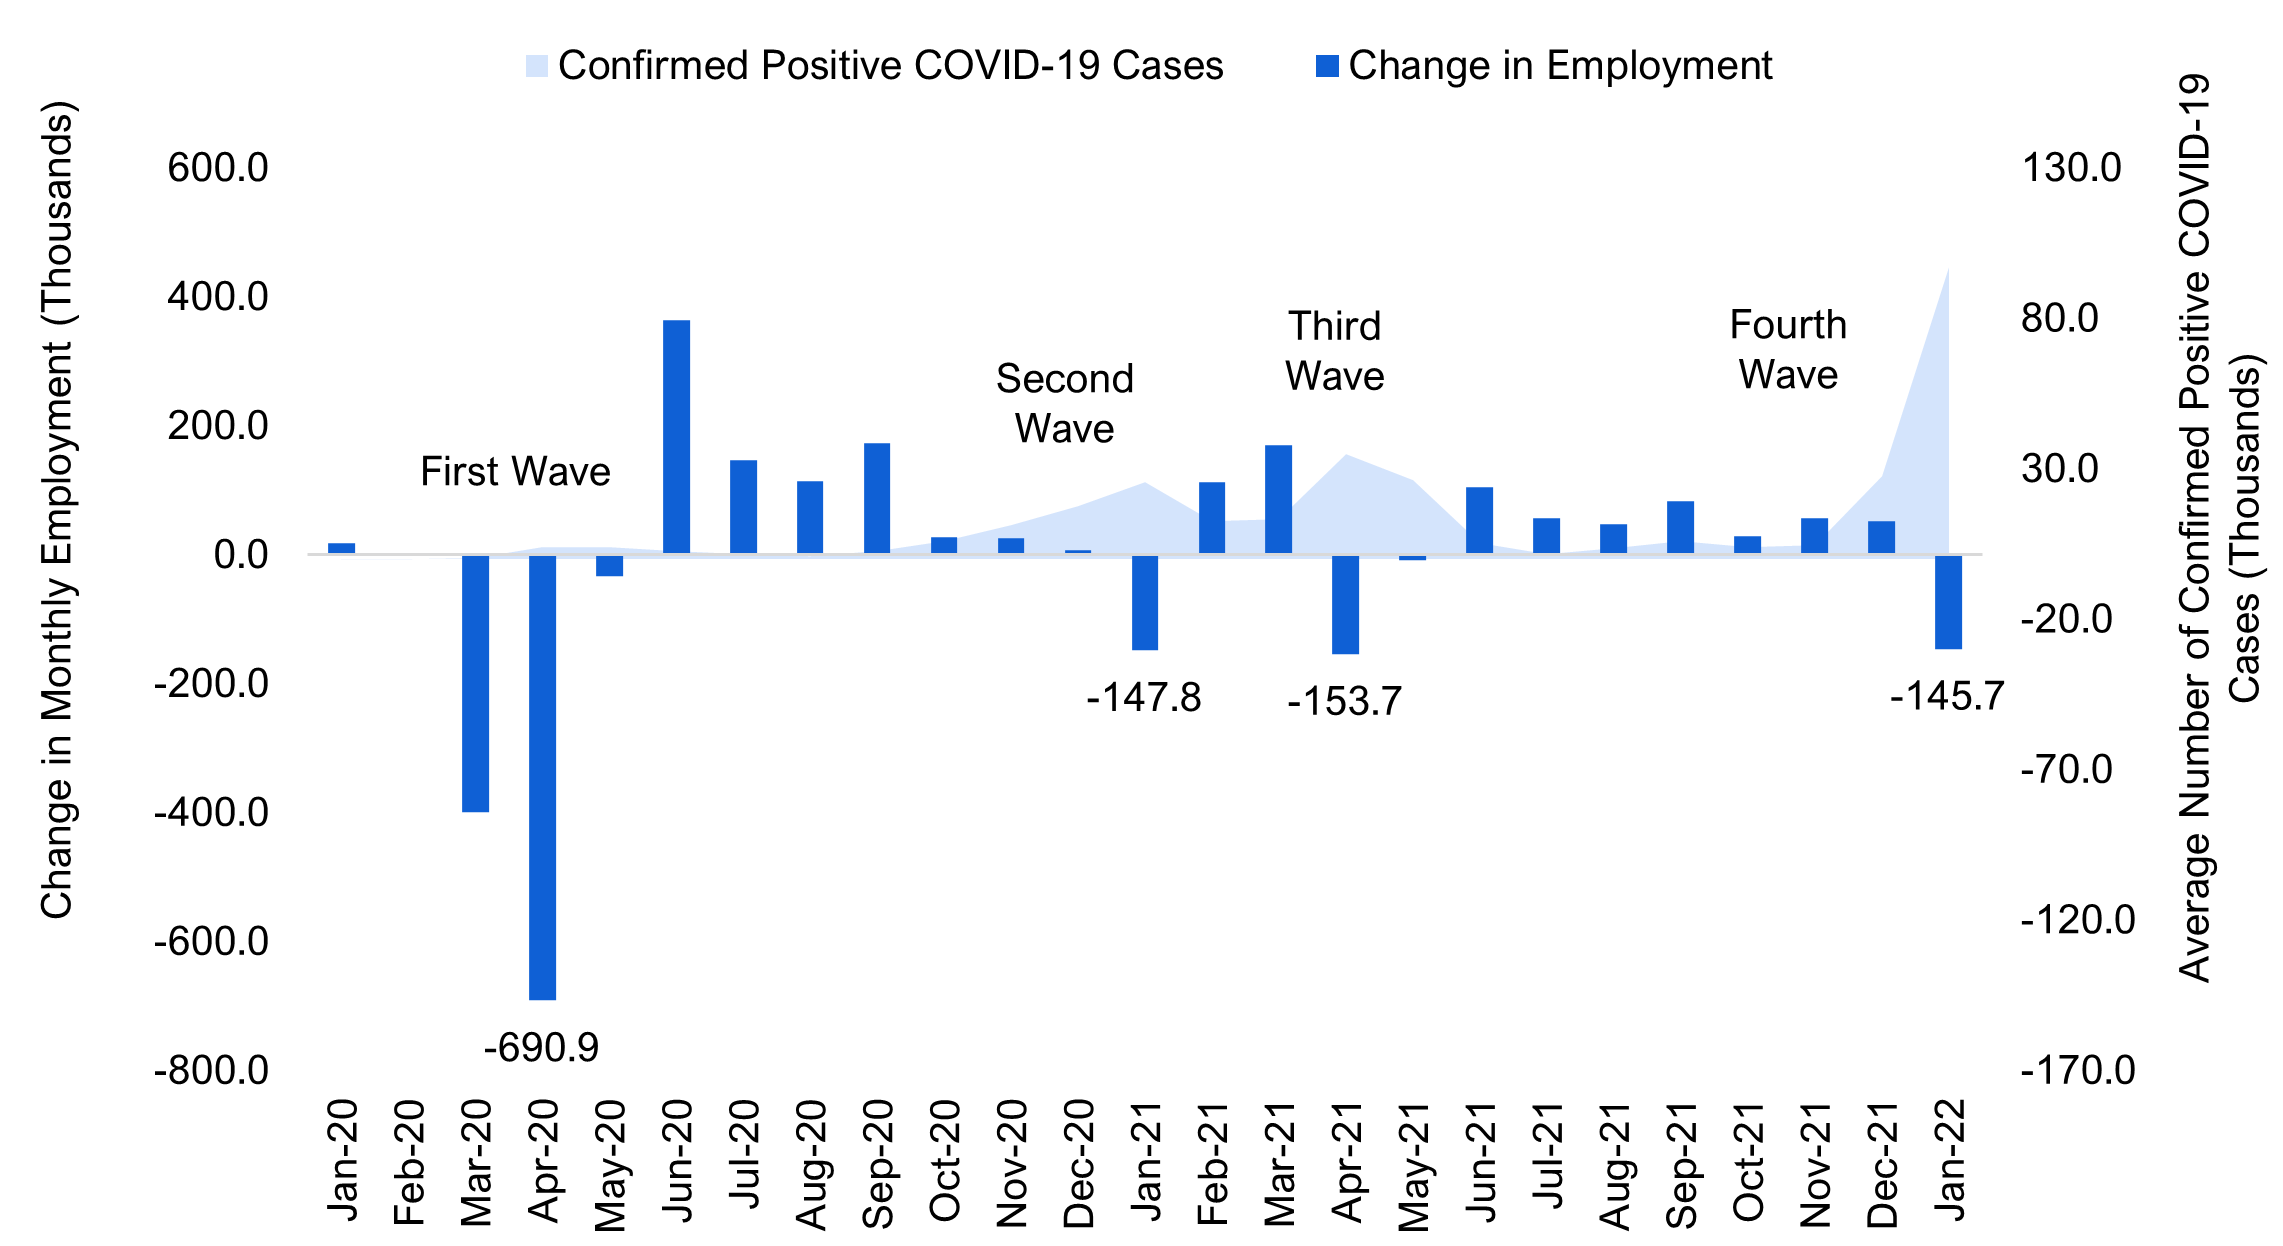
Note: Actual number of confirmed positive COVID-19 cases during the Omicron wave is likely higher than reported due to testing difficulties. Waves in this chart are defined by virus outbreaks that prompted the government to enact restrictions.
Source: Statistics Canada, Ontario Data Catalogue and FAO.
Accessible version
| Date | Confirmed Positive COVID-19 Cases (Thousands) | Change in Employment (Thousands) |
|---|---|---|
| Jan-20 | 0.0 | 19.2 |
| Feb-20 | 0.0 | 3.3 |
| Mar-20 | 0.4 | -398.5 |
| Apr-20 | 4.1 | -690.9 |
| May-20 | 3.9 | -33.2 |
| Jun-20 | 2.8 | 365.0 |
| Jul-20 | 1.6 | 147.1 |
| Aug-20 | 1.1 | 114.8 |
| Sep-20 | 2.6 | 173.0 |
| Oct-20 | 6.2 | 27.3 |
| Nov-20 | 11.4 | 26.0 |
| Dec-20 | 17.6 | 7.7 |
| Jan-21 | 25.7 | -147.8 |
| Feb-21 | 12.7 | 112.4 |
| Mar-21 | 13.5 | 170.8 |
| Apr-21 | 35.0 | -153.7 |
| May-21 | 26.2 | -8.5 |
| Jun-21 | 5.5 | 105.1 |
| Jul-21 | 1.6 | 56.5 |
| Aug-21 | 3.7 | 48.5 |
| Sep-21 | 6.0 | 83.5 |
| Oct-21 | 3.9 | 29.6 |
| Nov-21 | 4.8 | 57.4 |
| Dec-21 | 27.7 | 52.5 |
| Jan-22 | 97.2 | -145.7 |
Appendix
Ontario’s long-term unemployed individuals
| Ontario's long-term unemployed | 2019 (Thousands) |
2021 (Thousands) |
Change from 2019 to 2021 (Thousands) |
Change from 2019 to 2021 (Per Cent) |
|---|---|---|---|---|
| Total | 66.1 | 181.5 | 115.4 | 174.6 |
| By duration of unemployment | ||||
| For 6 months to less than 1 year | 31.0 (46.9%) |
76.6 (42.2%) |
45.6 | 147.1 |
| For 1 year | 16.2 | 44.7 | 28.5 | 175.9 |
| (24.5%) | (24.6%) | |||
| For more than 1 year | 18.9 | 60.3 | 41.4 | 219.0 |
| (28.6%) | (33.2%) | |||
| By gender | ||||
| Males | 36.9 | 103.9 | 67.0 | 181.6 |
| (55.8%) | (57.2%) | |||
| Females | 29.2 | 77.6 | 48.4 | 165.8 |
| (44.2%) | (42.8%) | |||
| By age group | ||||
| Youth (15-24 years) | 8.9 | 28.9 | 20.0 | 224.7 |
| (13.5%) | (15.9%) | |||
|
Core (25-54 years) |
39.2 | 104.7 | 65.5 | 167.1 |
| (59.3%) | (57.7%) | |||
| Older (55 years and over) | 18.0 | 47.9 | 29.9 | 166.1 |
| (27.2%) | (26.4%) |
Monthly employment trend in 2020-2021 by demographic groups
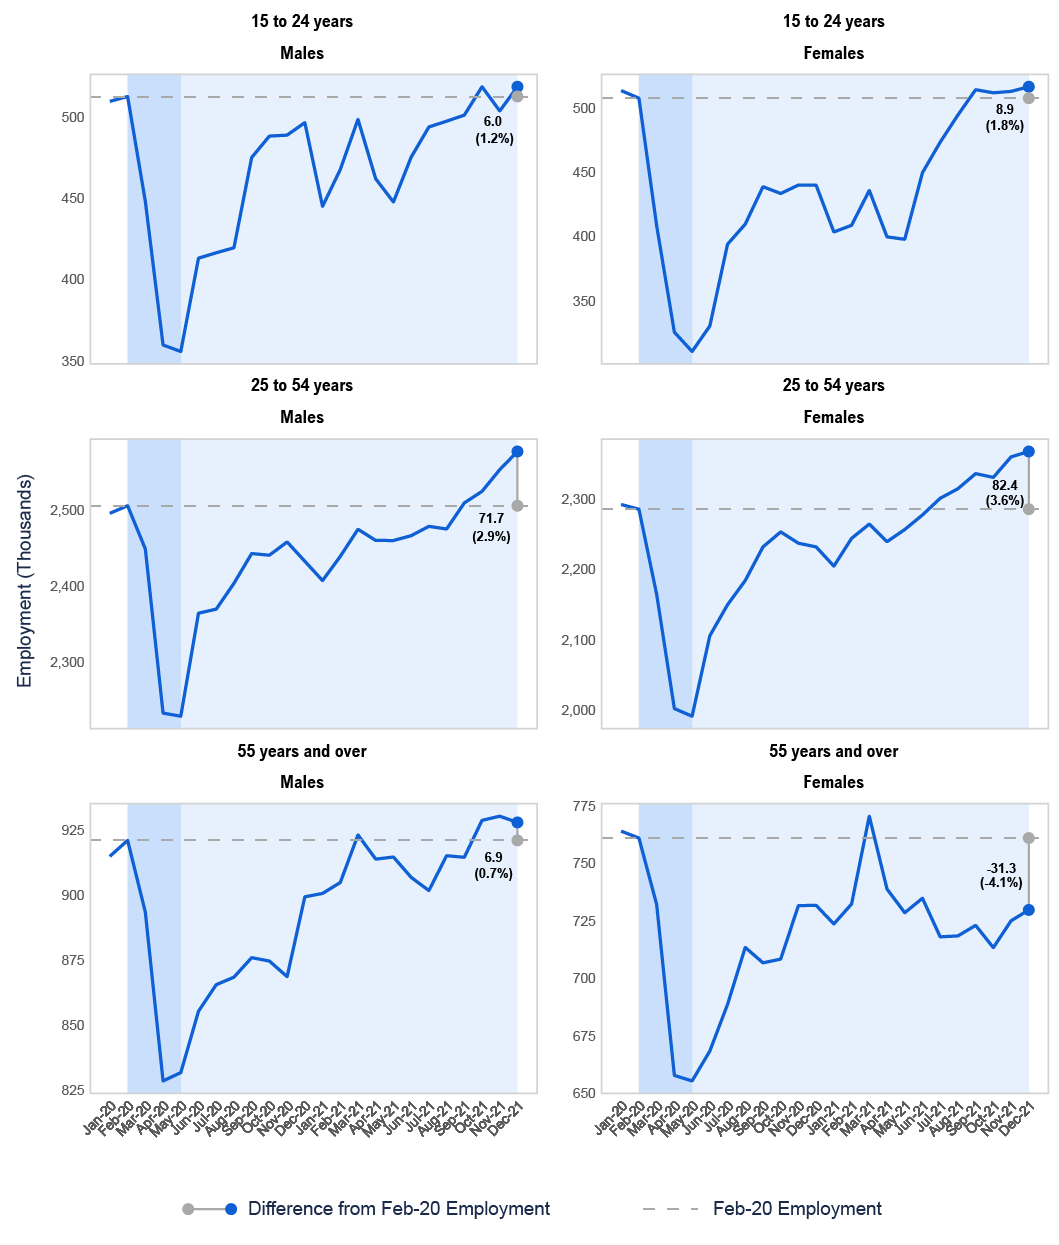
Source: Statistics Canada and FAO.
Accessible version
| Males (Thousands) | Females (Thousands) | ||||||
|---|---|---|---|---|---|---|---|
| Years | Month | 15 to 24 years | 25 to 54 years | 55 years and over | 15 to 24 years | 25 to 54 years | 55 years and over |
| 2020 | |||||||
| Jan | 509.8 | 2,496.2 | 914.8 | 513.5 | 2,292.9 | 764.0 | |
| Feb | 512.8 | 2,506.2 | 920.9 | 507.6 | 2,286.2 | 761.0 | |
| Mar | 448.2 | 2,449.1 | 893.3 | 408.6 | 2,164.8 | 732.1 | |
| Apr | 359.7 | 2,232.1 | 828.4 | 325.7 | 2,001.7 | 657.7 | |
| May | 355.7 | 2,228.0 | 831.6 | 310.7 | 1,990.8 | 655.3 | |
| Jun | 413.2 | 2,364.2 | 855.2 | 330.5 | 2,105.6 | 668.3 | |
| Jul | 416.5 | 2,369.5 | 865.4 | 394.1 | 2,149.9 | 688.6 | |
| Aug | 419.6 | 2,403.6 | 868.3 | 409.7 | 2,184.4 | 713.4 | |
| Sep | 475.2 | 2,443.0 | 875.8 | 438.8 | 2,232.4 | 706.7 | |
| Oct | 488.4 | 2,440.8 | 874.5 | 433.5 | 2,253.8 | 708.3 | |
| Nov | 489.0 | 2,458.3 | 868.5 | 440.1 | 2,237.7 | 731.6 | |
| Dec | 496.7 | 2,432.8 | 899.2 | 440.0 | 2,232.4 | 731.7 | |
| 2021 | |||||||
| Jan | 445.1 | 2,407.3 | 900.5 | 403.6 | 2,205.0 | 723.6 | |
| Feb | 467.8 | 2,439.2 | 904.7 | 408.8 | 2,244.6 | 732.3 | |
| Mar | 498.7 | 2,475.1 | 923.0 | 435.9 | 2,265.0 | 770.5 | |
| Apr | 462.1 | 2,460.3 | 913.7 | 399.8 | 2,239.9 | 738.8 | |
| May | 447.8 | 2,460.2 | 914.5 | 397.9 | 2,257.2 | 728.5 | |
| Jun | 475.4 | 2,466.6 | 906.7 | 449.7 | 2,278.0 | 734.8 | |
| Jul | 494.0 | 2,478.9 | 901.6 | 473.4 | 2,301.8 | 718.0 | |
| Aug | 497.6 | 2,475.4 | 915.0 | 494.5 | 2,315.4 | 718.4 | |
| Sep | 501.3 | 2,509.9 | 914.4 | 514.2 | 2,337.0 | 723.0 | |
| Oct | 518.8 | 2,525.2 | 928.6 | 511.8 | 2,331.6 | 713.3 | |
| Nov | 503.9 | 2,553.9 | 930.2 | 512.9 | 2,360.9 | 725.0 | |
| Dec | 518.8 | 2,577.9 | 927.8 | 516.5 | 2,368.6 | 729.7 | |
Monthly employment trend in 2020-2021 by job types
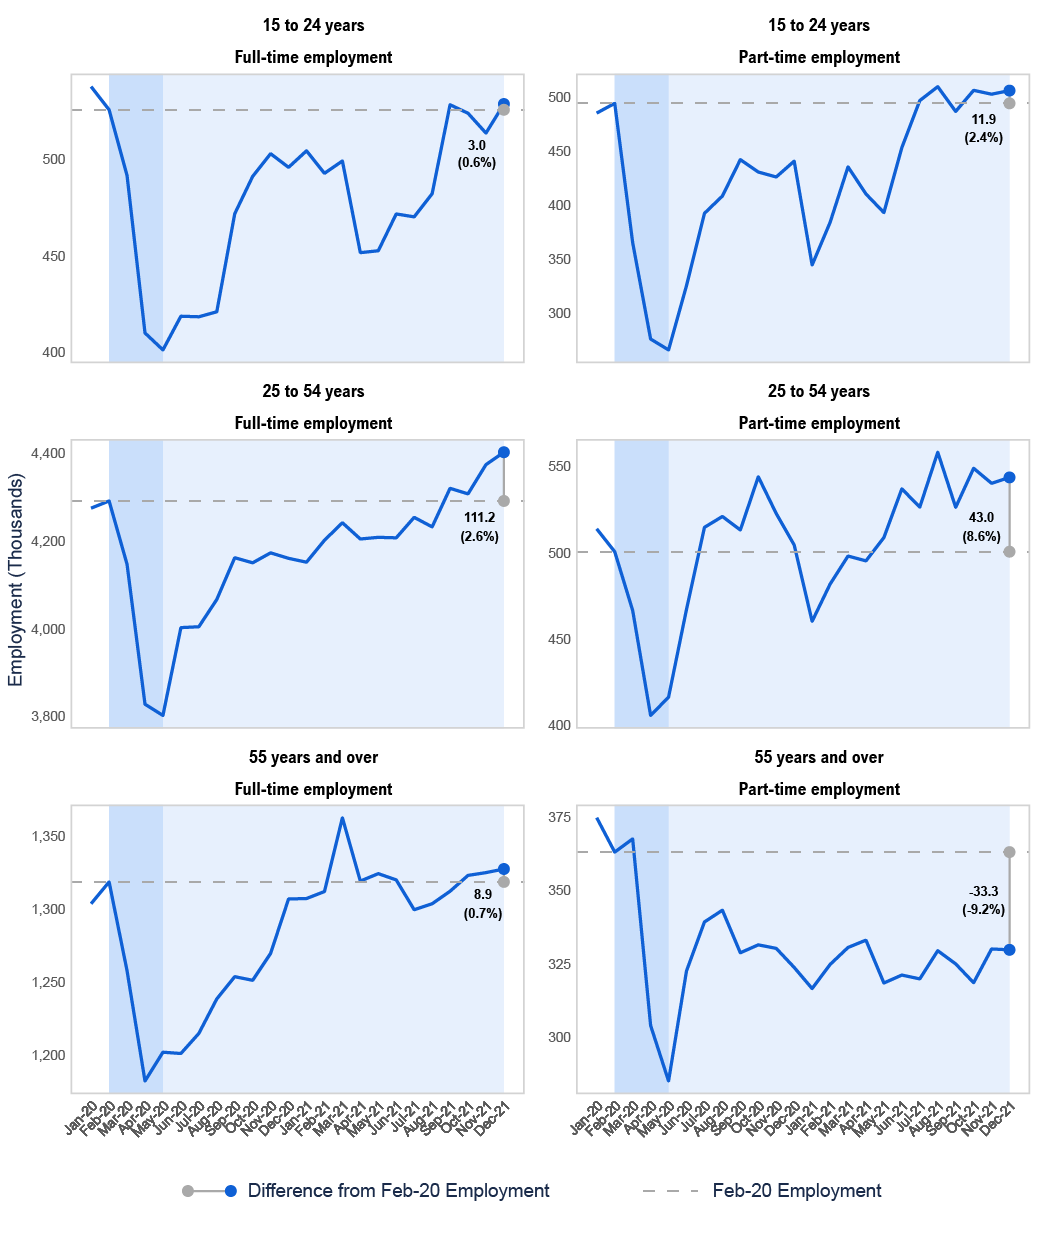
Source: Statistics Canada and FAO.
Accessible version
| Full-time employment (Thousands) | Part-time employment (Thousands) | ||||||
|---|---|---|---|---|---|---|---|
| Years | Month | 15 to 24 years | 25 to 54 years | 55 years and over | 15 to 24 years | 25 to 54 years | 55 years and over |
| 2020 | |||||||
| Jan | 537.8 | 4,275.3 | 1,303.9 | 485.5 | 513.8 | 374.8 | |
| Feb | 525.8 | 4,291.7 | 1,318.8 | 494.5 | 500.6 | 363.1 | |
| Mar | 491.7 | 4,147.3 | 1,257.8 | 365.1 | 466.6 | 367.6 | |
| Apr | 409.9 | 3,828.0 | 1,182.0 | 275.5 | 405.8 | 304.0 | |
| May | 401.1 | 3,802.3 | 1,201.8 | 265.4 | 416.4 | 285.1 | |
| Jun | 418.6 | 4,002.7 | 1,200.9 | 325.1 | 467.2 | 322.6 | |
| Jul | 418.3 | 4,004.7 | 1,214.7 | 392.3 | 514.7 | 339.3 | |
| Aug | 420.9 | 4,066.9 | 1,238.4 | 408.4 | 521.0 | 343.3 | |
| Sep | 471.8 | 4,162.2 | 1,253.7 | 442.2 | 513.2 | 328.8 | |
| Oct | 491.2 | 4,150.6 | 1,251.2 | 430.7 | 544.0 | 331.5 | |
| Nov | 503.0 | 4,173.3 | 1,269.7 | 426.1 | 522.7 | 330.3 | |
| Dec | 495.9 | 4,160.8 | 1,307.1 | 440.8 | 504.5 | 323.8 | |
| 2021 | |||||||
| Jan | 504.5 | 4,152.0 | 1,307.4 | 344.3 | 460.3 | 316.6 | |
| Feb | 492.8 | 4,202.0 | 1,312.2 | 383.8 | 481.8 | 324.8 | |
| Mar | 499.2 | 4,242.0 | 1,362.9 | 435.5 | 498.1 | 330.6 | |
| Apr | 451.6 | 4,204.9 | 1,319.4 | 410.3 | 495.3 | 333.1 | |
| May | 452.6 | 4,208.7 | 1,324.5 | 393.0 | 508.8 | 318.5 | |
| Jun | 471.7 | 4,207.6 | 1,320.2 | 453.4 | 537.0 | 321.2 | |
| Jul | 470.2 | 4,254.3 | 1,299.7 | 497.1 | 526.4 | 319.9 | |
| Aug | 482.2 | 4,232.6 | 1,303.8 | 510.0 | 558.2 | 329.5 | |
| Sep | 528.4 | 4,320.5 | 1,312.4 | 487.0 | 526.3 | 325.0 | |
| Oct | 524.0 | 4,307.9 | 1,323.3 | 506.6 | 548.9 | 318.6 | |
| Nov | 513.7 | 4,374.6 | 1,325.2 | 503.0 | 540.2 | 330.1 | |
| Dec | 528.8 | 4,402.9 | 1,327.7 | 506.4 | 543.6 | 329.8 | |
Monthly employment trend in 2020-2021 by industry
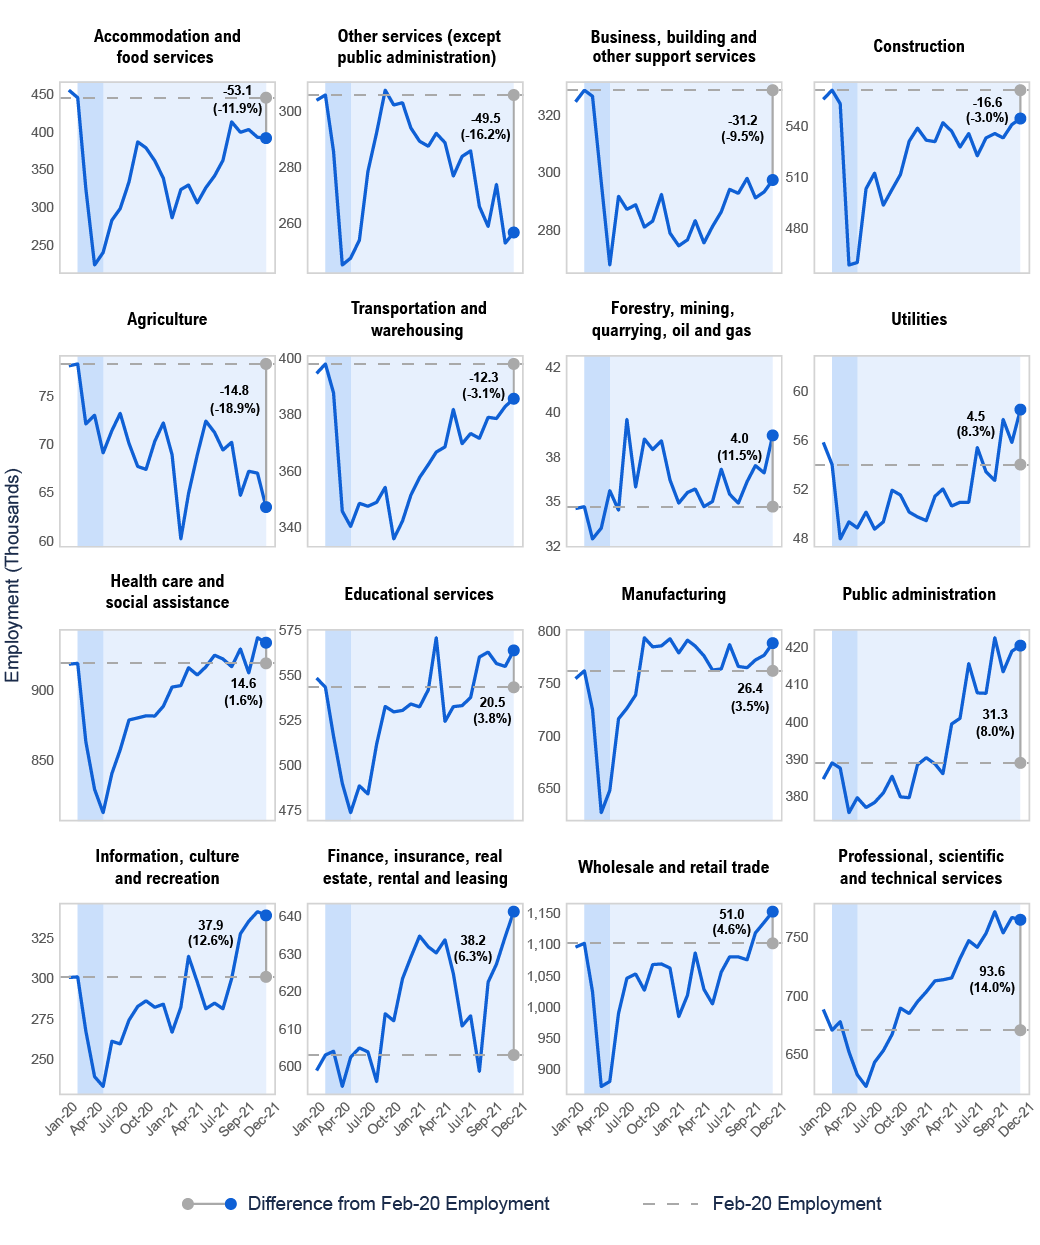
Source: Statistics Canada and FAO.
Accessible version
| Industry | Month | 2020 (Thousands) | 2021 (Thousands) |
|---|---|---|---|
| Accommodation and food services | |||
| Jan | 454.6 | 286.4 | |
| Feb | 444.6 | 323.6 | |
| Mar | 325.0 | 329.6 | |
| Apr | 224.3 | 306.0 | |
| May | 240.8 | 326.1 | |
| Jun | 283.3 | 341.8 | |
| Jul | 298.8 | 362.0 | |
| Aug | 333.7 | 412.8 | |
| Sep | 386.5 | 399.1 | |
| Oct | 378.6 | 402.6 | |
| Nov | 361.5 | 392.6 | |
| Dec | 338.8 | 391.5 | |
| Agriculture | |||
| Jan | 78.1 | 68.9 | |
| Feb | 78.3 | 60.2 | |
| Mar | 72.1 | 64.9 | |
| Apr | 73.0 | 68.9 | |
| May | 69.1 | 72.4 | |
| Jun | 71.4 | 71.2 | |
| Jul | 73.2 | 69.4 | |
| Aug | 70.1 | 70.2 | |
| Sep | 67.7 | 64.7 | |
| Oct | 67.4 | 67.2 | |
| Nov | 70.3 | 67.0 | |
| Dec | 72.2 | 63.5 | |
| Business, building and other support services | |||
| Jan | 324.6 | 274.6 | |
| Feb | 328.6 | 276.7 | |
| Mar | 326.5 | 283.3 | |
| Apr | 296.7 | 275.6 | |
| May | 267.9 | 281.3 | |
| Jun | 291.8 | 286.4 | |
| Jul | 287.2 | 294.2 | |
| Aug | 288.8 | 292.8 | |
| Sep | 281.1 | 298.0 | |
| Oct | 283.2 | 291.2 | |
| Nov | 292.4 | 293.3 | |
| Dec | 279.0 | 297.4 | |
| Construction | |||
| Jan | 555.8 | 531.8 | |
| Feb | 561.1 | 530.9 | |
| Mar | 553.1 | 542.0 | |
| Apr | 458.6 | 537.1 | |
| May | 460.1 | 527.7 | |
| Jun | 503.3 | 535.7 | |
| Jul | 512.5 | 522.6 | |
| Aug | 493.7 | 533.1 | |
| Sep | 502.9 | 535.7 | |
| Oct | 511.6 | 533.1 | |
| Nov | 531.2 | 541.0 | |
| Dec | 538.8 | 544.5 | |
| Educational services | |||
| Jan | 548.2 | 532.2 | |
| Feb | 543.1 | 541.7 | |
| Mar | 515.9 | 570.6 | |
| Apr | 489.7 | 524.1 | |
| May | 473.4 | 532.3 | |
| Jun | 488.3 | 532.9 | |
| Jul | 483.8 | 537.4 | |
| Aug | 511.6 | 559.9 | |
| Sep | 532.4 | 562.7 | |
| Oct | 529.4 | 556.3 | |
| Nov | 530.2 | 554.7 | |
| Dec | 533.8 | 563.6 | |
| Finance, insurance, real estate, rental and leasing | |||
| Jan | 599.0 | 634.8 | |
| Feb | 603.1 | 631.9 | |
| Mar | 604.1 | 630.3 | |
| Apr | 594.7 | 633.8 | |
| May | 602.5 | 624.8 | |
| Jun | 605.0 | 610.8 | |
| Jul | 603.9 | 613.5 | |
| Aug | 596.0 | 598.7 | |
| Sep | 614.1 | 622.5 | |
| Oct | 612.2 | 627.3 | |
| Nov | 623.4 | 634.6 | |
| Dec | 629.1 | 641.3 | |
| Forestry, fishing, mining, quarrying, oil and gas | |||
| Jan | 34.6 | 34.9 | |
| Feb | 34.7 | 35.5 | |
| Mar | 32.9 | 35.7 | |
| Apr | 33.5 | 34.7 | |
| May | 35.6 | 35.0 | |
| Jun | 34.5 | 36.8 | |
| Jul | 39.6 | 35.4 | |
| Aug | 35.8 | 34.9 | |
| Sep | 38.5 | 36.1 | |
| Oct | 37.9 | 37.0 | |
| Nov | 38.4 | 36.6 | |
| Dec | 36.2 | 38.7 | |
| Health care and social assistance | |||
| Jan | 918.1 | 901.9 | |
| Feb | 918.8 | 902.9 | |
| Mar | 863.0 | 915.7 | |
| Apr | 829.2 | 910.5 | |
| May | 812.6 | 916.2 | |
| Jun | 840.4 | 924.6 | |
| Jul | 857.3 | 921.8 | |
| Aug | 878.4 | 916.4 | |
| Sep | 879.9 | 929.0 | |
| Oct | 881.5 | 912.0 | |
| Nov | 881.3 | 936.9 | |
| Dec | 888.2 | 933.4 | |
| Information, culture and recreation | |||
| Jan | 300.6 | 266.8 | |
| Feb | 301.0 | 282.1 | |
| Mar | 267.5 | 313.7 | |
| Apr | 239.3 | 297.7 | |
| May | 233.3 | 281.3 | |
| Jun | 261.2 | 284.8 | |
| Jul | 259.6 | 281.2 | |
| Aug | 274.2 | 299.9 | |
| Sep | 282.7 | 327.5 | |
| Oct | 286.1 | 335.2 | |
| Nov | 282.2 | 341.2 | |
| Dec | 284.1 | 338.9 | |
| Manufacturing | |||
| Jan | 754.6 | 778.9 | |
| Feb | 761.8 | 791.1 | |
| Mar | 725.0 | 785.5 | |
| Apr | 626.8 | 776.2 | |
| May | 648.0 | 762.7 | |
| Jun | 716.3 | 763.7 | |
| Jul | 726.1 | 786.8 | |
| Aug | 738.8 | 766.1 | |
| Sep | 793.3 | 764.8 | |
| Oct | 784.6 | 772.1 | |
| Nov | 785.7 | 776.7 | |
| Dec | 792.3 | 788.2 | |
| Other services (except public administration) | |||
| Jan | 304.1 | 289.3 | |
| Feb | 306.0 | 287.5 | |
| Mar | 285.7 | 292.2 | |
| Apr | 244.8 | 288.8 | |
| May | 247.3 | 276.8 | |
| Jun | 253.7 | 283.9 | |
| Jul | 278.5 | 285.9 | |
| Aug | 292.5 | 265.9 | |
| Sep | 307.7 | 258.7 | |
| Oct | 302.4 | 273.8 | |
| Nov | 303.2 | 252.7 | |
| Dec | 294.1 | 256.5 | |
| Professional, scientific and technical services | |||
| Jan | 688.1 | 703.2 | |
| Feb | 670.7 | 712.5 | |
| Mar | 677.9 | 713.5 | |
| Apr | 652.3 | 715.0 | |
| May | 632.9 | 731.4 | |
| Jun | 622.9 | 746.7 | |
| Jul | 643.4 | 741.1 | |
| Aug | 653.4 | 752.9 | |
| Sep | 667.2 | 771.3 | |
| Oct | 689.4 | 753.2 | |
| Nov | 684.8 | 766.4 | |
| Dec | 694.9 | 764.3 | |
| Public administration | |||
| Jan | 384.7 | 390.4 | |
| Feb | 389.0 | 388.7 | |
| Mar | 387.6 | 386.1 | |
| Apr | 375.7 | 399.4 | |
| May | 379.7 | 400.9 | |
| Jun | 377.1 | 415.5 | |
| Jul | 378.4 | 407.7 | |
| Aug | 381.0 | 407.6 | |
| Sep | 385.4 | 422.4 | |
| Oct | 379.9 | 413.3 | |
| Nov | 379.7 | 418.8 | |
| Dec | 388.5 | 420.3 | |
| Transportation and warehousing | |||
| Jan | 394.6 | 357.6 | |
| Feb | 397.9 | 362.2 | |
| Mar | 387.6 | 366.6 | |
| Apr | 345.6 | 368.5 | |
| May | 340.2 | 381.8 | |
| Jun | 348.4 | 369.6 | |
| Jul | 347.4 | 373.2 | |
| Aug | 348.8 | 371.5 | |
| Sep | 354.1 | 379.0 | |
| Oct | 335.8 | 378.5 | |
| Nov | 342.1 | 382.8 | |
| Dec | 351.3 | 385.6 | |
| Utilities | |||
| Jan | 55.8 | 49.4 | |
| Feb | 54.0 | 51.4 | |
| Mar | 47.9 | 52.0 | |
| Apr | 49.3 | 50.6 | |
| May | 48.8 | 50.9 | |
| Jun | 50.1 | 50.9 | |
| Jul | 48.7 | 55.4 | |
| Aug | 49.3 | 53.4 | |
| Sep | 51.9 | 52.7 | |
| Oct | 51.5 | 57.7 | |
| Nov | 50.1 | 55.8 | |
| Dec | 49.7 | 58.5 | |
| Wholesale and retail trade | |||
| Jan | 1,096.0 | 983.9 | |
| Feb | 1,102.0 | 1,018.6 | |
| Mar | 1,024.3 | 1,086.7 | |
| Apr | 871.7 | 1,027.8 | |
| May | 879.8 | 1,004.4 | |
| Jun | 989.4 | 1,055.8 | |
| Jul | 1,045.7 | 1,080.2 | |
| Aug | 1,052.8 | 1,080.2 | |
| Sep | 1,026.5 | 1,075.6 | |
| Oct | 1,067.8 | 1,118.9 | |
| Nov | 1,068.8 | 1,135.7 | |
| Dec | 1,062.1 | 1,153.0 |
Monthly employment trend in 2020-2021 by Ontario’s Census Metropolitan Areas (CMAs)
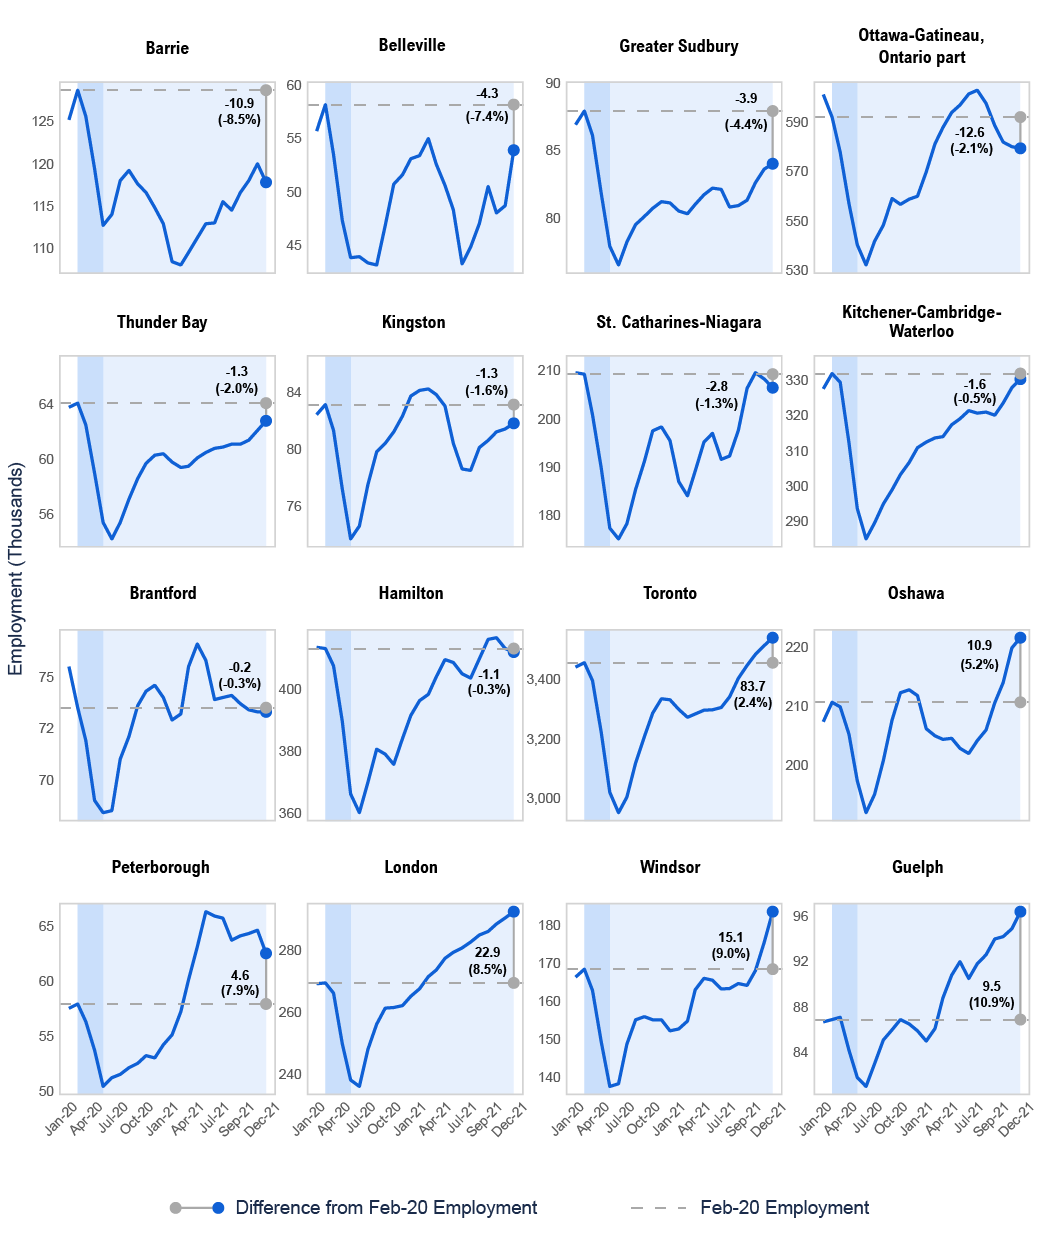
Note: Monthly figures for CMAs are three-month moving averages, seasonally adjusted.
Source: Statistics Canada and FAO.
Accessible version
| CMA | Month | 2020 (Thousands) | 2021 (Thousands) |
|---|---|---|---|
| Barrie, Ontario | |||
| Jan | 125.2 | 108.4 | |
| Feb | 128.7 | 108.0 | |
| Mar | 125.6 | 109.5 | |
| Apr | 119.4 | 111.2 | |
| May | 112.7 | 112.9 | |
| Jun | 114.0 | 113.0 | |
| Jul | 118.0 | 115.5 | |
| Aug | 119.2 | 114.5 | |
| Sep | 117.6 | 116.6 | |
| Oct | 116.6 | 118.0 | |
| Nov | 114.8 | 120.0 | |
| Dec | 112.9 | 117.8 | |
| Belleville, Ontario | |||
| Jan | 55.7 | 53.4 | |
| Feb | 58.2 | 55.0 | |
| Mar | 53.5 | 52.6 | |
| Apr | 47.3 | 50.6 | |
| May | 43.8 | 48.3 | |
| Jun | 43.9 | 43.2 | |
| Jul | 43.3 | 44.8 | |
| Aug | 43.1 | 47.0 | |
| Sep | 46.8 | 50.5 | |
| Oct | 50.7 | 48.0 | |
| Nov | 51.6 | 48.7 | |
| Dec | 53.1 | 53.9 | |
| Brantford, Ontario | |||
| Jan | 75.5 | 72.9 | |
| Feb | 73.5 | 73.2 | |
| Mar | 71.9 | 75.5 | |
| Apr | 69.0 | 76.6 | |
| May | 68.4 | 75.8 | |
| Jun | 68.5 | 73.9 | |
| Jul | 71.0 | 74.0 | |
| Aug | 72.1 | 74.1 | |
| Sep | 73.6 | 73.7 | |
| Oct | 74.3 | 73.4 | |
| Nov | 74.6 | 73.3 | |
| Dec | 74.0 | 73.3 | |
| Greater Sudbury, Ontario | |||
| Jan | 86.9 | 80.5 | |
| Feb | 87.9 | 80.3 | |
| Mar | 86.1 | 81.0 | |
| Apr | 81.8 | 81.7 | |
| May | 77.9 | 82.2 | |
| Jun | 76.5 | 82.1 | |
| Jul | 78.2 | 80.8 | |
| Aug | 79.5 | 80.9 | |
| Sep | 80.1 | 81.3 | |
| Oct | 80.7 | 82.6 | |
| Nov | 81.2 | 83.6 | |
| Dec | 81.1 | 84.0 | |
| Guelph, Ontario | |||
| Jan | 86.7 | 85.0 | |
| Feb | 86.9 | 86.1 | |
| Mar | 87.1 | 88.8 | |
| Apr | 84.2 | 90.8 | |
| May | 81.8 | 92.0 | |
| Jun | 81.0 | 90.5 | |
| Jul | 83.0 | 91.8 | |
| Aug | 85.1 | 92.6 | |
| Sep | 86.0 | 94.0 | |
| Oct | 86.9 | 94.2 | |
| Nov | 86.5 | 94.9 | |
| Dec | 85.9 | 96.4 | |
| Hamilton, Ontario | |||
| Jan | 413.7 | 396.4 | |
| Feb | 413.3 | 398.4 | |
| Mar | 407.7 | 404.1 | |
| Apr | 389.7 | 409.7 | |
| May | 366.1 | 408.8 | |
| Jun | 360.0 | 405.1 | |
| Jul | 369.9 | 403.7 | |
| Aug | 380.6 | 410.0 | |
| Sep | 379.0 | 416.3 | |
| Oct | 375.7 | 416.8 | |
| Nov | 384.1 | 413.3 | |
| Dec | 391.6 | 412.2 | |
| Kingston, Ontario | |||
| Jan | 82.4 | 84.1 | |
| Feb | 83.1 | 84.2 | |
| Mar | 81.3 | 83.8 | |
| Apr | 77.2 | 83.0 | |
| May | 73.7 | 80.4 | |
| Jun | 74.6 | 78.6 | |
| Jul | 77.5 | 78.5 | |
| Aug | 79.8 | 80.1 | |
| Sep | 80.4 | 80.6 | |
| Oct | 81.2 | 81.2 | |
| Nov | 82.3 | 81.4 | |
| Dec | 83.7 | 81.8 | |
| Kitchener-Cambridge-Waterloo, Ontario | |||
| Jan | 327.6 | 312.5 | |
| Feb | 331.9 | 313.7 | |
| Mar | 329.4 | 314.0 | |
| Apr | 312.3 | 317.4 | |
| May | 293.7 | 319.1 | |
| Jun | 285.1 | 321.4 | |
| Jul | 289.6 | 320.7 | |
| Aug | 295.0 | 321.0 | |
| Sep | 299.0 | 320.1 | |
| Oct | 303.3 | 323.5 | |
| Nov | 306.7 | 327.9 | |
| Dec | 310.9 | 330.3 | |
| London, Ontario | |||
| Jan | 269.1 | 267.5 | |
| Feb | 269.4 | 271.4 | |
| Mar | 266.1 | 273.5 | |
| Apr | 249.8 | 277.3 | |
| May | 238.2 | 279.2 | |
| Jun | 236.1 | 280.6 | |
| Jul | 248.0 | 282.5 | |
| Aug | 256.1 | 284.8 | |
| Sep | 261.3 | 285.9 | |
| Oct | 261.5 | 288.3 | |
| Nov | 262.1 | 290.3 | |
| Dec | 265.1 | 292.3 | |
| Oshawa, Ontario | |||
| Jan | 207.3 | 206.1 | |
| Feb | 210.6 | 204.9 | |
| Mar | 209.8 | 204.3 | |
| Apr | 205.2 | 204.5 | |
| May | 197.3 | 202.8 | |
| Jun | 191.9 | 201.9 | |
| Jul | 195.0 | 204.1 | |
| Aug | 200.7 | 205.9 | |
| Sep | 207.6 | 210.5 | |
| Oct | 212.2 | 213.9 | |
| Nov | 212.7 | 219.8 | |
| Dec | 211.7 | 221.5 | |
| Ottawa-Gatineau, Ontario part, Ontario/Quebec | |||
| Jan | 600.9 | 569.8 | |
| Feb | 591.9 | 581.1 | |
| Mar | 577.7 | 587.7 | |
| Apr | 557.0 | 593.7 | |
| May | 540.4 | 596.7 | |
| Jun | 532.2 | 601.2 | |
| Jul | 541.8 | 602.7 | |
| Aug | 548.3 | 597.4 | |
| Sep | 559.0 | 588.4 | |
| Oct | 556.7 | 581.8 | |
| Nov | 558.8 | 579.9 | |
| Dec | 559.9 | 579.3 | |
| Peterborough, Ontario | |||
| Jan | 57.5 | 55.1 | |
| Feb | 57.9 | 57.2 | |
| Mar | 56.3 | 60.1 | |
| Apr | 53.7 | 63.1 | |
| May | 50.4 | 66.3 | |
| Jun | 51.2 | 65.9 | |
| Jul | 51.5 | 65.7 | |
| Aug | 52.1 | 63.7 | |
| Sep | 52.5 | 64.1 | |
| Oct | 53.2 | 64.3 | |
| Nov | 53.0 | 64.6 | |
| Dec | 54.2 | 62.5 | |
| St. Catharines-Niagara, Ontario | |||
| Jan | 209.5 | 187.0 | |
| Feb | 209.2 | 184.1 | |
| Mar | 200.8 | 189.2 | |
| Apr | 189.8 | 195.2 | |
| May | 177.4 | 197.0 | |
| Jun | 175.2 | 191.6 | |
| Jul | 178.3 | 192.3 | |
| Aug | 185.4 | 197.6 | |
| Sep | 191.2 | 206.3 | |
| Oct | 197.5 | 209.5 | |
| Nov | 198.3 | 208.2 | |
| Dec | 195.5 | 206.4 | |
| Thunder Bay, Ontario | |||
| Jan | 63.8 | 59.8 | |
| Feb | 64.1 | 59.4 | |
| Mar | 62.5 | 59.5 | |
| Apr | 59.0 | 60.1 | |
| May | 55.4 | 60.5 | |
| Jun | 54.2 | 60.8 | |
| Jul | 55.4 | 60.9 | |
| Aug | 57.1 | 61.1 | |
| Sep | 58.6 | 61.1 | |
| Oct | 59.7 | 61.4 | |
| Nov | 60.3 | 62.1 | |
| Dec | 60.4 | 62.8 | |
| Toronto, Ontario | |||
| Jan | 3,440.8 | 3,299.0 | |
| Feb | 3,455.5 | 3,272.3 | |
| Mar | 3,395.1 | 3,283.4 | |
| Apr | 3,220.6 | 3,296.1 | |
| May | 3,020.1 | 3,297.3 | |
| Jun | 2,951.4 | 3,304.6 | |
| Jul | 3,003.6 | 3,341.0 | |
| Aug | 3,118.4 | 3,402.6 | |
| Sep | 3,206.6 | 3,446.7 | |
| Oct | 3,286.0 | 3,483.6 | |
| Nov | 3,334.2 | 3,513.1 | |
| Dec | 3,331.2 | 3,539.2 | |
| Windsor, Ontario | |||
| Jan | 166.3 | 152.7 | |
| Feb | 168.4 | 154.8 | |
| Mar | 162.8 | 163.0 | |
| Apr | 149.3 | 166.0 | |
| May | 137.6 | 165.5 | |
| Jun | 138.3 | 163.2 | |
| Jul | 148.7 | 163.3 | |
| Aug | 155.1 | 164.6 | |
| Sep | 155.9 | 164.1 | |
| Oct | 155.1 | 168.0 | |
| Nov | 155.1 | 175.4 | |
| Dec | 152.2 | 183.5 |
Footnotes
[1] See Appendix for monthly employment trends for various demographic groups, industries and major cities of Ontario.
[2] Based on the current Labour Force Survey (LFS) going back to 1976.
[3] See Youth employment rises strongly but remains below pre-pandemic level section below.
[4] In the fourth quarter of 2021, a greater proportion of Ontario businesses in wholesale and retail trade and transportation and warehousing industries had a somewhat to very optimistic business outlook over the next 12 months compared to accommodation and food services, according to Statistics Canada’s Canadian Survey on Business Conditions.
[5] Within health occupations in Ontario, the annual average employment in assisting occupations in support of health services such as dental assistant, laboratory assistant, nurse aides, orderlies and patient service associates, and pharmacy technical assistants, grew by 16 per cent in 2021, the fastest pace of annual growth compared to other health occupations.
[6] For details, see Labour Force Survey, September 2021.
[7] “Other services” includes repair and maintenance; personal and laundry services; religious, grant-making, civic and professional services; and private household services. For details, see North American Industry Classification System (NAICS) Canada 2017 Version 3.0.
[8] Employment also recovered above the pre-pandemic level in the forestry, fishing, mining, quarrying, oil and gas industry, which employs 0.5 per cent of Ontario workers.
[9] See Agriculture and agri-food labour statistics, 2020 and The Canadian Agriculture Industry: What Are the Impacts of and Lessons Learned from the COVID-19 Pandemic?
[10] Ontario cities included in this report are based on Statistics Canada’s Census Metropolitan Areas (CMAs). Statistics Canada defines a CMA as a large population centre together with adjacent fringe and rural areas that have a high degree of social and economic integration with the centres. A CMA must have a population of at least 100,000. CMA employment data is based on where employees live and not the location of their workplace.
[11] According to Statistics Canada, a landed immigrant is a person who has been granted the right to live in Canada permanently by immigration authorities. Canadian citizens by birth and non-permanent residents (persons from another country who live in Canada and have a work or study permit, or are claiming refugee status, as well as family members living here with them) are not landed immigrants.
[12] Recent immigrants refer to immigrants who landed in Canada 5 or less years earlier and those who landed more than 5 to 10 years earlier.
[13] Long-term immigrants refers to immigrants who landed in Canada more than 10 years earlier. This group represented nearly 70 per cent of the pre-pandemic total landed immigrant employment in Ontario.
[14] Earliest data available, not seasonally adjusted.
[15] See Ontario’s long-term unemployed individuals section in the Appendix and Canadian Labour Market Dynamics During COVID-19.
[16] Occupations were classified based on National Occupational Classification (NOC) matrix.
[17] See Labour Force Survey, December 2021.
[18] See Canadian Labour Market Dynamics During COVID-19. For a discussion on reskilling activities of displaced workers, see Fine tuning or re-skilling? Educational strategies of prime-aged displaced workers.
[19] According to indeed hiring lab, by mid-June 2021, job seekers with the most recent experience in the sector are looking for jobs in other sectors such as administrative assistance, marketing and installation and maintenance.
[20] See Job vacancies, third quarter 2021.
[21] Almost all (99 per cent) of the businesses in the accommodation and food services industry in Ontario are small business with less than 100 employees. See Canadian Business Counts, with employees, June 2021.