

Key Points
- In 2017, the Ontario provincial government received $10,415 in total revenue per person[1], the lowest in the country.
- Despite the lowest total revenue per person, Ontario’s per capita tax revenue is above the average of other provinces, owing to a strong economic base.[2]
- However, offsetting Ontario’s relatively high tax revenues are lower revenues from other sources. Compared to other provinces, Ontario generates a relatively modest level of resource revenues and receives a relatively low amount of transfers from the federal government.
- Ontario’s low per capita revenue is matched by similarly low government spending relative to other provinces. In 2017, Ontario spent $9,829 per person on programs, also the lowest among provinces.
- Ontario’s per capita program spending is more than $2,000 below the rest of Canada average, a gap that has widened since 2011.
- In particular, Ontario spends $3,903 per person on health care, the lowest in Canada and $487 per person lower than the rest of Canada average.
- Ontario’s net operating deficit was $3.8 billion in 2017[3], down from a deficit of $5.3 billion in 2016. On a per capita basis, Ontario’s deficit was $271 per person in 2017, below the average of other provinces.
- However, Ontario program spending is projected to jump by nearly 5 per cent in 2018 while overall revenues are expected to decline.[4] As a result, Ontario’s deficit is expected to more than triple to $868 per person in 2018, based on the FAO’s projections.
- Despite a relatively low per capita deficit in 2017, Ontario had the second highest debt load per person in Canada, behind only Newfoundland and Labrador. Going forward, larger deficits would further deteriorate Ontario’s fiscal position relative to other provinces.
- The Ontario government has announced its intention to balance the budget while committing to not raise taxes. Given that Ontario’s per capita program spending is already the lowest in Canada, opportunities to restrain or reduce spending further may be limited.
Overview
This commentary provides an updated comparison of Ontario government revenue, spending, deficit and net debt with that of other provinces based on Statistics Canada’s Government Finance Statistics.[5]
Ontario receives lowest total revenue per capita in Canada
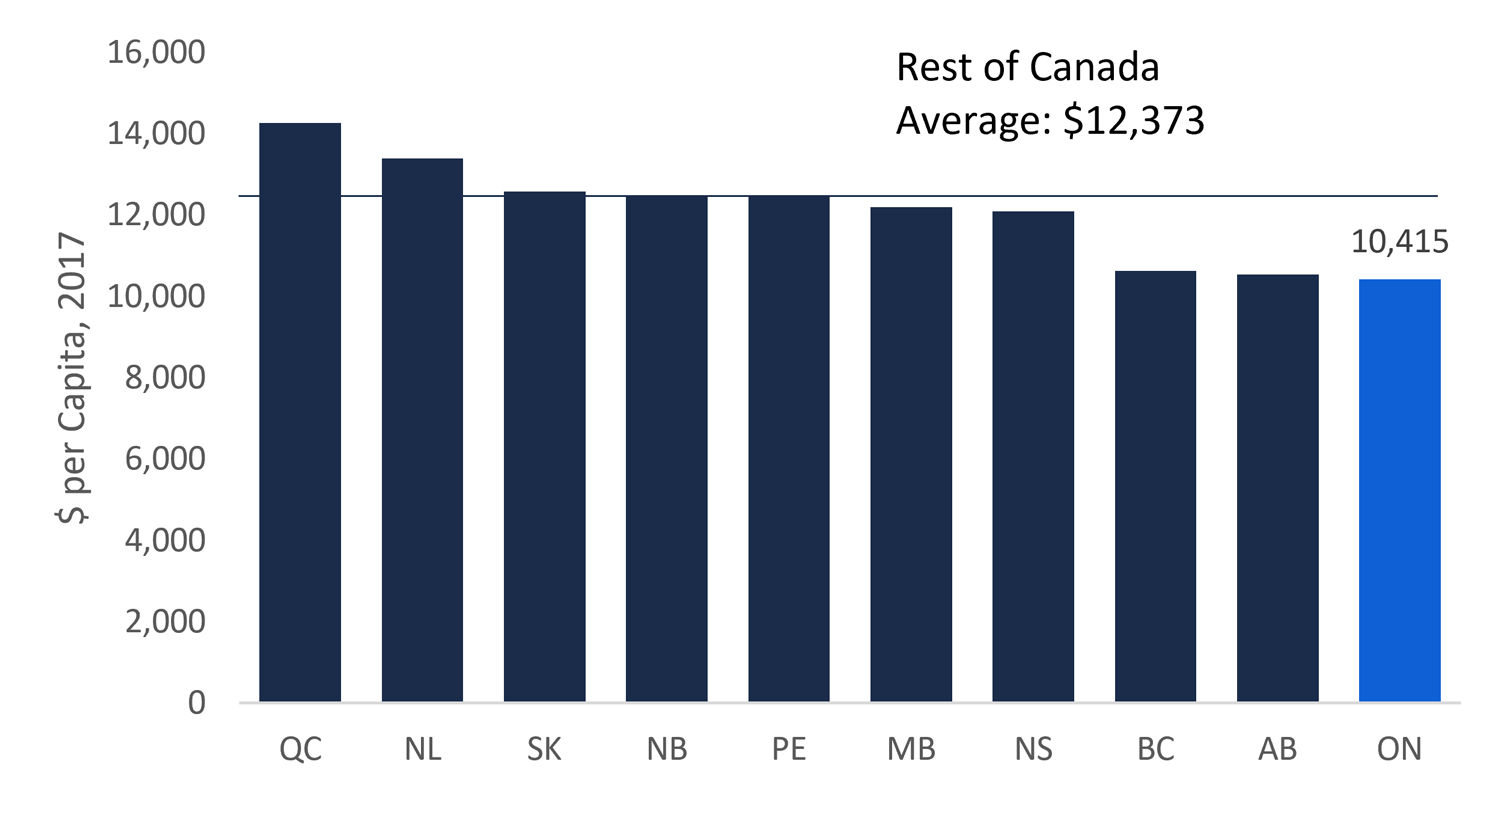
Canadian provinces receive revenue from taxation, resource royalties, transfers from the federal government and other sources including profits from government business enterprises and user fees. In 2017, these sources generated $10,415 in total revenue per person in Ontario, the lowest in Canada.
Figure 1 Ontario total revenue per capita lowest in Canada
Source: Statistics Canada and FAO.
Accessible version
This chart displays provincial total revenue per capita, ranked from highest to lowest. Quebec ranks highest at over $14,000 followed by Newfoundland and Labrador, Saskatchewan, New Brunswick, Prince Edward Island, Manitoba, Nova Scotia, British Columbia and Alberta. Ontario ranks last at $10,415 per capita. The Canadian average excluding Ontario is $12,373.
Tax revenue
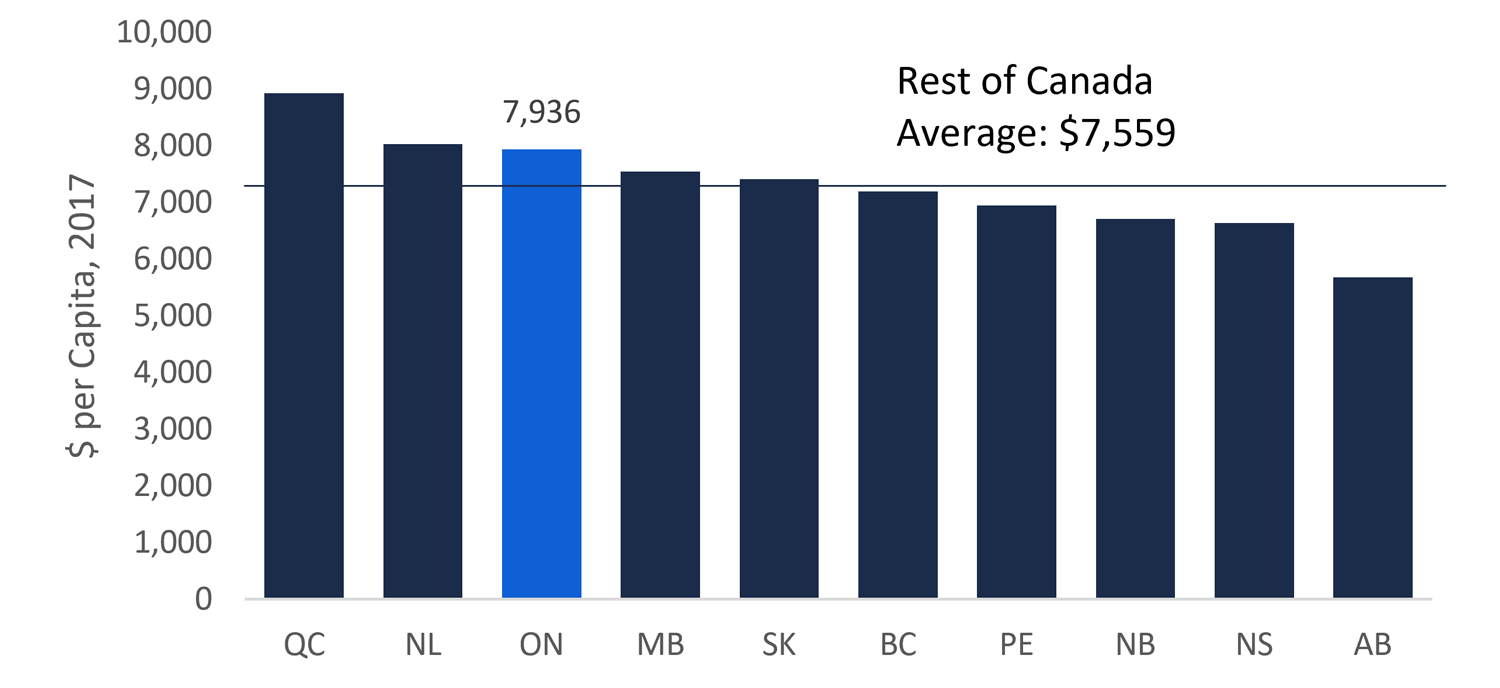
Despite receiving the lowest total revenue per capita in Canada, Ontario’s tax revenue is above the average of other provinces. In 2017-18, Ontario generated $7,936 in tax revenue per person, below that of only Quebec and Newfoundland and Labrador.
Figure 2 Ontario generated relatively high per capita tax revenues
Source: Statistics Canada and FAO.
Accessible version
This chart displays provincial taxation revenue per capita, ranked from highest to lowest. Quebec ranks highest at nearly $9,000 followed by Newfoundland and Labrador, Ontario at $7,936, Manitoba, Saskatchewan, British Columbia, Prince Edward Island, New Brunswick, Nova Scotia and finally Alberta. The Canadian average excluding Ontario is $7,559.
However, Ontario’s relatively higher per capita tax receipts are largely a reflection of the province’s stronger economic base — Ontario benefits from both a robust business sector and relatively prosperous households.
When Ontario’s tax revenues are compared to their economic bases, which account for the province’s stronger economy, Ontario’s relative tax burdens are generally lower than the rest of Canada (See Figure 3).
Ontario’s personal income tax revenue is equivalent to 9.9 per cent of labour income, significantly below the 11.7 per cent share in the rest of Canada. Similarly, corporate income tax revenue as a share of corporate profits is 11.8 per cent in Ontario, below the 12.2 per cent ratio in the rest of Canada. However, Ontario’s sales tax revenue is equal to 5.9 per cent of household spending, slightly above the rest of Canada average of 5.7 per cent.[6]
| Ontario | Rest of Canada | |
|---|---|---|
| Personal Income Tax (% of labour income) |
9.9 | 11.7 |
| Corporate Income Tax* (% of corporate profits) |
11.8 | 12.2 |
| Sales Tax (% of household spending) |
5.9 | 5.7 |
| Other Tax Revenue (% of GDP) |
4.1 | 4.2 |
Other revenue sources
Ontario’s relatively higher per capita tax revenue is offset by lower revenues from resource royalties, federal transfers as well as ‘other revenues’ when compared to other provinces.
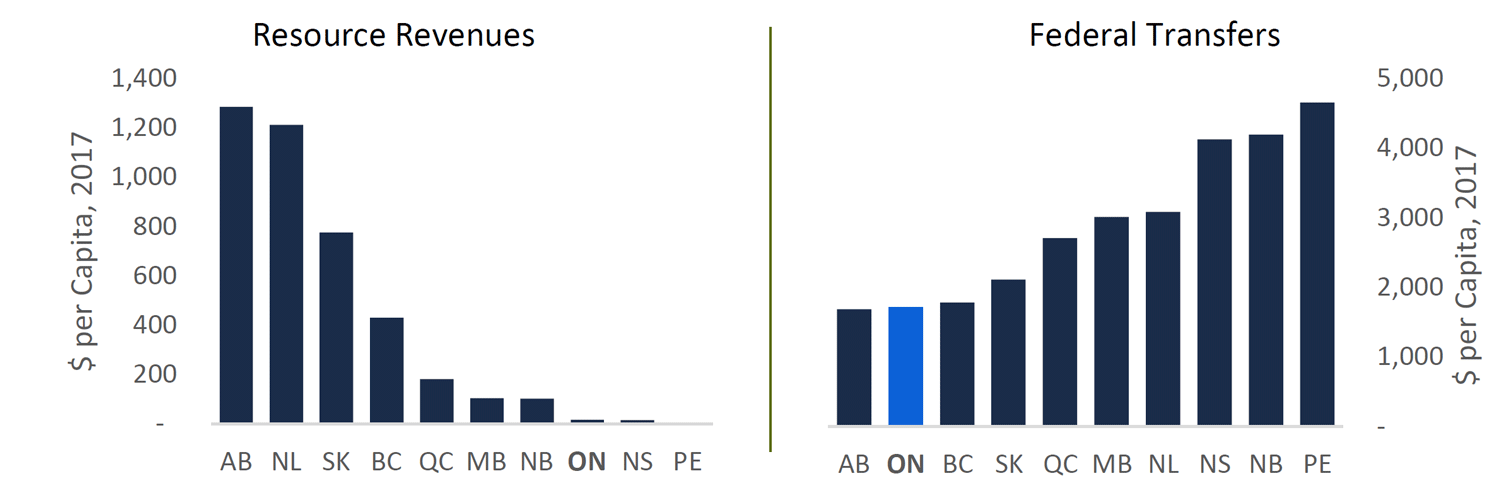
In Canada, provinces that generate high resource royalties, such as Alberta, Saskatchewan and British Columbia, typically receive lower federal transfers due to lower (or zero) payments from the Equalization program. At the same time, provinces that have lower resource royalties, such as Prince Edward Island, Nova Scotia and New Brunswick, typically receive higher federal transfers.
Figure 4 Ontario ranked close to bottom for resource royalties and federal transfers
Source: Statistics Canada, Canadian Government Finance Statistics.
Accessible version
This figure contains two charts. The first chart displays resource revenue per capita, ranked from highest to lowest. Alberta ranks first, followed by Newfoundland and Labrador, Saskatchewan, British Columbia, Quebec, Manitoba, New Brunswick, Ontario, Nova Scotia, and Prince Edward Island.
The next chart displays federal transfers per capita from lowest to highest. The lowest is Alberta, followed by Ontario, British Columbia, Saskatchewan, Quebec, Manitoba, Newfoundland and Labrador, Nova Scotia, New Brunswick and Prince Edward Island.
However, Ontario is unique among the provinces, with both relatively low resource revenues and federal transfers. Ontario’s strong tax bases limit the federal transfers it receives, most importantly from Equalization.[7] As a result, Ontario receives the second lowest per capita level of transfers from the federal government, while also generating the third lowest level of resource revenues per capita.
Ontario’s program spending lowest in Canada
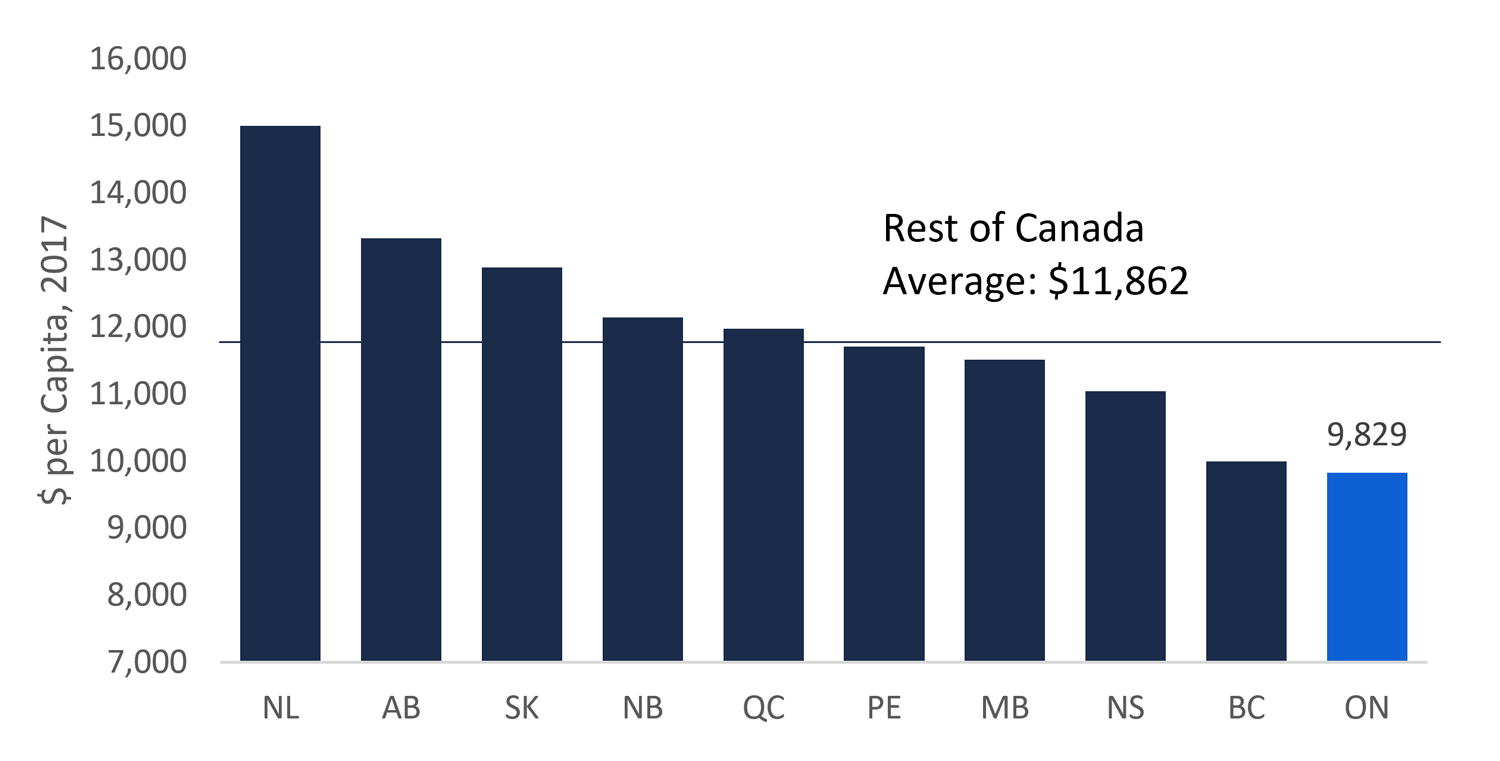
Ontario’s low per capita revenue is matched by a similarly low level of per capita spending. In 2017, Ontario program spending was the lowest in Canada.
Figure 5 Ontario program spending lowest among provinces
Source: Statistics Canada, Canadian Government Finance Statistics.
Accessible version
This chart displays program spending per capita, ranked from highest to lowest. Newfoundland and Labrador ranks highest at nearly $15,000 per capita, followed by Alberta, Saskatchewan, New Brunswick, Quebec, Prince Edward Island, Manitoba, Nova Scotia, British Columbia and Ontario at $9,829. The Canadian average excluding Ontario is $11,826.
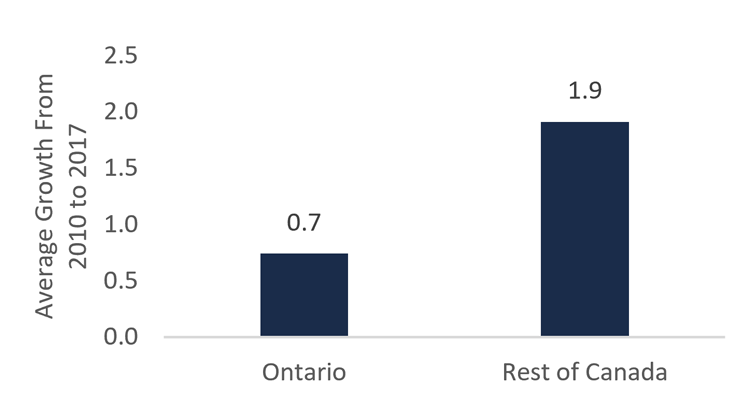
At $9,829, Ontario spends about $2,000 less per person on provincial programs than the average of other provinces.[8] Since 2011, Ontario program spending per capita has grown by 0.7 per cent per year on average – or by less than half the pace of growth in the rest of Canada.
Ontario program spending has grown at less than half the rate of other provinces
Source: FAO and Statistics Canada.
Note: Figures represents values for provincial governments.
Accessible version
This chart shows the growth in Ontario’s program spending compared to the rest of Canada. The first bar in the chart shows Ontario’s program spending growing at 0.7 per cent on average from 2010 to 2017. The second bar in the chart shows the rest of Canada growth rate of 1.9 per cent.
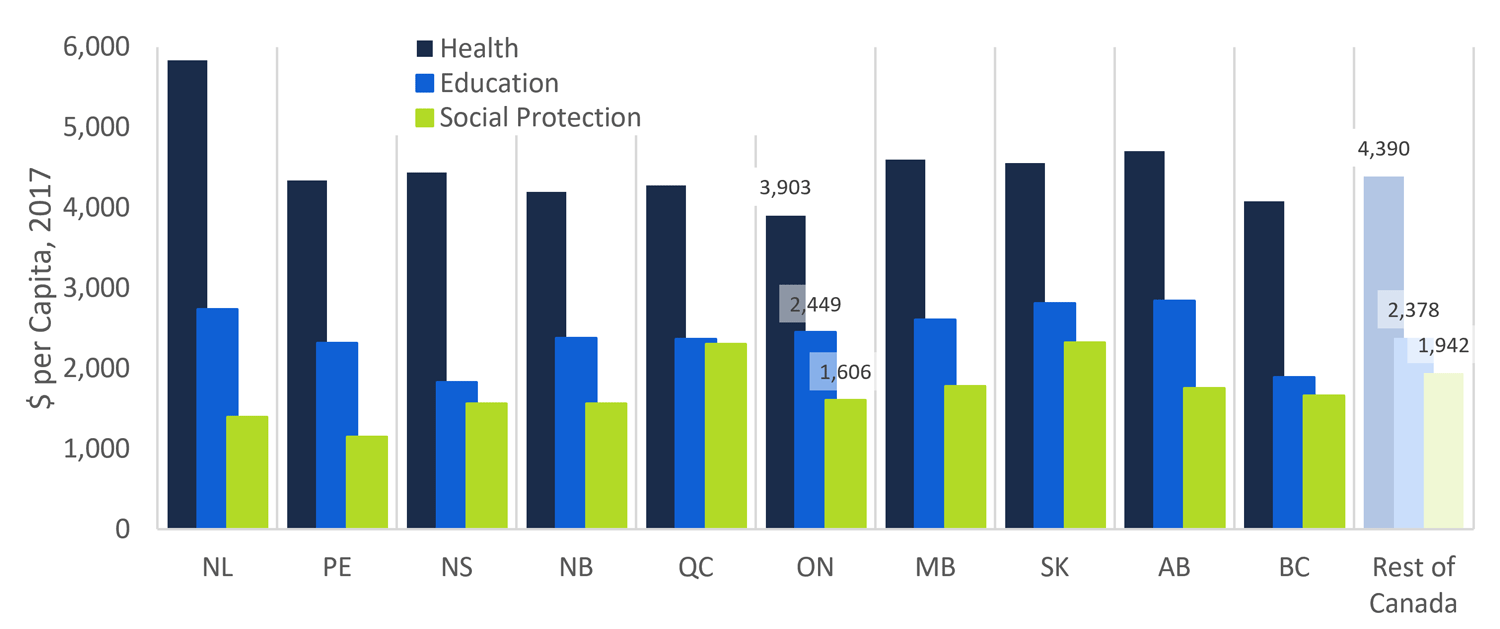
Ontario’s lower program spending per capita largely reflects the province’s relatively lower expenditures on health care and social protection.[9] Ontario spent $3,903 per person on health care in 2017 – lowest among provinces and about $490 below the average for other provinces. Similarly, Ontario spent $1,606 per capita on social protection, below the rest of Canada average of $1,942. For education, Ontario’s per capita spending was roughly in-line with average spending in the rest of Canada.
Figure 6 Ontario healthcare spending lowest in Canada
Source: Statistics Canada and FAO.
Accessible version
This chart compares Ontario’s spending on health, education and social protection with that of other provinces and the rest of Canada average. For health, Newfoundland and Labrador spends the highest at nearly $6,000 per capita and Ontario is the lowest at $3,903. The rest of Canada average for health is $4,390. For education, the highest spender is Alberta at nearly $3,000 per capita, while the lowest is Nova Scotia at just under $2,000 per capita. Ontario spends $2,449, slightly higher than the rest of Canada average of $2,378. For social protection, the highest spending province was Saskatchewan at around $2,300. The province that spent the least was Prince Edward Island. Ontario spent $1,606 per capita, below the rest of Canada average of $1,942.
Ontario’s relatively lower level of spending may be the result of a combination of factors, including lower need or demand for services[10], lower cost of delivering public services[11], or lower quality of services.
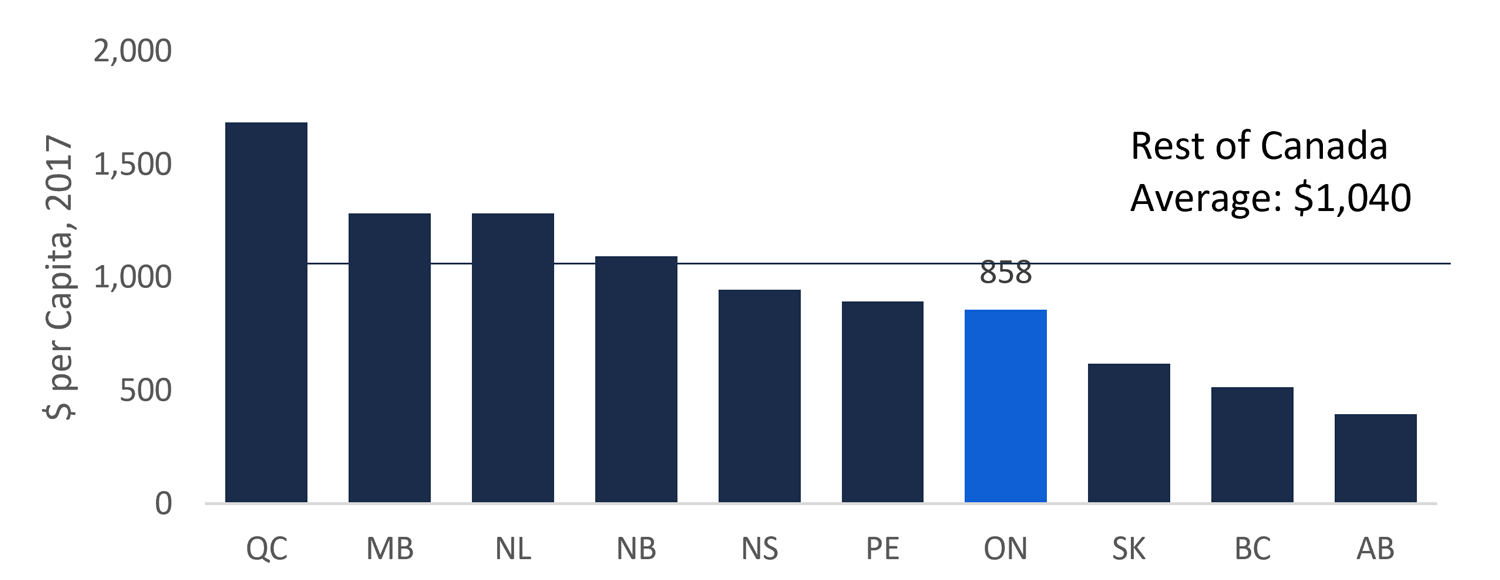
Ontario also compares favourably to other provinces on interest on debt spending, despite a relatively higher debt load. In 2017, the Province’s interest on debt spending per capita was $858, more than $180 below the rest of Canada average, primarily the result of lower borrowing rates.[12] However, Ontario’s debt is expected to continue rising over the outlook, leading to increases in Ontario’s debt payments going forward.
Figure 7 Interest on debt spending in Ontario lower than most provinces
Source: Statistics Canada, Canadian Government Finance Statistics and FAO.
Accessible version
This chart displays interest on debt per capita, ranked from highest to lowest. Quebec ranks highest at nearly $1,700 per capita, followed by Manitoba, Newfoundland and Labrador, New Brunswick, Nova Scotia, Prince Edward Island, Ontario at $858, Saskatchewan, British Columbia and Alberta. The Canadian average excluding Ontario is $1,040.
Comparing Ontario’s operating deficit and debt burden
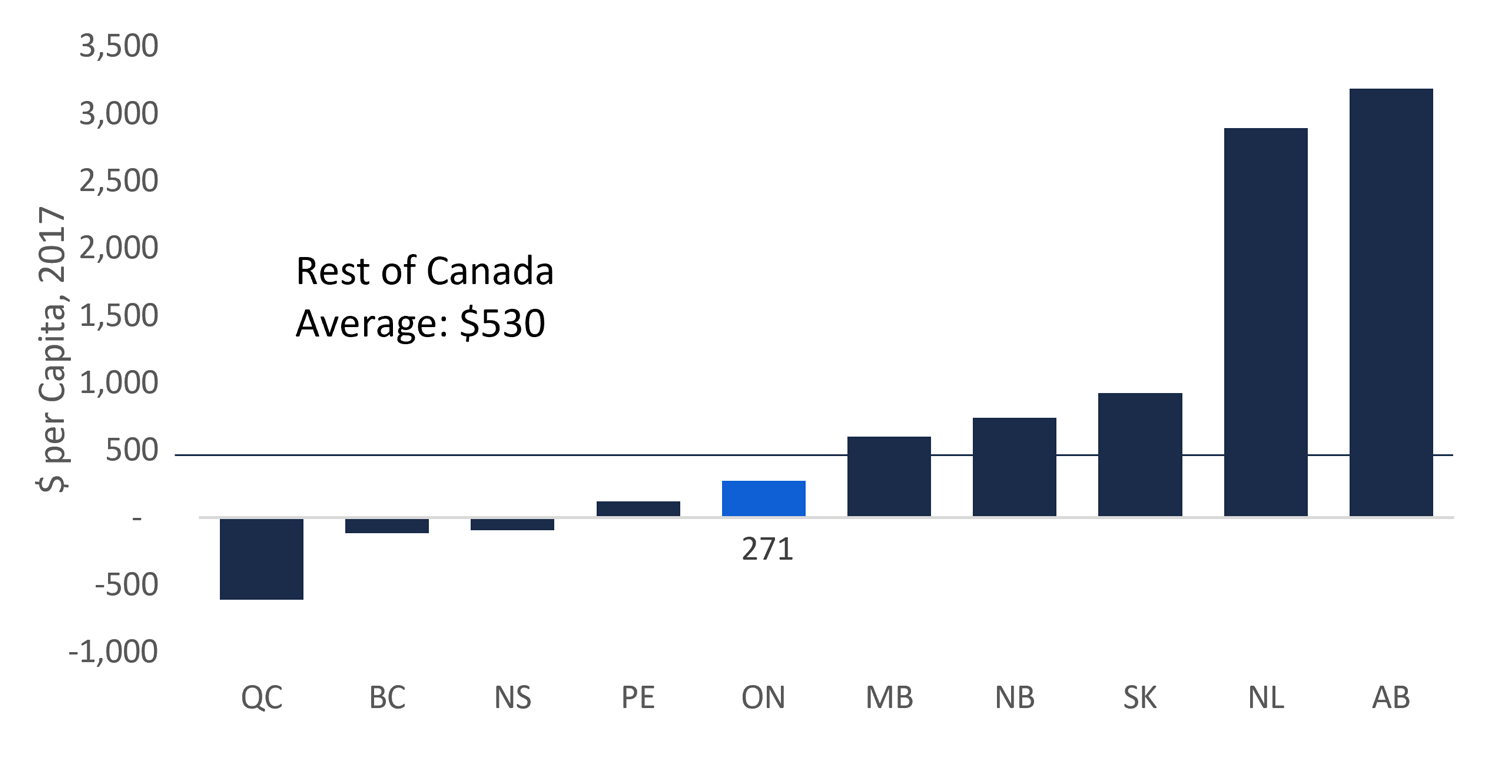
Ontario’s net operating deficit was $3.8 billion in 2017,[13] down from a deficit of $5.3 billion in 2016. On a per capita basis, Ontario’s deficit amounted to $271 per person in 2017, below the provincial average of $530. However, Ontario’s deficit is projected to more than triple to $868 per person in 2018, due to a sharp increase in spending and a decline in overall revenue.
Figure 8 Ontario’s operating deficit below provincial average
Source: Statistics Canada, Canadian Government Finance Statistics
Accessible version
This chart displays deficit per capita, ranked from lowest to highest. Quebec ranks lowest with a surplus of $500 per capita, followed by British Columbia, Nova Scotia, Prince Edward Island, Ontario at $271, Manitoba, New Brunswick, Saskatchewan, Newfoundland and Labrador and Alberta. The Canadian average excluding Ontario is $530.
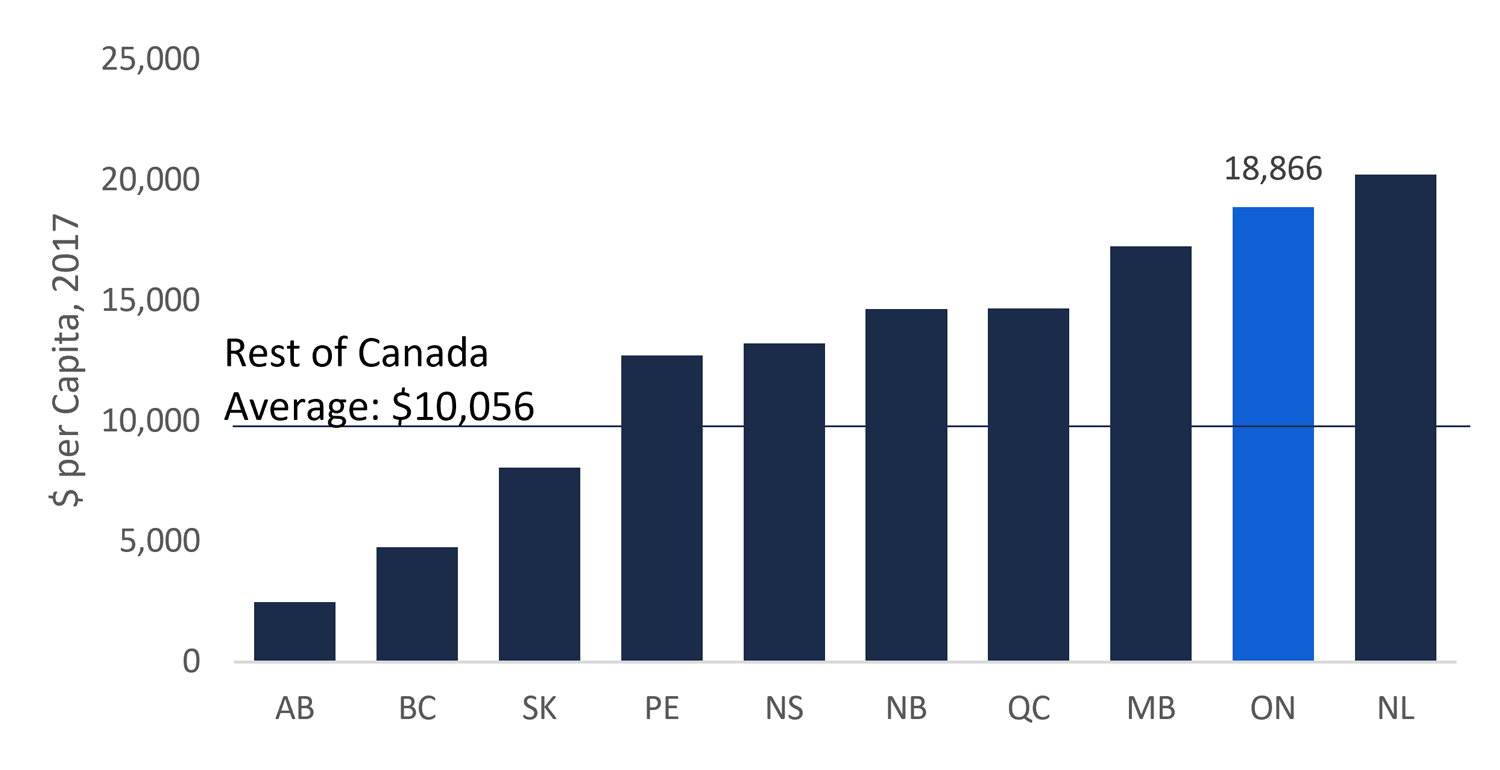
Despite a relatively modest per capita deficit last year, Ontario’s per capita debt was $18,866 in 2017[14], the second highest in Canada – behind only Newfoundland and Labrador.[15] On-going deficits will further add to this debt load over the outlook.
Figure 9 Ontario had second highest net financial debt per capita
Source: Statistics Canada, Canadian Government Finance Statistics and FAO
Accessible version
This chart displays net financial debt per capita, ranked from lowest to highest. Alberta is the lowest at about $2,500, followed by British Columbia, Saskatchewan, Prince Edward Island, Nova Scotia, New Brunswick, Quebec, Manitoba, Ontario at $18,866 and Newfoundland and Labrador. The Canadian average excluding Ontario is $10,056.
The Ontario government has committed to balancing the budget over a “reasonable and pragmatic” timeframe while not raising taxes.[16] Given these commitments, the burden of eliminating the deficit falls mainly on reducing program spending. However, since Ontario’s program spending is already the lowest in Canada, opportunities for achieving additional spending restraint or reductions may be limited.
Appendix
| NL | PE | NS | NB | QC | ON | MB | SK | AB | BC | Canada-Wide Avg. | Rest of Canada Avg. | |
|---|---|---|---|---|---|---|---|---|---|---|---|---|
| Net Financial Debt | -20,211 | -12,696 | -13,208 | -14,634 | -14,645 | -18,866 | -17,224 | -8,047 | -2,475 | -4,756 | -13,474 | -10,056 |
| Net Operating Balance | -2,891 | -118 | 96 | -740 | 610 | -271 | -599 | -922 | -3,187 | 115 | -430 | -530 |
| Total Revenue | 13,386 | 12,479 | 12,086 | 12,495 | 14,270 | 10,415 | 12,192 | 12,584 | 10,534 | 10,624 | 11,613 | 12,373 |
| Taxes | 8,027 | 6,940 | 6,632 | 6,703 | 8,925 | 7,936 | 7,539 | 7,404 | 5,671 | 7,190 | 7,706 | 7,559 |
| Grants | 3,080 | 4,651 | 4,122 | 4,190 | 2,704 | 1,718 | 3,008 | 2,114 | 1,688 | 1,780 | 2,155 | 2,431 |
| Social Contributions | 314 | 86 | 345 | 328 | 568 | 343 | 182 | 236 | 167 | 321 | 360 | 371 |
| Other Revenue (Including Royalties) | 1,965 | 803 | 987 | 1,274 | 2,073 | 418 | 1,463 | 2,829 | 3,007 | 1,334 | 1,393 | 2,011 |
| Program Expense | 14,996 | 11,702 | 11,043 | 12,142 | 11,975 | 9,829 | 11,508 | 12,888 | 13,325 | 9,995 | 11,073 | 11,862 |
| Health | 5,834 | 4,342 | 4,439 | 4,194 | 4,274 | 3,903 | 4,601 | 4,554 | 4,703 | 4,078 | 4,201 | 4,390 |
| Education | 2,738 | 2,315 | 1,830 | 2,375 | 2,363 | 2,449 | 2,609 | 2,813 | 2,843 | 1,891 | 2,406 | 2,378 |
| Social Protection | 1,394 | 1,151 | 1,560 | 1,565 | 2,302 | 1,606 | 1,776 | 2,321 | 1,751 | 1,658 | 1,812 | 1,942 |
| Other | 5,030 | 3,894 | 3,214 | 4,008 | 3,035 | 1,871 | 2,523 | 3,201 | 4,028 | 2,368 | 2,656 | 3,153 |
| Interest Expense | 1,282 | 895 | 946 | 1,093 | 1,685 | 858 | 1,282 | 618 | 395 | 514 | 969 | 1,040 |
| NL | PE | NS | NB | QC | ON | MB | SK | AB | BC | Canada-Wide Avg. | Rest of Canada Avg. | |
|---|---|---|---|---|---|---|---|---|---|---|---|---|
| Net Financial Debt | -32.3 | -29.0 | -29.5 | -30.8 | -29.5 | -32.4 | -32.5 | -11.8 | -3.2 | -8.1 | -23.2 | -17.3 |
| Net Operating Balance | -4.6 | -0.3 | 0.2 | -1.6 | 1.2 | -0.5 | -1.1 | -1.3 | -4.1 | 0.2 | -0.7 | -0.9 |
| Total Revenue | 21.4 | 28.5 | 27.0 | 26.3 | 28.7 | 17.9 | 23.0 | 18.4 | 13.6 | 18.1 | 20.0 | 21.3 |
| Taxes* | 12.8 | 15.9 | 14.8 | 14.1 | 18.0 | 13.6 | 14.2 | 10.8 | 7.3 | 12.3 | 13.3* | 13.0* |
| Grants | 4.9 | 10.6 | 9.2 | 8.8 | 5.4 | 3.0 | 5.7 | 3.1 | 2.2 | 3.0 | 3.7 | 4.2 |
| Social Contributions | 0.5 | 0.2 | 0.8 | 0.7 | 1.1 | 0.6 | 0.3 | 0.3 | 0.2 | 0.5 | 0.6 | 0.6 |
| Other Revenue (Including Royalties) | 3.1 | 1.8 | 2.2 | 2.7 | 4.2 | 0.7 | 2.8 | 4.1 | 3.9 | 2.3 | 2.4 | 3.5 |
| Program Expense | 24.0 | 26.7 | 24.7 | 25.6 | 24.1 | 16.9 | 21.7 | 18.9 | 17.2 | 17.1 | 19.1 | 20.4 |
| Health | 9.3 | 9.9 | 9.9 | 8.8 | 8.6 | 6.7 | 8.7 | 6.7 | 6.1 | 7.0 | 7.2 | 7.6 |
| Education | 4.4 | 5.3 | 4.1 | 5.0 | 4.8 | 4.2 | 4.9 | 4.1 | 3.7 | 3.2 | 4.1 | 4.1 |
| Social Protection | 2.2 | 2.6 | 3.5 | 3.3 | 4.6 | 2.8 | 3.3 | 3.4 | 2.3 | 2.8 | 3.1 | 3.3 |
| Other | 8.0 | 8.9 | 7.2 | 8.4 | 6.1 | 3.2 | 4.8 | 4.7 | 5.2 | 4.0 | 4.6 | 5.4 |
| Interest Expense | 2.0 | 2.0 | 2.1 | 2.3 | 3.4 | 1.5 | 2.4 | 0.9 | 0.5 | 0.9 | 1.7 | 1.8 |
Footnotes
[1] Government financial information presented in this commentary are based on Statistics Canada’s ‘Government Finance Statistics’. The most recent data available are for fiscal year 2017-18, referred to as ‘2017’ in this note.
[2] When Ontario’s tax revenues are compared to their economic bases, which accounts for the province’s stronger economy, Ontario’s relative tax burdens are generally lower than the rest of Canada.
[3] In comparison, the Province recorded a deficit of $3.7 billion for 2017-18 in the 2017-18 Public Accounts, based on Canadian Public Sector Accounting Standards.
[4] ‘Economic and Budget Outlook, Fall 2018’, Financial Accountability Office of Ontario and ‘Ontario Economic Outlook and Fiscal Review’, 2018, Ontario Ministry of Finance
[5] Statistics Canada’s Government Finance Statistics provide comparable fiscal statistics across provinces by adjusting for differences in organizational structure and accounting practices between governments. To better align with the scope of Ontario’s public accounts, the FAO excluded data for local governments in this analysis and has made additional adjustments to provincial revenue and education expense to include school boards’ property tax revenue (such as the Education Property Tax in Ontario). Importantly, even without these adjustments the provincial rankings remain largely similar to those presented in this commentary: Ontario receives the third lowest total revenue per capita and spends the second lowest per capita amount on programs.
[6] Alberta is excluded from the rest of Canada ratio. If Alberta, with no sales tax, is included, the rest of Canada average falls to 4.5 per cent.
[7] Ontario also receives less than its per capita share from labour market agreements, infrastructure transfers, and social housing transfers from the federal government.
[8] This value represents spending by the Ontario provincial government. If local governments’ spending were also included, Ontario’s program spending would still be the second lowest in Canada, and $1,259 per capita below the rest of Canada average.
[9] Statistics Canada’s social protection category includes expenses for housing, old age, unemployment, sickness and disability, and children services.
[10] For example, Ontario’s relatively younger population may require less health care resources than other provinces. Similarly, Ontario’s relatively strong labour market may require comparatively less resources for social services.
[11] As a large province, Ontario benefits from efficiencies generated by economies of scale, which would be expected to reduce Ontario’s administration costs relative to other provinces. Examples of efficiencies include the ability to buy in larger volumes, achieve lower interest costs, as well as benefiting from greater public sector specialization.
[12] See “Update on Ontario’s Credit Rating”, Financial Accountability Office of Ontario, 2018.
[13] In comparison, the Province recorded a deficit of $3.7 billion for 2017-18, as reported in Ontario’s 2017-18 Public Accounts, consistent with Canadian Public Sector Accounting Standards.
[14] Based on Statistics Canada data, Ontario had $268 billion in net financial debt in 2017. In the 2017-18 Public Accounts, Ontario reported net debt of $323.8 billion, consistent with Canadian Public Sector Accounting Standards. Statistics Canada’s data (Government Finance Statistics) are based on a different consolidation of public sector organizations.
[15] Similarly, Ontario’s net financial debt to GDP ratio was also second highest in Canada at 32.4 per cent in 2017, behind only Manitoba at 32.5 per cent.
[16] See pages 5 and 18 of the 2018 Economic Outlook and Fiscal Review.