


Highlights
- This report provides information on spending by the Government of Ontario (the Province) through the first two quarters of the 2022-23 fiscal year (April 1, 2022 to September 30, 2022).
- The information in this report is based on the FAO’s analysis of transactions recorded in the Province’s financial accounting system as of September 30, 2022. All figures are unaudited, as final audited figures are not available until the release of the Public Accounts of Ontario after the end of the fiscal year.
2022-23 Spending Plan
- The Province’s yearly spending plan represents the legal spending authority for ministries as granted by the Legislature through the process of supply.[1] The Province started the 2022-23 fiscal year with a spending plan of $193.0 billion.[2]
Changes to the 2022-23 Spending Plan
- The Province may change its spending plan throughout the year, either by requesting additional spending authority from the Legislature or by reallocating spending among different programs through Treasury Board Orders.
- Overall, as of the end of the second quarter, there was no change to the Province’s total 2022-23 spending plan. However, by sector, the education spending plan increased by $371 million, followed by ‘other programs’ ($13 million), justice ($2 million) and children’s and social services ($1 million). This was offset by a $14 million reduction in the health sector spending plan and a $373 million transfer from the Contingency Fund.
- In the education sector, the $371 million increase was for the Catch Up Payments program, which provides a one-time payment to parents of $200 or $250 per child enrolled in kindergarten to Grade 12.
First and Second Quarter Spending: Actual Unaudited Spending vs. Expected Spending[3]
- In order to manage and monitor its program spending during the fiscal year, the Province divides its spending plan into expected spending by quarter, which reflects historical spending patterns, seasonality and other factors. For 2022-23, the Province expects to spend $40.7 billion in the first quarter, $43.3 billion in the second quarter, $45.0 billion in the third quarter, and $64.1 billion in the fourth quarter.
- Although the Province expected to spend $40.7 billion and $43.3 billion, respectively, in the first and second quarters of 2022-23, actual unaudited spending was $39.9 billion and $40.6 billion. In total, this was $3.5 billion (4.1 per cent) less than expected.
- All sectors spent less than expected, led by ‘other programs’ (-$1,748 million), health (-$859 million), education (-$413 million), children’s and social services (-$244 million), postsecondary education (-$99 million), justice (-$59 million) and interest on debt (‑$28 million).
- Programs with the largest lower-than-expected spending include Metrolinx and municipal infrastructure projects (-$887 million), electricity subsidy programs (-$591 million), Metrolinx and municipal transit operating funding (-$565 million), public health (-$502 million), elementary and secondary education programs (-$304 million) and Ministry of Infrastructure capital programs (‑$304 million).
- For information on spending by all of the Province’s programs and ministries, visit the FAO’s website at: https://tinyurl.com/yc7rn4nz.
First and Second Quarter Spending: 2022-23 Spending vs. 2021-22 Spending
- This report also compares spending in the current fiscal year against spending in the previous fiscal year to provide context for provincial spending trends and to identify significant year-over-year spending changes.
- Spending through the first half of 2022-23 was $3.6 billion (4.7 per cent) higher than during the same period in 2021-22.
- All sectors spent more in the first half of 2022-23 compared to the first half of 2021-22. The largest year-over-year spending increase was in health ($1,014 million), followed by education ($879 million), other programs ($590 million), interest on debt ($518 million), children’s and social services ($415 million), postsecondary education ($150 million) and justice ($18 million).
- Programs with the largest year-over-year spending increases include child care ($542 million), payments to physicians ($408 million), drug programs ($341 million), the operation of hospitals ($323 million), the operation of long-term care homes ($252 million), and the autism program ($167 million).
Unallocated Funds
- Unallocated funds are used to address spending pressures or fund program changes during the fiscal year. Unallocated funds cannot be spent directly by the Province but must be transferred to government programs through Treasury Board Orders.
- The Province started the 2022-23 fiscal year with a total of $4.6 billion in unallocated funds in the Contingency Fund. In the second quarter, the Province transferred $373 million from the Contingency Fund to the Ministry of Education ($371 million) and Cabinet Office ($1 million). This results in a remaining balance in the Contingency Fund, as of September 30, of $4.2 billion.[4]
Introduction
This report provides information on spending by the Government of Ontario (the Province) through the first two quarters of the 2022-23 fiscal year, from April 1, 2022 to September 30, 2022. The report:
- identifies changes made to the Province’s 2022-23 spending plan;
- reviews actual unaudited spending in the first and second quarters of 2022-23 against both the Province’s spending plan and actual spending during the same period of 2021-22; and
- tracks transfers from the Province’s unallocated funds.
The information in this report is based on the FAO’s analysis of transactions recorded in the Province’s Integrated Financial Information System (IFIS) as of September 30, 2022. All figures are unaudited, as final audited figures are not available until the release of the Public Accounts of Ontario after the end of the fiscal year.
2022-23 Spending Plan
The Province’s yearly spending plan represents the legal spending authority for ministries as granted by the Legislature through the process of supply.[5] The Province started the 2022-23 fiscal year with a spending plan of $193.0 billion.[6]
Changes to the 2022-23 Spending Plan
The Province may change its spending plan throughout the year, either by requesting additional spending authority from the Legislature or by reallocating spending among different programs through Treasury Board Orders. As of the end of the second quarter, September 30, 2022, the Province had made internal budget reallocations that transferred $373 million from the Contingency Fund and $382 million from the Ministry of Health’s Clinical Education program to various programs.
Overall, there was no change to the Province’s total 2022-23 spending plan. However, by sector, the education spending plan increased by $371 million, followed by ‘other programs’ ($13 million), justice ($2 million) and children’s and social services ($1 million). This was offset by a $14 million reduction in the health sector spending plan and a $373 million transfer from the Contingency Fund.
| Sector | 2022-23 Spending Plan | Q1 Changes | Q2 Changes | Revised 2022-23 Spending Plan |
|---|---|---|---|---|
| Health | 75,643 | - | -14 | 75,629 |
| Education | 34,748 | - | 371 | 35,120 |
| Postsecondary Education | 7,061 | - | - | 7,061 |
| Children's and Social Services | 18,562 | - | 1 | 18,563 |
| Justice | 5,781 | - | 2 | 5,782 |
| Other Programs | 33,658 | - | 13 | 33,671 |
| Unallocated Funds: | ||||
| Contingency Fund | 4,550 | - | -373 | 4,177 |
| Interest on Debt | 12,988 | - | - | 12,988 |
| Total | 192,992 | 0 | 0 | 192,992 |
Second Quarter Analysis
This section highlights key second quarter spending plan changes by sector and vote-item. For information on all of the Province’s transfer payment programs and ministries, visit the FAO’s website at: https://tinyurl.com/yc7rn4nz.
Health: $14 million decrease. Notable changes include:
- $289 million increase for Health Services (Vote-Item 1416-1), with the largest increases to the Operation of Hospitals ($230 million) and Home Care ($55 million).
- $44 million increase for Long-Term Care Homes Program (Operating) (Vote-Item 4502-1).
- $382 million decrease for Health Policy and Research (Vote-Item 1402-1) from the Clinical Education program, which was largely reallocated to other health sector programs.
Education: $371 million increase for Elementary and Secondary Education Program – Policy and Program Delivery (Vote-Item 1002-1) for the Catch Up Payments program, which provides a one-time payment to parents of $200 or $250 per child enrolled in kindergarten to Grade 12.
Actual Unaudited Spending to Date
Actual Unaudited Spending vs. Expected Spending[7]
In order to manage and monitor its program spending during the fiscal year, the Province divides its spending plan into expected spending by quarter, which reflects historical spending patterns, seasonality and other factors. For 2022-23, the Province expects to spend $40.7 billion in the first quarter, $43.3 billion in the second quarter, $45.0 billion in the third quarter, and $64.1 billion in the fourth quarter.[8]
Although the Province expected to spend $40.7 billion and $43.3 billion, respectively, in the first and second quarters of 2022-23, actual unaudited spending was $39.9 billion and $40.6 billion. In total, this was $3.5 billion (4.1 per cent) less than expected.
Figure 1 2022-23 actual unaudited spending vs. expected spending, by quarter, $ millions
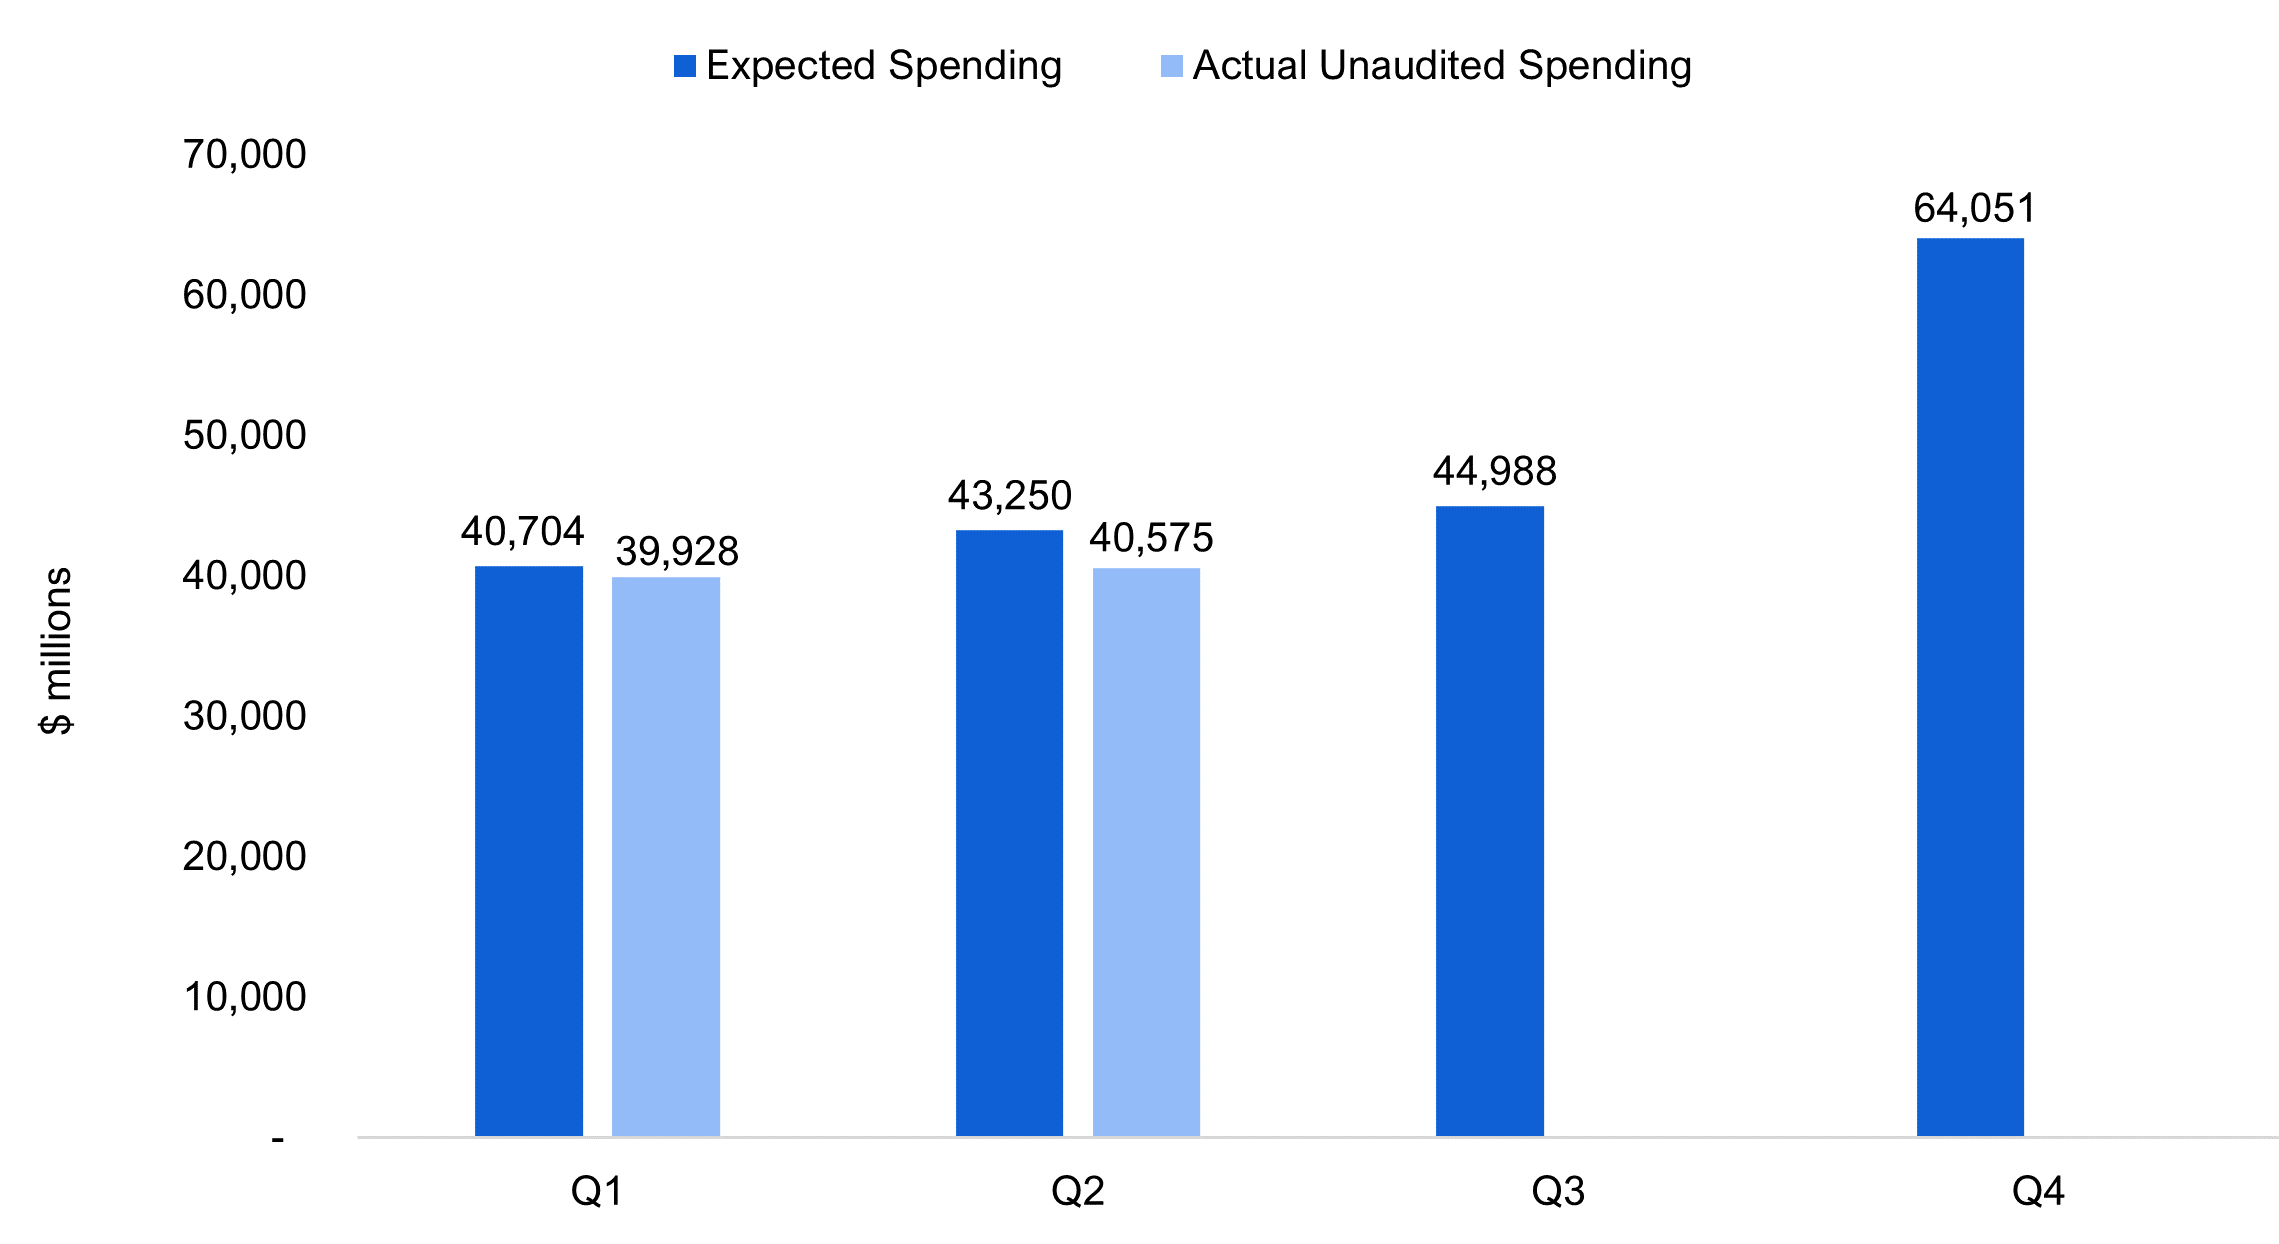
Note: Figures exclude spending on some assets and additional spending by the broader public sector organizations controlled by the Province (hospitals, school boards and colleges), the Province’s agencies and the legislative offices. Expected spending has been adjusted to reflect second quarter changes to the spending plan. Fourth quarter expected spending is significantly higher than expected spending in each of the first three quarters due to year-end accrual adjustments.
Source: FAO analysis of information provided by Treasury Board Secretariat.
Accessible Version
| Q1 | Q2 | Q3 | Q4 | |
|---|---|---|---|---|
| Expected Spending | 40,704 | 43,250 | 44,988 | 64,051 |
| Actual Unaudited Spending | 39,928 | 40,575 | - | - |
As of September 30, all sectors spent less than expected. By sector, lower-than-expected spending was led by ‘other programs’ (-$1,748 million), health (-$859 million), education (-$413 million), children’s and social services (-$244 million), postsecondary education (-$99 million), justice (-$59 million) and interest on debt (‑$28 million).
| Sector | Revised 2022-23 Spending Plan | Expected Spending at end of Q2 | Actual Spending at end of Q2 | Actual vs. Expected at end of Q2 | Actual vs. Expected (%) |
|---|---|---|---|---|---|
| Health | 75,629 | 35,932 | 35,073 | -859 | -2.4% |
| Education | 35,120 | 12,457 | 12,044 | -413 | -3.3% |
| Postsecondary Education | 7,061 | 3,349 | 3,250 | -99 | -3.0% |
| Children's and Social Services | 18,563 | 9,152 | 8,908 | -244 | -2.7% |
| Justice | 5,782 | 2,675 | 2,616 | -59 | -2.2% |
| Other Programs | 33,671 | 14,027 | 12,279 | -1,748 | -12.5% |
| Unallocated Funds: | |||||
| Contingency Fund | 4,177 | - | - | - | N/A |
| Interest on Debt | 12,988 | 6,361 | 6,334 | -28 | -0.4% |
| Total | 192,992 | 83,953 | 80,503 | -3,450 | -4.1% |
The rest of this section highlights key vote-item spending that was above and below expectations in the first two quarters of 2022-23. For information on spending by all of the Province’s programs and ministries, visit the FAO’s website at: https://tinyurl.com/yc7rn4nz.
Health sector spending: $859 million (2.4 per cent) less than expected. Highlights include:
- $134 million higher than expected in Health Services and Programs – Programs and Administration (Vote-Item 1416-2), which funds Cancer Treatment and Renal Services, Digital Health, Regional Coordination Operations Support, and other services.
- $138 million less than expected in Provincial Programs (Vote-Item 1412-1), which funds Community and Priority Services, Canadian Blood Services, and other specialized services.
- $158 million less than expected in Long-Term Care Homes Program (Operating) (Vote-Item 4502-1), which funds the operation and development of long-term care homes.
- $165 million less than expected in Health Capital Program (Vote-Item 1407-1), which provides capital funding to hospitals and other health care facilities.
- $502 million less than expected in Population and Public Health (Vote-Item 1406-4), which is mainly driven by lower-than-expected spending for the COVID-19 Response program. Through the first six months of the fiscal year, the Province has spent 11 per cent of the COVID-19 Response program’s $1.7 billion budget.
Education sector spending: $413 million (3.3 per cent) less than expected. Highlights include:
- $95 million less than expected in Child Care and Early Years Programs – Policy Development and Program Delivery (Vote-Item 1004-1), which includes the Province’s commitment to provide an average of $10-a-day child care by 2025.[9]
- $304 million less than expected in Elementary and Secondary Education Program – Policy and Program Delivery (Vote-Item 1002-1), which mainly funds school boards.
Postsecondary education sector spending: $99 million (3.0 per cent) less than expected. Highlights include:
- $95 million less than expected in Colleges, Universities and Student Support (Vote-Item 3002-1), which provides operating grants for colleges and universities, and financial aid for students.
Children’s and social services sector spending: $244 million (2.7 per cent) less than expected. Highlights include:
- $190 million less than expected in Financial and Employment Supports (Vote-Item 702-3), which includes the Ontario Disability Support Program, Ontario Works and the Ontario Drug Benefit Plan.
Justice sector spending: $59 million (2.2 per cent) less than expected. Highlights include:
- $98 million less than expected in Emergency Services Telecommunications (Vote-Item 2614-1), mainly due to no spending in the $80 million Next Generation 9-1-1 program through the first six months of 2022-23.
Other programs sector spending: $1,748 million (12.5 per cent) less than expected. Highlights include:
- $408 million higher than expected in Ontario Cultural Media Tax Credits (Vote-Item 3808-1), which provides incentives and support for Ontario-based media companies.[10]
- $194 million higher than expected in Employment Ontario System (Vote-Item 1607-1), which includes employment and training programs, the Ontario Jobs Training Tax Credit and the Ontario Co-operative Education Tax Credit.[10]
- $108 million less than expected in Northern Economic Development (Vote-Item 2106-1), which provides support for Northern Ontario businesses and communities.
- $304 million less than expected in Infrastructure Programs – Capital (Vote-Item 4003-2), which funds infrastructure programs, such as Municipal Infrastructure, Toronto Waterfront Revitalization, Broadband and Cellular Infrastructure, and various Federal-Provincial programs. As of September 30, the Ministry of Infrastructure had spent 4.6 per cent of its $2.0 billion budget.
- $565 million less than expected in Ministry of Transportation, Agency Oversight and Partnerships (Operating) (Vote-Item 2702-2), which provides operating funding for Metrolinx and municipal transit. As of September 30, the ministry had spent less than one per cent of the $585 million budget for Municipal Transit (Operating).
- $591 million less than expected in Electricity Price Mitigation (Vote-Item 2905-1), which includes electricity subsidy programs such as the Ontario Electricity Rebate and the Comprehensive Electricity Plan.
- $887 million less than expected in Ministry of Transportation, Agency Oversight and Partnerships (Capital) (Vote-Item 2702-3), which mainly provides capital funding for Metrolinx and municipal infrastructure projects. As of September 30, the ministry had spent less than one per cent of the $1,021 million budget for Municipal Transit (Capital).
- A net $104 million higher than expected in the remaining 288 vote-items in the ‘other programs’ sector. For more information, visit the FAO’s website at: https://tinyurl.com/yc7rn4nz.
2022-23 Spending vs. 2021-22 Spending
This report also compares spending in the current fiscal year against spending in the previous fiscal year to provide context for provincial spending trends and to identify significant year-over-year spending changes.
As noted above, through the first half of the 2022-23 fiscal year, the Province spent $80.5 billion. This was $3.6 billion (4.7 per cent) more than was spent in the same period in 2021-22. All sectors spent more in the first half of 2022-23 compared to the first half of 2021-22. The largest year-over-year spending increase was in health ($1,014 million), followed by education ($879 million), other programs ($590 million), interest on debt ($518 million), children’s and social services ($415 million), postsecondary education ($150 million) and justice ($18 million).
| Sector | 2022-23 Spending at end of Q2 | 2021-22 Spending at end of Q2 | 2022-23 vs. 2021-22 | 2022-23 vs. 2021-22 (%) |
|---|---|---|---|---|
| Health | 35,073 | 34,059 | 1,014 | 3.0% |
| Education | 12,044 | 11,165 | 879 | 7.9% |
| Postsecondary Education | 3,250 | 3,101 | 150 | 4.8% |
| Children's and Social Services | 8,908 | 8,492 | 415 | 4.9% |
| Justice | 2,616 | 2,598 | 18 | 0.7% |
| Other Programs | 12,279 | 11,689 | 590 | 5.0% |
| Interest on Debt | 6,334 | 5,816 | 518 | 8.9% |
| Total | 80,503 | 76,920 | 3,584 | 4.7% |
- The health sector spent $1,014 million (3.0 per cent) more in the first half of 2022-23 compared to the same period in 2021-22, largely due to higher spending for:
- payments to physicians ($408 million);
- Drug Programs (Vote-Item 1405-2) ($341 million);
- the Operation of Hospitals ($323 million);
- the operation of long-term care homes ($252 million);
- Home Care ($165 million); and
- Clinical Education ($110 million);
- Population and Public Health (Vote-Item 1406-4) (-$490 million).
- The education sector spent $879 million (7.9 per cent) more in the first half of 2022-23 compared to the same period in 2021-22, largely due to higher spending for:
- The children’s and social services sector spent $415 million (4.9 per cent) more in the first half of 2022-23 compared to the same period in 2021-22, largely due to higher spending on Autism ($167 million) and Ontario Works – Financial Assistance ($148 million).
- The other programs sector spent $590 million (5.0 per cent) more in the first half of 2022-23 compared to the same period in 2021-22, largely due to higher spending for:
- Ontario Cultural Media Tax Credits (Vote-Item 3808-1) ($408 million), Economic Development, Job Creation and Trade (Vote-Item 902-13) ($165 million), and the Ontario Jobs Training Tax Credit ($103 million);[13] and
- Metrolinx (Capital) ($189 million);
- Ministry of Northern Development, Mines, Natural Resources and Forestry – Public Protection (Vote-Item 2104-1) (-$120 million);
- COVID-19 Response – Business Property Tax Rebate Grant (-$137 million);
- Ontario COVID-19 Worker Income Protection Benefit (-$150 million); and
- Metrolinx operating subsidies (-$152 million).
- Interest on debt spending was $518 million (8.9 per cent) more in the first half of 2022-23 compared to the same period in 2021-22, consistent with higher interest on debt spending forecast for 2022-23 in the government’s 2022 Ontario Economic Outlook and Fiscal Review.
Status of Unallocated Funds
Unallocated funds are used to address spending pressures or fund program changes during the fiscal year. Unallocated funds cannot be spent directly by the Province but must be transferred to government programs through Treasury Board Orders.
The Province started the 2022-23 fiscal year with a total of $4.6 billion in unallocated funds in the Contingency Fund. In the second quarter, the Province transferred $373 million from the Contingency Fund to the Ministry of Education ($371 million) and Cabinet Office ($1 million). This results in a remaining balance in the Contingency Fund, as of September 30, of $4.2 billion.[14]
| Ministry/Program | $ millions | |
|---|---|---|
| Opening Balance | 4,550 | |
| Less: First Quarter Transfers | 0 | |
| Less: Second Quarter Transfers | ||
| Cabinet Office | ||
| Main Office – Services | 1 | |
| Ministry of Education | ||
| Priority and Partnerships Funding – Third Parties | 365 | |
| Policy and Program Delivery – Services | 6 | |
| Total Second Quarter Transfers | -373 | |
| Balance as of September 30, 2022 | 4,177 | |
Footnotes
[1] Temporary spending authority is first granted by the Legislature through the Interim Appropriation Act, with final spending authority then granted through the Supply Act. Permanent spending authority is also granted through other legislation for a limited number of programs.
[2] The $193.0 billion spending plan excludes $5.7 billion in additional planned spending by the broader public sector organizations controlled by the Province (hospitals, school boards and colleges), the Province’s agencies and the legislative offices. The $5.7 billion in additional planned spending is not reviewed in this report as the Province does not actively monitor or control this spending. As well, the $193.0 billion spending plan excludes $1.3 billion in planned spending on operating assets and $4.3 billion in planned spending on capital assets.
[3] “Expected spending” is also referred to as “planned spending” in Expenditure Monitor reports.
[4] In the 2022 Ontario Economic Outlook and Fiscal Review (also referred to as the Fall Economic Statement or FES), the Province reported that the remaining balance in the Contingency Fund was $3.5 billion. This indicates that, between October 1 and the release of the FES on November 14, the Province transferred an additional $0.7 billion from the Contingency Fund to various programs. The FAO will provide updates on the status of the Contingency Fund in its Q3 and Q4 Expenditure Monitor reports.
[5] Temporary spending authority is first granted by the Legislature through the Interim Appropriation Act, with final spending authority then granted through the Supply Act. Permanent spending authority is also granted through other legislation for a limited number of programs.
[6] The $193.0 billion spending plan excludes $5.7 billion in additional planned spending by the broader public sector organizations controlled by the Province (hospitals, school boards and colleges), the Province’s agencies and the legislative offices. The $5.7 billion in additional planned spending is not reviewed in this report as the Province does not actively monitor or control this spending. As well, the $193.0 billion spending plan excludes $1.3 billion in planned spending on operating assets and $4.3 billion in planned spending on capital assets.
[7] “Expected spending” is also referred to as “planned spending” in Expenditure Monitor reports.
[8] Expected spending has been adjusted to reflect second quarter changes to the spending plan. Fourth quarter expected spending is significantly higher than expected spending in each of the first three quarters due to year-end accrual adjustments and the Contingency Fund.
[9] For more analysis see FAO, “Ministry of Education: Spending Plan Review,” 2022.
[10] Higher than expected spending is due to timing differences in the recording of tax credit spending. The Province recorded approximately $890 million in spending across all tax credits in the second quarter rather than in the third quarter as expected. This variance will be offset in the third quarter.
[11] For more analysis see FAO, “Ministry of Education: Spending Plan Review,” 2022.
[12] Also known as the Ontario Childcare Access and Relief from Expenses (CARE) tax credit.
[13] Higher year-over-year spending is due to timing differences in the recording of tax credit spending. The Province recorded approximately $890 million in spending across all tax credits in the second quarter of 2022-23 compared to the third quarter of 2021-22. This variance will be offset in the third quarter.
[14] In the 2022 Ontario Economic Outlook and Fiscal Review (also referred to as the Fall Economic Statement or FES), the Province reported that the remaining balance in the Contingency Fund was $3.5 billion. This indicates that, between October 1 and the release of the FES on November 14, the Province transferred an additional $0.7 billion from the Contingency Fund to various programs. The FAO will provide updates on the status of the Contingency Fund in its Q3 and Q4 Expenditure Monitor reports.