


Highlights
- This report provides an updated summary of the measures implemented in Ontario by the Government of Ontario (the Province) and the Government of Canada (the federal government) in response to the COVID-19 pandemic.[1] The report also provides information on the sources of funding for provincial measures and estimates the timing of provincial spending.
- Overall, the FAO has identified 128 federal government measures and 118 provincial measures for a total of 246 COVID-19 response measures.
- A complete list of the COVID-19 response measures is available on the FAO’s website at https://bit.ly/39u0kRS.
- Combined, federal and provincial direct support measures[2] will provide Ontario with a net total of $170.3 billion in support from 2019-20 to 2022-23.
- Federal measures will provide Ontario with $144.7 billion in support and provincial measures will provide $35.4 billion. After accounting for $9.8 billion in federal cash transfers to the Province, the federal government’s share of direct support measures is 85 per cent ($144.7 billion) and the provincial government’s share is 15 per cent ($25.6 billion).[3]
- Most of the direct support measures will benefit businesses ($66.4 billion, 39 per cent) and individuals ($65.0 billion, 38 per cent), with the remaining support allocated to the health sector ($25.3 billion, 15 per cent), municipalities ($5.1 billion, three per cent), schools and child care ($3.5 billion, two per cent), and ‘other’ areas ($5.0 billion, three per cent).
- The net total of $170.3 billion in direct support measures has increased by $64.7 billion (61.2 per cent) since September 2020, with the federal government contributing nearly two-thirds of the increase ($42.6 billion) and the Province contributing over one-third ($22.0 billion).
- By category, support for businesses had the largest increase since last year ($24.3 billion), followed by health sector measures ($18.1 billion) and support for individuals ($15.0 billion).
- The FAO estimates that of the $35.4 billion in total provincial direct support measures, $18.5 billion (52 per cent) is new provincial spending, $9.8 billion (28 per cent) will be funded by cash transfers from the federal government, while $7.1 billion (20 per cent) is reallocated spending and savings from non-COVID-19-related provincial programs.
- This means that, when compared against the Province’s spending plan before the start of the COVID-19 pandemic, the net cost to the Province from its direct support measures is an estimated $18.5 billion over four years, as the remaining measures were either funded by the federal government or from reallocations and savings from other provincial program budgets.
- The FAO estimates that of the $35.4 billion in provincial direct support measures, $0.2 billion (0.6 per cent) was spent in 2019-20 and $20.6 billion (58.2 per cent) was spent in 2020-21. Of the remaining $14.6 billion in measures, the FAO estimates that $12.5 billion (35.3 per cent) will be spent this fiscal year, while $2.1 billion (5.9 per cent) will be spent in 2022-23.
- In 2020-21, spending levels increased each quarter, with spending in the fourth quarter reaching an estimated $10.5 billion or 51.2 per cent of total provincial spending on direct support measures in 2020-21.[4]
- In the health sector, 70 per cent ($5.6 billion) of 2020-21 provincial spending on COVID-19-related measures occurred in the last six months of the fiscal year, reflecting the timing of health sector activity, such as hospitalizations, COVID-19 testing and vaccinations.
Introduction
This report provides an updated summary of the measures implemented in Ontario by the Government of Ontario (the Province) and the Government of Canada (the federal government) in response to the COVID-19 pandemic.[5] A complete list of the COVID-19 response measures identified by the FAO is available on the FAO’s website at https://bit.ly/39u0kRS. The FAO’s list of measures includes:
- for provincial measures: an estimate of the cost of each measure;
- for federal government measures: an estimate of the cost of the support provided to Ontario;
- a description of each measure; and
- the target of support for each measure, either individuals, businesses, municipalities, the health sector, schools and child care, or ‘other’.
This report also provides information on the sources of funding for provincial measures and estimates the timing of provincial spending.
More information on the development of this report, including data sources and methodology, is available at the end of the report.
Overview of Federal and Provincial Measures
Overall, the FAO has identified 128 federal government measures and 118 provincial measures for a total of 246 COVID-19 response measures. The FAO has categorized the measures into direct support measures and liquidity measures.
Direct support measures have a direct impact on the respective government’s budget balance through either increased spending (spending measures) or reduced revenue (revenue measures). Liquidity measures provide short-term cash flow support for people and businesses by deferring certain tax payments or providing interest-free loans. Unlike direct support measures, the support provided through liquidity measures must be paid back. Therefore, the cost to the two governments to provide liquidity supports, which includes the cost of borrowing or foregone interest income, will have a relatively minor impact on budget balances.[6]
Direct Support Measures
As of the writing of this report, the FAO estimates that there are 238 federal and provincial direct support measures[7] that will provide Ontario with a net total of $170.3 billion in support from 2019-20 to 2022-23. This includes 124 federal measures, which will provide Ontario with $144.7 billion in support, and 114 provincial measures, which will provide $35.4 billion.[8] [9]
However, included in the federal government’s measures are cash transfers to the Province worth an estimated $9.8 billion. After accounting for federal cash transfers, the federal government’s share of direct support measures is 85 per cent ($144.7 billion) and the provincial government’s share is 15 per cent ($25.6 billion).[10]
The vast majority of the direct support measures are spending measures, rather than revenue measures. In total, 224 spending measures will provide estimated net support of $166.1 billion, while 14 revenue measures will provide an estimated $4.2 billion in support.
| Estimated Cost of Support in Ontario ($ millions) | Number of Measures | |
|---|---|---|
| Federal Measures: | ||
| Spending Measures | 141,797 | 117 |
| Revenue Measures | 2,886 | 7 |
| Total Federal Direct Support Measures | 144,683 | 124 |
| Provincial Measures: | ||
| Spending Measures | 34,098 | 107 |
| Revenue Measures | 1,279 | 7 |
| Total Provincial Direct Support Measures | 35,376 | 114 |
| Less: federal government cash transfers to the Government of Ontario to support provincial measures | -9,787 | |
| Net Total Direct Support Measures | 170,272 | 238 |
Target of Support: Federal and Provincial Measures[11]
The FAO reviewed the 238 federal and provincial direct support measures to determine the target of support based on six categories: individuals, businesses, municipalities (including public transit operations and social services), health sector, schools and child care, and ‘other’.[12] Of the $170.3 billion in net total direct support measures, the FAO estimates that:
- Businesses will receive $66.4 billion (39 per cent) of the total, mostly through wage subsidies, forgivable loans and grants to small businesses and not-for-profit organizations, and rent and mortgage-related support.
- Individuals will receive $65.0 billion (38 per cent) primarily through the Canada Emergency Response Benefit (CERB) and other employment supports, an enhanced HST credit, and payments to families with children.
- The health sector will receive $25.3 billion (15 per cent) for a variety of measures, including vaccines, testing and contact tracing, funding for hospitals and long-term care homes, and personal protective equipment (PPE).
- Municipalities in Ontario are expected to receive $5.1 billion (three per cent) to support operations, social services and public transit.
- Schools and child care providers will receive $3.5 billion in funding (two per cent) to support public health measures, maintain pre-pandemic funding levels for school boards, and provide stabilization funding for child care centres.
- $5.0 billion (three per cent) will be provided for ‘other’ measures, which includes funding for Metrolinx and other provincial transit agencies, the Canada Revenue Agency, support for First Nations and Indigenous communities, temporary pandemic pay for eligible workers outside of the health sector, and support for tourism, culture and sport organizations.
Chart 1: Cost of federal and provincial COVID-19 direct support measures in Ontario by target of support, $ billions and per cent
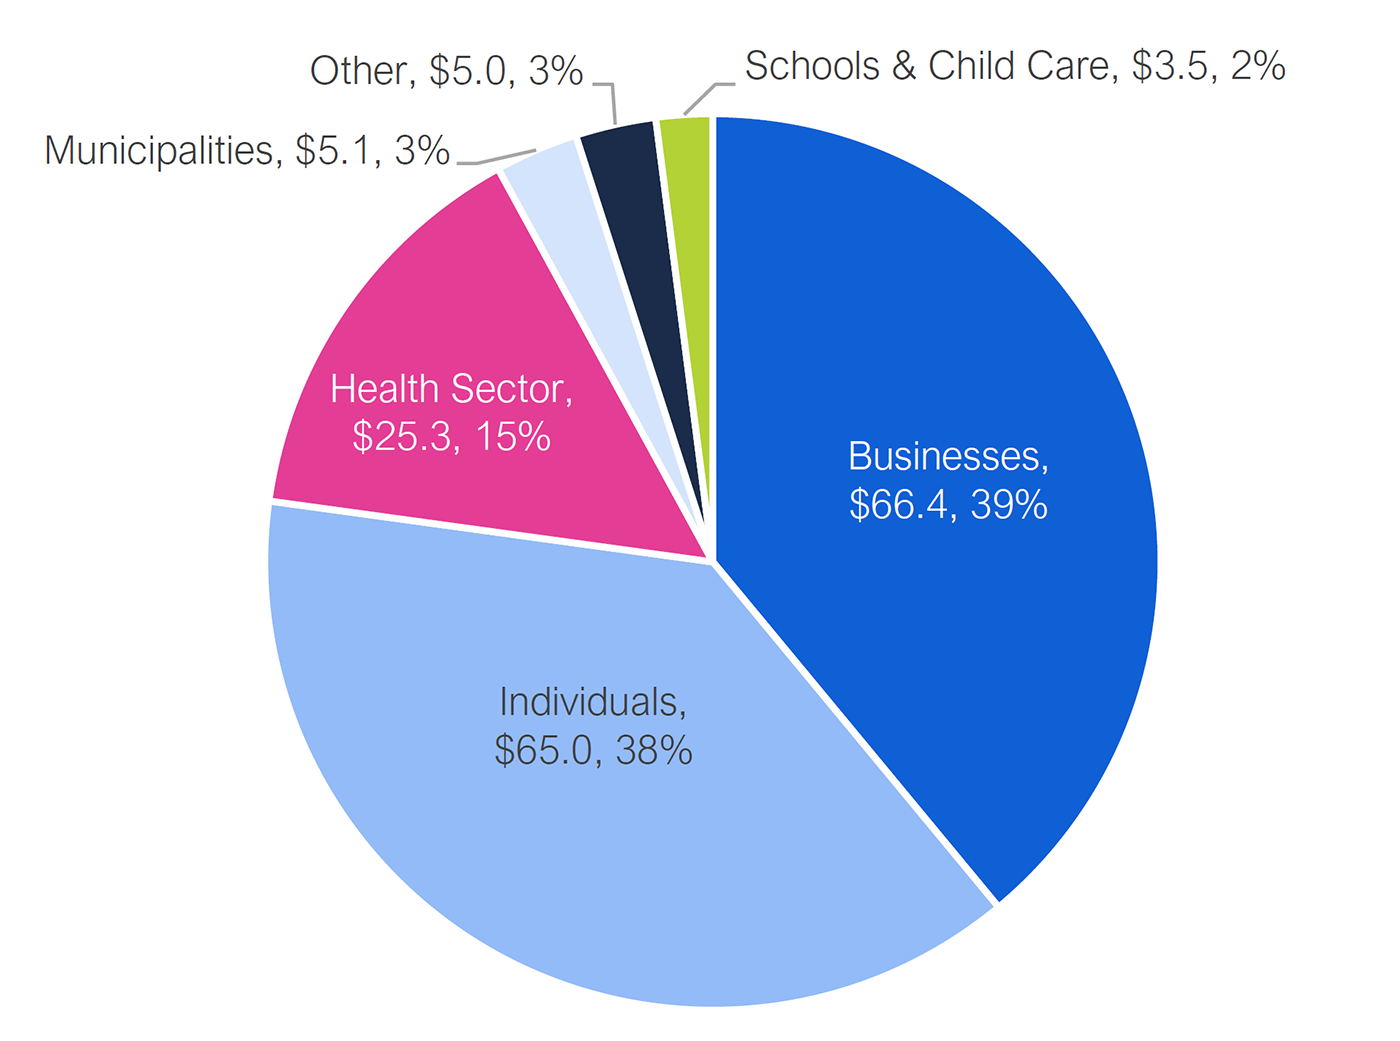
Source: FAO analysis of the Government of Canada’s COVID-19 Economic Response Plan, the Parliamentary Budget Office’s Costing of Canada’s COVID-19 Economic Response Plan, and information provided by the Ministries of Health, Long-Term Care and Education, and Treasury Board Secretariat.
What Has Changed since September 2020?[13]
Since the FAO’s last report on COVID-19 response measures in September 2020, the estimated cost of direct support measures has increased by $64.7 billion or 61.2 per cent. The federal government has increased direct support to Ontario by $42.6 billion (nearly two-thirds of the increase) and the Province has increased support by $22.0 billion (over one-third of the increase).
| Support as of Sept 2020 ($ millions) | Support as of Sept 2021 ($ millions) | Increase since Sept 2020 ($ millions) | Increase since Sept 2020 (%) | |
|---|---|---|---|---|
| Businesses | 42,108 | 66,398 | 24,290 | 57.7 |
| Individuals | 49,995 | 65,006 | 15,011 | 30.0 |
| Health Sector | 7,208 | 25,321 | 18,113 | 251.3 |
| Municipalities | 3,925 | 5,116 | 1,191 | 30.3 |
| Other | 1,037 | 4,957 | 3,921 | 378.2 |
| Schools & Child Care | 1,344 | 3,474 | 2,130 | 158.5 |
| Net Total Measures | 105,617 | 170,272 | 64,655 | 61.2 |
Of the $64.7 billion increase in direct support measures since September 2020, the FAO estimates that:
- Support for businesses increased by $24.3 billion (57.7 per cent), mostly from the extension of the Canada Emergency Wage Subsidy, expansion of the Canada Emergency Business Account, and the introduction of the Ontario Small Business Support Grant.
- Support for individuals increased by $15.0 billion (30.0 per cent), mostly from enhancements to Employment Insurance (EI) and the introduction of the Canada Recovery Benefit, the Canada Recovery Caregiving Benefit, and the Ontario COVID-19 Child Benefit.
- Health sector support increased by $18.1 billion (251.3 per cent) through a variety of measures, including $8.9 billion in new spending for vaccines, testing and contact tracing, $2.3 billion in additional support for hospital and long-term care homes operations, $1.6 billion for additional PPE, $1.1 billion for additional hospital capacity, $0.7 billion for pandemic pay extensions, $0.6 billion for quarantine facilities and COVID-19 border measures, and an estimated $0.6 billion to address the surgery backlog through 2022-23.[14]
- Support to municipalities increased by $1.2 billion (30.3 per cent), due to additional provincial transfers for transit, municipal operations and social supports, including $0.5 billion in additional funding for homelessness supports over two years.
- Support to schools and child care providers increased by $2.1 billion (158.5 per cent), due in part to the use of an estimated $0.6 billion in school board reserves, provincial stabilization funding of $0.5 billion for child care providers and $0.4 billion for school boards, and additional allocations of $0.4 billion through the Safe Return to Class Fund.
- ‘Other’ support measures increased by $3.9 billion (378.2 per cent), due in part to $1.3 billion in stabilization funding for Metrolinx and other provincial transit operators, $0.6 billion in additional funding for Indigenous communities, $0.3 billion in operational support for the Canada Revenue Agency, and $0.2 billion in additional supports for tourism, cultural and sport organizations.
Status of Federal Cash Transfers to Ontario
As previously mentioned, the Province’s COVID-19 response measures are partly funded through cash transfers from the federal government. As of the writing of this report, the FAO has identified nine streams of federal transfers that will provide a total of $9.8 billion to the Province by the end of 2022-23.[15] All nine streams have been fully allocated by the Province to provincial direct support measures.
| Federal Transfer | Description | Funds Provided to Ontario |
|---|---|---|
| Safe Restart Agreement | Funding is provided for testing, contact tracing and data management, health care system capacity, vulnerable populations, municipalities and transit, PPE, and child care for returning workers. | 5,095 |
| Canada Health Transfer | One-time top-up to the Canada Health Transfer to help provinces and territories address immediate health care system pressures. | 1,551 |
| Essential Workers Wage Top-up | To support wage increases for essential workers. | 1,129 |
| Safe Return to Class | Funding for provinces and territories to support a safe return to class and to protect students and staff. | 763 |
| Workforce Development Agreement (WDA) | Additional funding for the Workforce Development Agreements with provinces and territories to offer Canadians skills and employment training. | 614 |
| Canada’s COVID-19 Immunization Plan | To support provinces and territories with vaccine rollout campaigns. | 388 |
| COVID-19 Response Fund for Provinces and Territories | Support to provinces and territories for critical health care system needs. | 194 |
| Virtual Care Agreement | Funding to develop, expand and launch virtual care and mental health tools. | 46 |
| Culture and Sport Emergency Funding | Provides additional temporary relief to support cultural, heritage and sport organizations. | 8 |
| Total | 9,787 |
Sources of Funding for Provincial Direct Support Measures
The FAO estimates that of the $35.4 billion in total provincial direct support measures, $18.5 billion (52 per cent) is new provincial spending,[16] $9.8 billion (28 per cent) will be funded by cash transfers from the federal government, while $7.1 billion (20 per cent) is reallocated spending and savings from non-COVID-19-related programs.[17] This means that, when compared against the Province’s spending plan before the start of the COVID-19 pandemic, the net cost to the Province from its direct support measures is an estimated $18.5 billion, as the remaining measures were either funded by the federal government or from reallocations and savings from other program budgets.
Chart 2: Sources of funding for the $35.4 billion in provincial COVID-19 direct support measures, $ billions and per cent
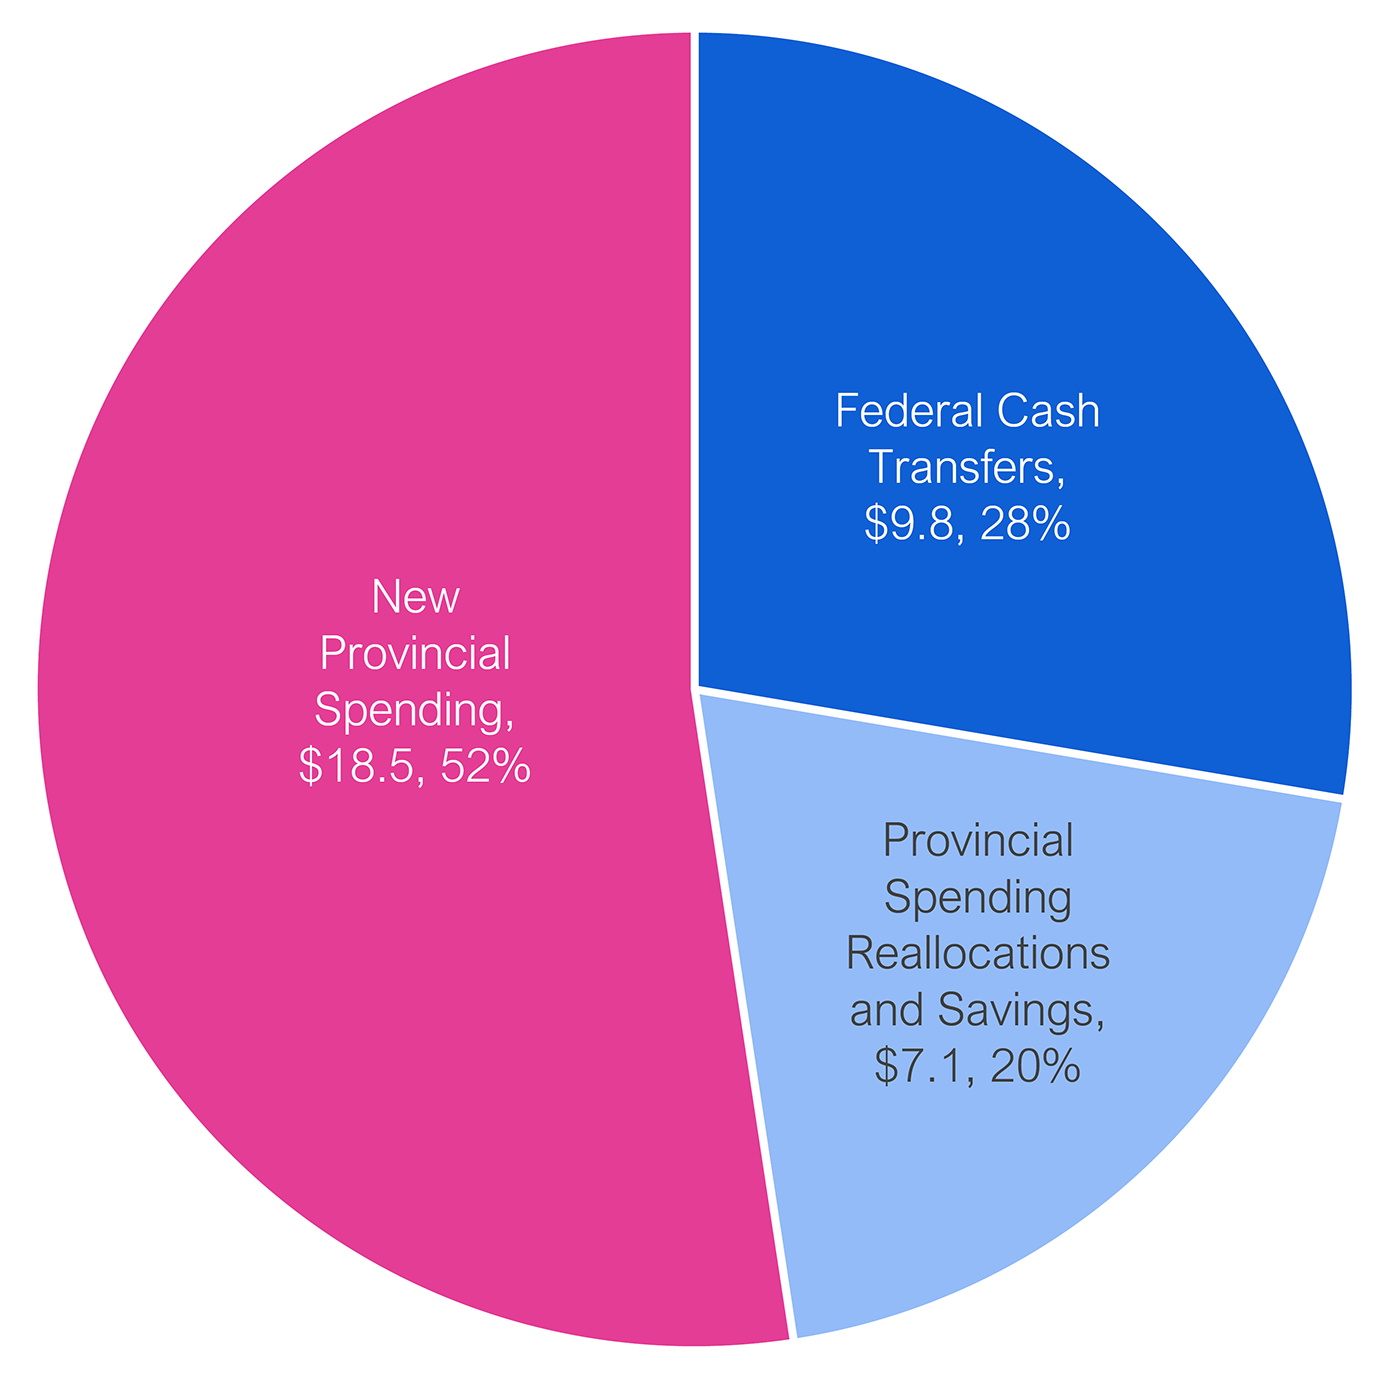
Note: Provincial Spending Reallocations and Savings include decisions by the Province to repurpose funds from non-COVID-19-related programs and also the use of savings from non-COVID-19-related program budgets that resulted from the impact of the COVID-19 pandemic (i.e., changes in behaviour, such as lower demand for physician services, that resulted in program savings).
Source: FAO analysis of the Government of Canada’s COVID-19 Economic Response Plan, the Parliamentary Budget Office’s Costing of Canada’s COVID-19 Economic Response Plan, and information provided by the Ministries of Health, Long-Term Care and Education, and Treasury Board Secretariat.
The FAO estimates that the $7.1 billion in provincial spending reallocations and savings used to fund direct support measures is from the following sources:
- $2.0 billion from hospital base operating budgets, including the reallocation of funding for delayed elective surgeries and non-emergent diagnostic procedures to COVID-19 direct support measures;
- $1.3 billion from lower than planned payments to physicians, as the COVID-19 pandemic led to a drop in the demand for physician services in 2020-21;
- $0.6 billion from the use of school board reserve funds;
- $0.5 billion in stabilization funding for child care centres, which maintained pre-pandemic funding levels;
- $0.4 billion from the School Board Stabilization fund, which maintained pre-pandemic school board funding in the 2020-21 school year despite the 1.2 per cent decline in elementary and secondary school enrolment due to the pandemic;
- $0.5 billion from lower than planned student financial aid payments;
- $0.5 billion from lower than planned social assistance payments (Ontario Works (OW), the Ontario Disability Support Program (ODSP) and the Ontario Drug Benefit Plan);[18] and
- $1.3 billion from all other program spending reallocations and savings, including lower than planned capital spending ($0.6 billion) and program savings from various tax credits.[19]
The Timing of Provincial Spending
The FAO estimates that of the $35.4 billion in provincial direct support measures, $0.2 billion (0.6 per cent) was spent in 2019-20 and $20.6 billion (58.2 per cent) was spent in 2020-21.[20] Of the remaining $14.6 billion in measures, the FAO estimates that $12.5 billion (35.3 per cent) will be spent this fiscal year, while $2.1 billion (5.9 per cent) will be spent in 2022-23.
Chart 3: The timing of provincial COVID-19 direct support measures spending, 2019-20 to 2022-23, $ millions
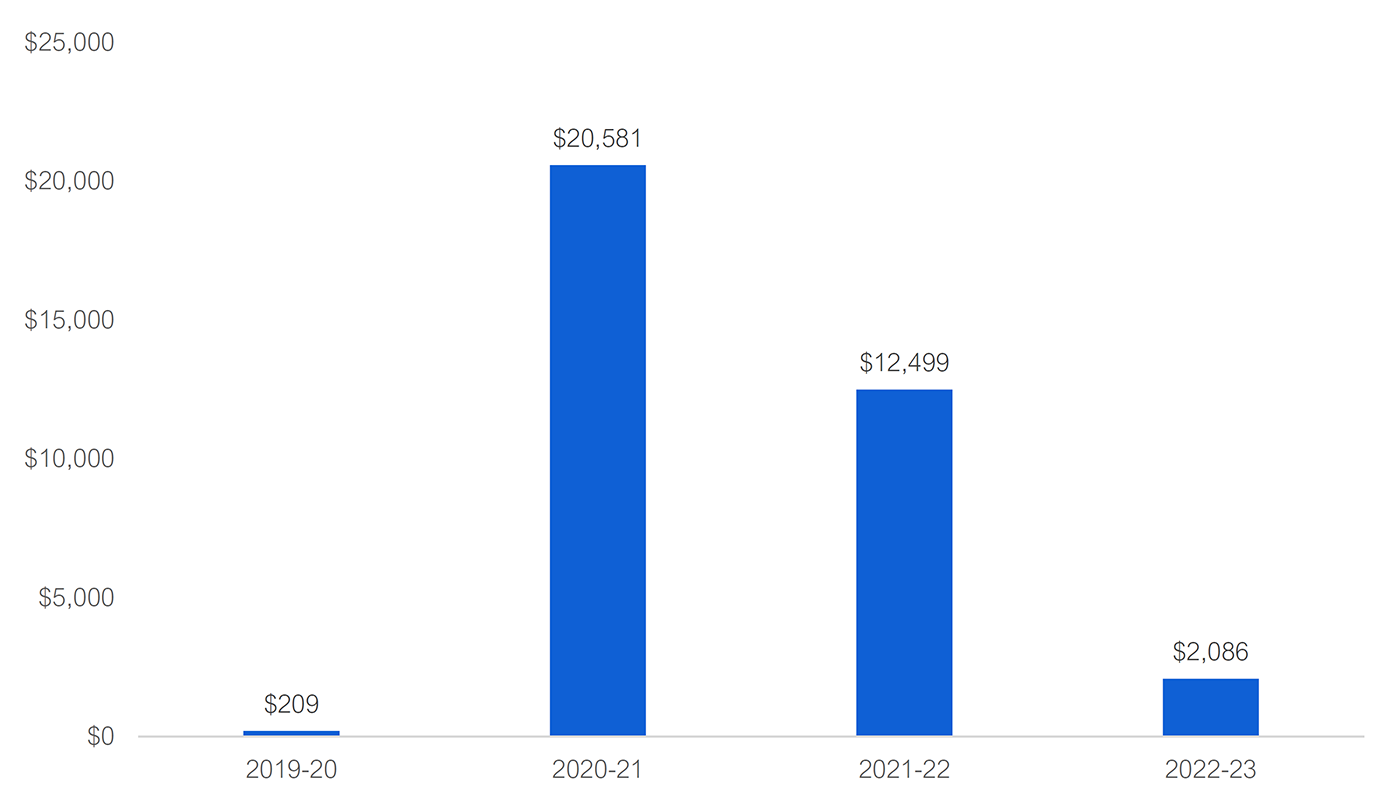
Source: FAO analysis of information provided by the Ministries of Health, Long-Term Care and Education, and Treasury Board Secretariat.
Spending by Quarter in 2020-21
Of the $20.6 billion in spending on provincial direct support measures in 2020-21, the FAO estimates that the Province spent approximately $5.2 billion (25 per cent) over the first six months of the fiscal year and $15.4 billion (75 per cent) over the last six months of the fiscal year. Spending increased each quarter, with spending in the fourth quarter reaching an estimated $10.5 billion or 51.2 per cent of total provincial spending in 2020-21 on direct support measures.
| $ millions | Q1 Apr–Jun 2020 |
Q2 Jul–Sept 2020 |
Q3 Oct–Dec 2020 |
Q4 Jan–Mar 2021 |
Total 2020-21 Spending |
|---|---|---|---|---|---|
| Health Sector | 1,184 | 1,167 | 2,297 | 3,269 | 7,917 |
| Municipalities | 196 | 666 | 1,003 | 2,965 | 4,830 |
| Businesses | 245 | 174 | 262 | 1,768 | 2,449 |
| Schools & Child Care | 121 | 72 | 868 | 1,035 | 2,095 |
| Individuals | 582 | 67 | 117 | 891 | 1,657 |
| Other | 45 | 660 | 316 | 612 | 1,633 |
| Total | 2,373 | 2,805 | 4,863 | 10,539 | 20,581 |
| Per Cent | 11.5% | 13.6% | 23.6% | 51.2% | 100.0% |
- Health sector: 70 per cent ($5.6 billion) of 2020-21 provincial spending on COVID-19-related health sector measures occurred in the last six months of the fiscal year, reflecting the timing of health sector activity, such as hospitalizations, COVID-19 testing and vaccinations. For example:
- 66 per cent of all hospital days occupied by COVID-19 patients in 2020-21 and 69 per cent of all tests completed in 2020-21 occurred during the second half of the fiscal year;[21]
- 60 per cent of 2020-21 temporary pandemic pay for eligible workers in the health sector was spent in the last six months of the fiscal year; and
- 99 per cent of COVID-19 vaccine doses administered in 2020-21 occurred during the fourth quarter.
- Municipalities: 82 per cent ($4.0 billion) of provincial support to municipalities occurred in the third and fourth quarters, due to the timing of provincial support for municipal operations and transit agencies announced in the Safe Restart Agreement and the 2021 Ontario Budget.
- Businesses: 72 per cent ($1.8 billion) of provincial support to businesses occurred in the fourth quarter, largely due to an estimated $1.3 billion in spending on the Ontario Small Business Support Grant.[22]
- Schools & child care: 91 per cent ($1.9 billion) of provincial support for schools and child care occurred in the third and fourth quarters, including $0.7 billion to support the safe reopening of schools, $0.6 billion in funding for child care, $0.2 billion from school board reserves and $0.3 billion for stabilization funding for school boards.
- Individuals: 89 per cent ($1.5 billion) of provincial support for individuals occurred in the first and fourth quarters, largely due to the Support for Families program ($0.3 billion paid in the first quarter), the Support for Learners program (an estimated $0.4 billion paid in the fourth quarter), employment and training supports ($0.3 billion in the fourth quarter), and adjustments to time-of-use electricity pricing ($0.2 billion in the first quarter and $0.2 billion in the fourth quarter).
- ‘Other’: 78 per cent ($1.3 billion) of provincial spending in this category occurred in the second and fourth quarters, partly due to the timing of stabilization funding for Metrolinx and other provincial transit operators.
Spending in 2021-22 and 2022-23
The FAO estimates that the Province will spend $14.6 billion on direct support measures in 2021-22 and 2022-23.
| Estimated Provincial Spending in 2021-22 and 2022-23 ($ millions) | Portion of Total Provincial Spending in 2021-22 and 2022-23 (per cent) | |
|---|---|---|
| Health Sector | 6,695 | 45.9 |
| Businesses | 3,055 | 20.9 |
| Individuals | 2,031 | 13.9 |
| Schools & Child Care | 1,260 | 8.6 |
| Other | 1,259 | 8.6 |
| Municipalities | 286 | 2.0 |
| Total | 14,586 | 100.0 |
- Health sector: $6.7 billion (45.9 per cent of total estimated provincial direct support measures in 2021-22 and 2022-23) for testing and contact tracing ($2.3 billion), vaccinations ($1.0 billion), support for long-term care home operations ($0.8 billion), hospital capacity ($0.8 billion), and the estimated cost to address the surgery backlog through 2022-23.[23]
- Businesses: $3.1 billion (20.9 per cent), including the Ontario Small Business Support Grant (an estimated $1.6 billion of the $3.0 billion total cost of the program will be paid in 2021-22), the Property Tax and Energy Costs Rebate Grants program (an estimated $0.3 billion of the $0.5 billion total cost of the program will be paid in 2021-22) and a permanent increase to the Employer Health Tax exemption threshold (an estimated $0.7 billion in 2021-22 and 2022-23).
- Individuals: $2.0 billion (13.9 per cent), including an estimated $0.9 billion for the Ontario COVID-19 Child Benefit; employment and training supports, including the Temporary Ontario Jobs Training Tax Credit ($0.2 billion); the Ontario COVID-19 Worker Income Protection Benefit ($0.2 billion); and $0.2 billion for a proposed domestic tourism tax credit expected in 2022.
- Schools & child care: $1.3 billion (8.6 per cent), including an estimated $0.6 billion in funding to support the safe reopening of schools, $0.4 billion from school board reserves and $0.2 billion for stabilization funding for school boards due to a 1.2 per cent decline in elementary and secondary school enrolment in the 2020-21 school year.[24]
- ‘Other’: $1.3 billion (8.6 per cent), including a $0.7 billion operating subsidy for Metrolinx and other provincial transit agencies; $0.2 billion for temporary pandemic pay for eligible workers outside of the health sector; financial support for tourism, cultural and sport organizations ($0.1 billion); funding to support Indigenous communities and faith-based and cultural organizations ($0.1 billion); and support for government operations impacted by the pandemic.
- Municipalities: $0.3 billion (2.0 per cent) in additional funding for the Social Services Relief Fund, mostly to support homeless shelters.
Appendix
Target of Support: Provincial Measures
Of the $35.4 billion in provincial direct support measures, $14.7 billion (41 per cent) will go to support the health sector. This is followed by support for businesses ($5.6 billion, 16 per cent), municipalities ($5.1 billion, 14 per cent), individuals ($3.7 billion, 11 per cent), schools and child care ($3.4 billion, nine per cent), and ‘other’ supports ($2.9 billion, eight per cent).
Chart 4: $35.4 billion in provincial COVID-19 direct support measures by target of support, $ billions and per cent
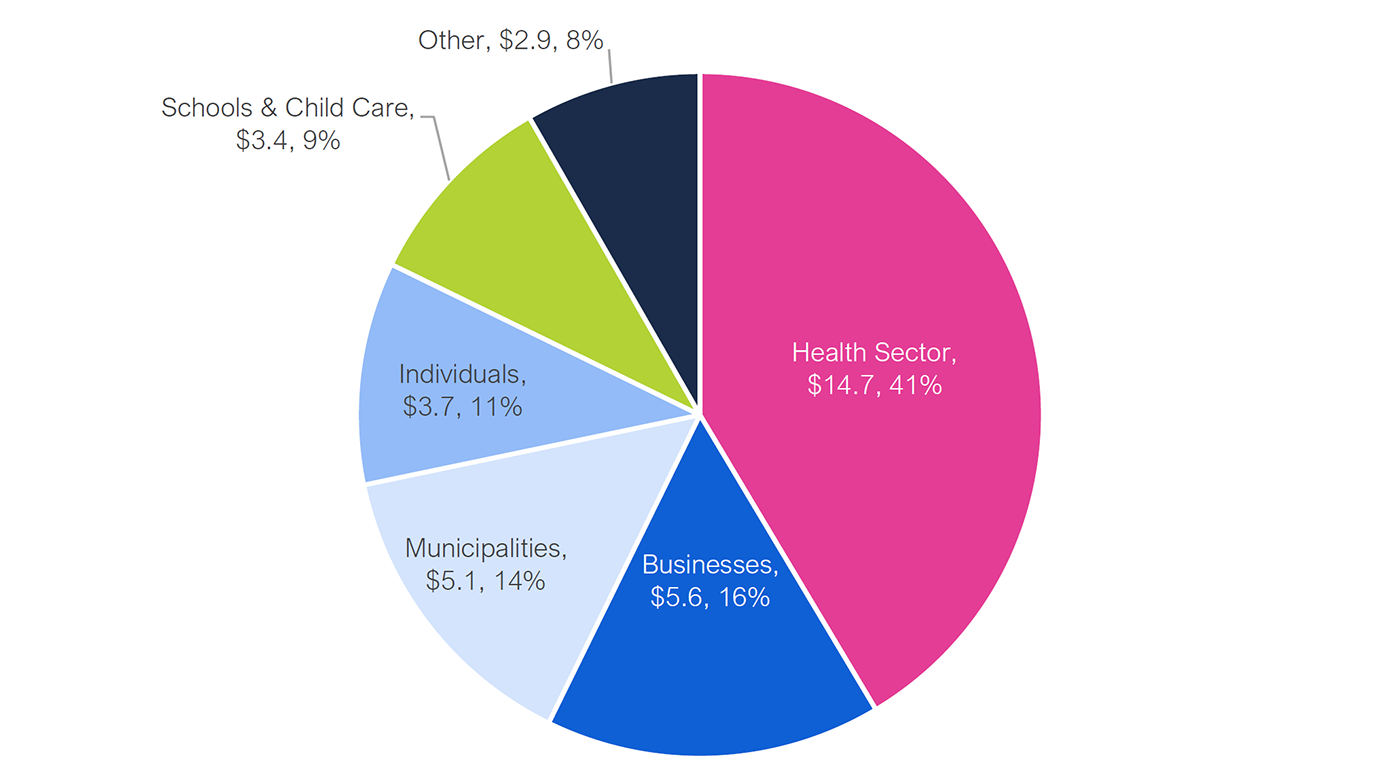
Source: FAO analysis of information provided by the Ministries of Health, Long-Term Care and Education, and Treasury Board Secretariat.
How Has Provincial Support Changed since September 2020?
Since the FAO’s last report on COVID-19 response measures in September 2020, the estimated cost of total provincial direct support measures has increased by $24.6 billion[25] or 228.8 per cent. The largest increases went to the health sector ($11.2 billion), followed by businesses ($4.9 billion) and individuals ($3.0 billion).
| Support as of Sept 2020 ($ millions) | Support as of Sept 2021 ($ millions) | Increase since Sept 2020 ($ millions) | Increase since Sept 2020 (%) | |
|---|---|---|---|---|
| Health Sector | 3,507 | 14,657 | 11,150 | 317.9% |
| Businesses | 731 | 5,601 | 4,870 | 666.1% |
| Municipalities | 3,925 | 5,116 | 1,191 | 30.3% |
| Individuals | 737 | 3,715 | 2,978 | 404.3% |
| Schools & Child Care | 1,344 | 3,356 | 2,012 | 149.7% |
| Other | 515 | 2,931 | 2,416 | 468.7% |
| Total | 10,759 | 35,376 | 24,617 | 228.8% |
Liquidity Measures
The FAO estimates that there are 20 federal and provincial liquidity measures that will provide Ontario with a net total of $78.2 billion in liquidity support.[26] This includes 13 federal measures,[27] which will provide Ontario with an estimated $67.9 billion (87 per cent of total) in liquidity support, and seven provincial measures, which will provide $10.3 billion (13 per cent) in liquidity support. The complete list of liquidity support measures is available on the FAO’s website at: https://bit.ly/39u0kRS.
Since September 2020, two new liquidity support measures have been added.[28] In addition, the FAO has revised estimates to several measures, increasing the total estimated liquidity support by $1.4 billion.
| Estimated Liquidity Support in Ontario ($ millions) | Number of Measures | |
|---|---|---|
| Federal Liquidity Measures | 67,901 | 13 |
| Provincial Liquidity Measures | 10,325 | 7 |
| Total Liquidity Measures | 78,226 | 20 |
Health Sector Activity in 2020-21
The FAO estimates that 66 per cent of all hospital days occupied by COVID-19 patients in 2020-21 and 69 per cent of all COVID-19 laboratory tests completed in 2020-21 occurred during the second half of the fiscal year (from October 1, 2020 to March 31, 2021).[29]
Chart 5: Daily COVID-19 hospitalizations and laboratory tests completed in Ontario, 2020-21
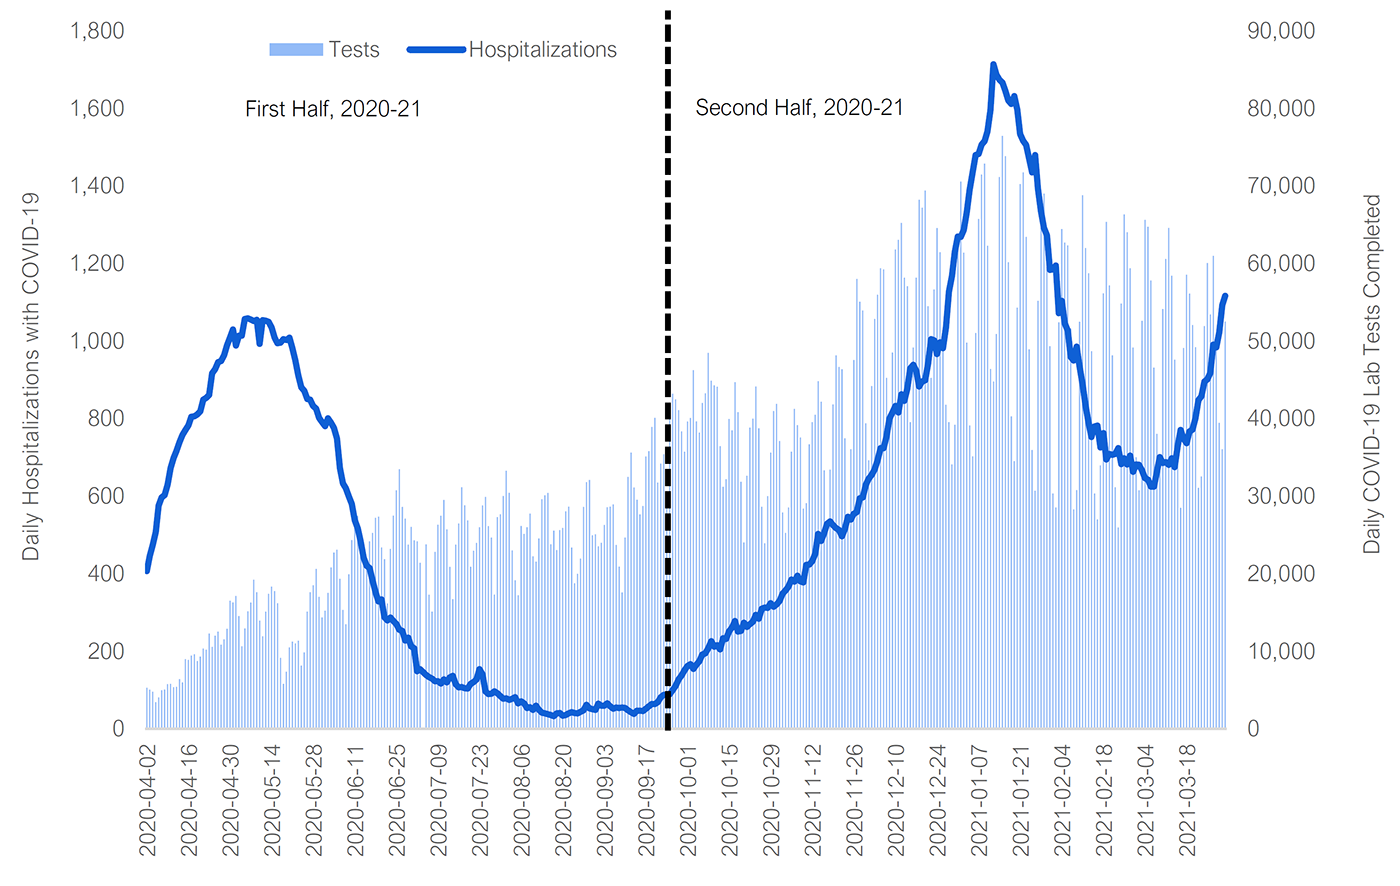
Source: FAO analysis of information as of August 13, 2021 from COVID-19 cases in hospital and ICU, by Ontario Health (OH) region, Ministry of Health, and the Ontario COVID-19 Data Tool, Public Health Ontario.
During the first wave of the COVID-19 pandemic, hospitalized COVID-19 patients reached a high of 1,059 on May 6, 2020, followed by a decline to a low of 33 hospitalizations on August 17, 2020. During the second wave of the pandemic, hospitalizations reached a high of 1,714 on January 12, 2021, followed by a smaller decline to a low of 625 hospitalizations on March 6, 2021.
During the first half of 2020-21, a total of 3.9 million COVID-19 laboratory tests were completed in Ontario, compared to 8.7 million tests completed in the second half of the fiscal year. Daily COVID-19 laboratory tests reached a maximum of 76,472 on January 14, 2021 and have declined since then. For example, the average number of daily COVID-19 tests completed during July 2021 was 19,628.
About this Document
Established by the Financial Accountability Officer Act, 2013, the Financial Accountability Office (FAO) provides independent analysis on the state of the Province’s finances, trends in the provincial economy and related matters important to the Legislative Assembly of Ontario.
This report has been prepared with the benefit of publicly available information[30] and information provided by the Ministries of Health, Long-Term Care and Education, and Treasury Board Secretariat.
This report reflects information received by the FAO as of September 24, 2021. All dollar amounts are in Canadian, current dollars (i.e., not adjusted for inflation) unless otherwise noted.
This report was prepared by Tessa Devakos, Sahib Gaba, Jacob Kim and Matthew Stephenson, under the direction of Luan Ngo and Jeffrey Novak.
Methodology
For federal measures, the FAO largely utilized Canada-wide cost estimates published by the Government of Canada[31] and the Parliamentary Budget Office,[32] and then estimated the proportion of support that would benefit Ontario. For taxable benefits, such as the Canada Emergency Response Benefit (CERB), costs are presented on a gross basis (i.e., not including tax revenue offsets). The FAO’s cost estimates for provincial measures are based largely on information provided by the Ministries of Health, Long-Term Care and Education, and Treasury Board Secretariat.
The FAO estimated the sources of funding for provincial direct support measures by using analysis and information from two FAO reports: “Spending Plan Analysis: 2020-21” and “Expenditure Monitor 2020-21: Q4.”
To estimate the timing of provincial COVID-19 spending in 2020-21, the FAO used spending data from the FAO’s “Expenditure Monitor 2020-21: Q4” report, which included quarterly spending information for a number of provincial direct support measures. To estimate the timing of the temporary pandemic pay measure, the FAO used information from Auditor General of Ontario, “COVID-19 Preparedness and Management: Special Report on Management of Health-Related COVID-19 Expenditures,” 2021.
Graphic Descriptions
| Target of Support | Support ($ billions) | Share of Support (per cent) |
|---|---|---|
| Businesses | 66.4 | 39% |
| Individuals | 65.0 | 38% |
| Health Sector | 25.3 | 15% |
| Municipalities | 5.1 | 3% |
| Other | 5.0 | 3% |
| Schools & Child Care | 3.5 | 2% |
| Source of Funding | $ billions | Per cent |
|---|---|---|
| New Provincial Spending | 18.5 | 52% |
| Federal Cash Transfers | 9.8 | 28% |
| Provincial Spending Reallocations and Savings | 7.1 | 20% |
| Fiscal Year | Direct Support Measures Spending ($ millions) |
|---|---|
| 2019-20 | 209 |
| 2020-21 | 20,581 |
| 2021-22 | 12,499 |
| 2022-23 | 2,086 |
| Target of Support | Support ($ billions) | Share of Support (per cent) |
|---|---|---|
| Health Sector | 14.7 | 41% |
| Businesses | 5.6 | 16% |
| Municipalities | 5.1 | 14% |
| Individuals | 3.7 | 11% |
| Schools & Child Care | 3.4 | 9% |
| Other | 2.9 | 8% |
| Date | Hospitalizations | Laboratory Tests |
|---|---|---|
| 2020-04-02 | 407 | 5,310 |
| 2020-04-03 | 446 | 5,067 |
| 2020-04-04 | 475 | 4,799 |
| 2020-04-05 | 508 | 3,440 |
| 2020-04-06 | 576 | 4,071 |
| 2020-04-07 | 597 | 4,989 |
| 2020-04-08 | 603 | 5,088 |
| 2020-04-09 | 630 | 5,787 |
| 2020-04-10 | 673 | 5,816 |
| 2020-04-11 | 699 | 5,382 |
| 2020-04-12 | 717 | 5,417 |
| 2020-04-13 | 739 | 6,422 |
| 2020-04-14 | 758 | 6,010 |
| 2020-04-15 | 771 | 9,001 |
| 2020-04-16 | 783 | 8,899 |
| 2020-04-17 | 805 | 9,462 |
| 2020-04-18 | 806 | 9,643 |
| 2020-04-19 | 811 | 8,743 |
| 2020-04-20 | 819 | 9,330 |
| 2020-04-21 | 849 | 10,361 |
| 2020-04-22 | 854 | 10,214 |
| 2020-04-23 | 861 | 12,295 |
| 2020-04-24 | 917 | 10,578 |
| 2020-04-25 | 928 | 12,020 |
| 2020-04-26 | 946 | 12,550 |
| 2020-04-27 | 949 | 10,852 |
| 2020-04-28 | 964 | 11,554 |
| 2020-04-29 | 989 | 12,928 |
| 2020-04-30 | 1,009 | 16,532 |
| 2020-05-01 | 1,030 | 16,305 |
| 2020-05-02 | 989 | 17,146 |
| 2020-05-03 | 1,014 | 14,555 |
| 2020-05-04 | 1,014 | 10,654 |
| 2020-05-05 | 1,057 | 12,961 |
| 2020-05-06 | 1,059 | 15,179 |
| 2020-05-07 | 1,056 | 16,295 |
| 2020-05-08 | 1,052 | 19,227 |
| 2020-05-09 | 1,055 | 17,618 |
| 2020-05-10 | 993 | 13,970 |
| 2020-05-11 | 1,054 | 11,957 |
| 2020-05-12 | 1,053 | 15,137 |
| 2020-05-13 | 1,050 | 17,429 |
| 2020-05-14 | 1,035 | 18,354 |
| 2020-05-15 | 1,009 | 17,768 |
| 2020-05-16 | 995 | 16,217 |
| 2020-05-17 | 996 | 9,155 |
| 2020-05-18 | 1,005 | 5,813 |
| 2020-05-19 | 1,003 | 7,382 |
| 2020-05-20 | 1,009 | 10,506 |
| 2020-05-21 | 983 | 11,276 |
| 2020-05-22 | 951 | 11,028 |
| 2020-05-23 | 912 | 11,383 |
| 2020-05-24 | 881 | 8,170 |
| 2020-05-25 | 872 | 9,875 |
| 2020-05-26 | 851 | 15,133 |
| 2020-05-27 | 849 | 17,615 |
| 2020-05-28 | 833 | 18,525 |
| 2020-05-29 | 826 | 20,640 |
| 2020-05-30 | 802 | 17,014 |
| 2020-05-31 | 791 | 14,379 |
| 2020-06-01 | 781 | 15,244 |
| 2020-06-02 | 801 | 17,537 |
| 2020-06-03 | 790 | 20,822 |
| 2020-06-04 | 776 | 22,730 |
| 2020-06-05 | 749 | 23,105 |
| 2020-06-06 | 672 | 19,374 |
| 2020-06-07 | 633 | 15,357 |
| 2020-06-08 | 621 | 13,509 |
| 2020-06-09 | 600 | 19,941 |
| 2020-06-10 | 580 | 24,341 |
| 2020-06-11 | 538 | 28,335 |
| 2020-06-12 | 517 | 27,456 |
| 2020-06-13 | 484 | 23,278 |
| 2020-06-14 | 442 | 21,751 |
| 2020-06-15 | 421 | 21,724 |
| 2020-06-16 | 415 | 24,205 |
| 2020-06-17 | 382 | 25,278 |
| 2020-06-18 | 352 | 27,225 |
| 2020-06-19 | 329 | 27,387 |
| 2020-06-20 | 334 | 23,408 |
| 2020-06-21 | 288 | 21,900 |
| 2020-06-22 | 280 | 16,189 |
| 2020-06-23 | 287 | 23,207 |
| 2020-06-24 | 278 | 27,511 |
| 2020-06-25 | 271 | 30,780 |
| 2020-06-26 | 256 | 33,492 |
| 2020-06-27 | 253 | 28,633 |
| 2020-06-28 | 228 | 27,127 |
| 2020-06-29 | 235 | 23,759 |
| 2020-06-30 | 213 | 26,056 |
| 2020-07-01 | 208 | 24,322 |
| 2020-07-02 | 149 | 24,194 |
| 2020-07-03 | 154 | 21,425 |
| 2020-07-05 | 139 | 23,792 |
| 2020-07-06 | 134 | 17,303 |
| 2020-07-07 | 130 | 15,122 |
| 2020-07-08 | 123 | 22,832 |
| 2020-07-09 | 123 | 26,326 |
| 2020-07-10 | 117 | 27,484 |
| 2020-07-11 | 128 | 29,522 |
| 2020-07-12 | 120 | 25,726 |
| 2020-07-13 | 133 | 20,896 |
| 2020-07-14 | 137 | 16,744 |
| 2020-07-15 | 115 | 23,769 |
| 2020-07-16 | 107 | 26,492 |
| 2020-07-17 | 108 | 31,163 |
| 2020-07-18 | 105 | 28,849 |
| 2020-07-19 | 104 | 26,890 |
| 2020-07-20 | 116 | 20,913 |
| 2020-07-21 | 121 | 22,974 |
| 2020-07-22 | 128 | 23,990 |
| 2020-07-23 | 154 | 26,001 |
| 2020-07-24 | 141 | 28,809 |
| 2020-07-25 | 97 | 29,904 |
| 2020-07-26 | 90 | 26,144 |
| 2020-07-27 | 91 | 24,664 |
| 2020-07-28 | 97 | 17,334 |
| 2020-07-29 | 92 | 27,308 |
| 2020-07-30 | 85 | 27,676 |
| 2020-07-31 | 78 | 30,033 |
| 2020-08-01 | 79 | 33,282 |
| 2020-08-02 | 75 | 30,443 |
| 2020-08-03 | 78 | 23,021 |
| 2020-08-04 | 82 | 19,169 |
| 2020-08-05 | 66 | 17,229 |
| 2020-08-06 | 71 | 26,181 |
| 2020-08-07 | 66 | 25,136 |
| 2020-08-08 | 54 | 26,008 |
| 2020-08-09 | 56 | 27,771 |
| 2020-08-10 | 49 | 22,275 |
| 2020-08-11 | 60 | 21,581 |
| 2020-08-12 | 49 | 24,572 |
| 2020-08-13 | 42 | 29,626 |
| 2020-08-14 | 40 | 30,137 |
| 2020-08-15 | 38 | 30,436 |
| 2020-08-16 | 36 | 23,813 |
| 2020-08-17 | 33 | 25,567 |
| 2020-08-18 | 40 | 23,067 |
| 2020-08-19 | 41 | 25,642 |
| 2020-08-20 | 34 | 25,917 |
| 2020-08-21 | 36 | 28,073 |
| 2020-08-22 | 40 | 28,656 |
| 2020-08-23 | 43 | 23,384 |
| 2020-08-24 | 41 | 18,790 |
| 2020-08-25 | 40 | 20,013 |
| 2020-08-26 | 44 | 21,960 |
| 2020-08-27 | 48 | 28,625 |
| 2020-08-28 | 62 | 31,823 |
| 2020-08-29 | 53 | 32,106 |
| 2020-08-30 | 51 | 24,970 |
| 2020-08-31 | 49 | 25,098 |
| 2020-09-01 | 65 | 23,545 |
| 2020-09-02 | 60 | 24,004 |
| 2020-09-03 | 60 | 26,298 |
| 2020-09-04 | 66 | 28,591 |
| 2020-09-05 | 58 | 28,672 |
| 2020-09-06 | 52 | 28,955 |
| 2020-09-07 | 55 | 23,725 |
| 2020-09-08 | 54 | 20,929 |
| 2020-09-09 | 55 | 17,605 |
| 2020-09-10 | 54 | 24,669 |
| 2020-09-11 | 48 | 32,501 |
| 2020-09-12 | 43 | 35,618 |
| 2020-09-13 | 39 | 31,143 |
| 2020-09-14 | 47 | 29,540 |
| 2020-09-15 | 47 | 27,664 |
| 2020-09-16 | 46 | 28,761 |
| 2020-09-17 | 52 | 35,134 |
| 2020-09-18 | 58 | 35,826 |
| 2020-09-19 | 64 | 38,940 |
| 2020-09-20 | 64 | 40,127 |
| 2020-09-21 | 69 | 31,753 |
| 2020-09-22 | 82 | 34,201 |
| 2020-09-23 | 88 | 35,436 |
| 2020-09-24 | 88 | 30,634 |
| 2020-09-25 | 89 | 41,865 |
| 2020-09-26 | 100 | 43,238 |
| 2020-09-27 | 111 | 42,509 |
| 2020-09-28 | 128 | 41,111 |
| 2020-09-29 | 138 | 38,375 |
| 2020-09-30 | 151 | 35,753 |
| 2020-10-01 | 162 | 39,646 |
| 2020-10-02 | 167 | 40,093 |
| 2020-10-03 | 155 | 46,254 |
| 2020-10-04 | 166 | 39,661 |
| 2020-10-05 | 174 | 38,196 |
| 2020-10-06 | 192 | 42,031 |
| 2020-10-07 | 195 | 43,277 |
| 2020-10-08 | 208 | 48,488 |
| 2020-10-09 | 226 | 44,914 |
| 2020-10-10 | 212 | 44,298 |
| 2020-10-11 | 216 | 44,138 |
| 2020-10-12 | 205 | 36,473 |
| 2020-10-13 | 234 | 31,233 |
| 2020-10-14 | 232 | 32,206 |
| 2020-10-15 | 252 | 39,961 |
| 2020-10-16 | 262 | 38,507 |
| 2020-10-17 | 278 | 44,722 |
| 2020-10-18 | 251 | 40,850 |
| 2020-10-19 | 253 | 31,864 |
| 2020-10-20 | 274 | 24,049 |
| 2020-10-21 | 263 | 32,646 |
| 2020-10-22 | 270 | 38,860 |
| 2020-10-23 | 276 | 40,019 |
| 2020-10-24 | 294 | 44,151 |
| 2020-10-25 | 284 | 38,769 |
| 2020-10-26 | 310 | 28,652 |
| 2020-10-27 | 313 | 23,945 |
| 2020-10-28 | 312 | 30,010 |
| 2020-10-29 | 324 | 35,621 |
| 2020-10-30 | 315 | 41,008 |
| 2020-10-31 | 321 | 41,920 |
| 2020-11-01 | 330 | 37,133 |
| 2020-11-02 | 349 | 27,908 |
| 2020-11-03 | 357 | 25,279 |
| 2020-11-04 | 367 | 28,567 |
| 2020-11-05 | 385 | 35,754 |
| 2020-11-06 | 380 | 41,268 |
| 2020-11-07 | 395 | 39,165 |
| 2020-11-08 | 381 | 37,577 |
| 2020-11-09 | 378 | 28,401 |
| 2020-11-10 | 423 | 29,125 |
| 2020-11-11 | 424 | 36,707 |
| 2020-11-12 | 433 | 39,559 |
| 2020-11-13 | 452 | 40,509 |
| 2020-11-14 | 503 | 44,837 |
| 2020-11-15 | 485 | 42,206 |
| 2020-11-16 | 505 | 33,351 |
| 2020-11-17 | 529 | 26,468 |
| 2020-11-18 | 535 | 33,440 |
| 2020-11-19 | 525 | 41,838 |
| 2020-11-20 | 518 | 48,173 |
| 2020-11-21 | 513 | 46,671 |
| 2020-11-22 | 497 | 46,389 |
| 2020-11-23 | 516 | 37,471 |
| 2020-11-24 | 547 | 27,053 |
| 2020-11-25 | 540 | 36,076 |
| 2020-11-26 | 555 | 47,576 |
| 2020-11-27 | 559 | 58,037 |
| 2020-11-28 | 595 | 55,086 |
| 2020-11-29 | 597 | 53,959 |
| 2020-11-30 | 629 | 39,406 |
| 2020-12-01 | 645 | 34,640 |
| 2020-12-02 | 655 | 44,226 |
| 2020-12-03 | 669 | 52,873 |
| 2020-12-04 | 693 | 56,001 |
| 2020-12-05 | 724 | 59,399 |
| 2020-12-06 | 724 | 59,251 |
| 2020-12-07 | 754 | 45,283 |
| 2020-12-08 | 800 | 39,198 |
| 2020-12-09 | 816 | 48,546 |
| 2020-12-10 | 833 | 61,809 |
| 2020-12-11 | 816 | 63,051 |
| 2020-12-12 | 863 | 65,260 |
| 2020-12-13 | 846 | 58,190 |
| 2020-12-14 | 877 | 57,091 |
| 2020-12-15 | 930 | 39,566 |
| 2020-12-16 | 939 | 49,189 |
| 2020-12-17 | 923 | 58,178 |
| 2020-12-18 | 883 | 68,246 |
| 2020-12-19 | 896 | 67,207 |
| 2020-12-20 | 899 | 69,412 |
| 2020-12-21 | 942 | 54,505 |
| 2020-12-22 | 1,005 | 45,265 |
| 2020-12-23 | 1,002 | 56,660 |
| 2020-12-24 | 967 | 64,592 |
| 2020-12-25 | 997 | 61,465 |
| 2020-12-26 | 982 | 49,511 |
| 2020-12-27 | 1,035 | 41,783 |
| 2020-12-28 | 1,128 | 39,565 |
| 2020-12-29 | 1,168 | 34,112 |
| 2020-12-30 | 1,230 | 39,210 |
| 2020-12-31 | 1,270 | 63,858 |
| 2021-01-01 | 1,269 | 70,570 |
| 2021-01-02 | 1,287 | 61,401 |
| 2021-01-03 | 1,333 | 49,803 |
| 2021-01-04 | 1,390 | 39,121 |
| 2021-01-05 | 1,435 | 35,152 |
| 2021-01-06 | 1,480 | 51,045 |
| 2021-01-07 | 1,483 | 65,772 |
| 2021-01-08 | 1,507 | 71,481 |
| 2021-01-09 | 1,516 | 72,900 |
| 2021-01-10 | 1,541 | 62,308 |
| 2021-01-11 | 1,596 | 46,403 |
| 2021-01-12 | 1,714 | 44,802 |
| 2021-01-13 | 1,687 | 50,931 |
| 2021-01-14 | 1,674 | 71,169 |
| 2021-01-15 | 1,667 | 76,472 |
| 2021-01-16 | 1,646 | 73,875 |
| 2021-01-17 | 1,621 | 60,183 |
| 2021-01-18 | 1,612 | 40,301 |
| 2021-01-19 | 1,632 | 34,531 |
| 2021-01-20 | 1,597 | 54,307 |
| 2021-01-21 | 1,534 | 70,256 |
| 2021-01-22 | 1,517 | 71,750 |
| 2021-01-23 | 1,506 | 63,453 |
| 2021-01-24 | 1,471 | 48,947 |
| 2021-01-25 | 1,435 | 35,968 |
| 2021-01-26 | 1,480 | 30,717 |
| 2021-01-27 | 1,393 | 55,191 |
| 2021-01-28 | 1,335 | 64,664 |
| 2021-01-29 | 1,292 | 69,040 |
| 2021-01-30 | 1,273 | 59,594 |
| 2021-01-31 | 1,184 | 49,352 |
| 2021-02-01 | 1,185 | 30,359 |
| 2021-02-02 | 1,195 | 28,552 |
| 2021-02-03 | 1,072 | 52,418 |
| 2021-02-04 | 1,104 | 64,467 |
| 2021-02-05 | 1,046 | 62,710 |
| 2021-02-06 | 1,027 | 62,341 |
| 2021-02-07 | 959 | 51,658 |
| 2021-02-08 | 950 | 28,303 |
| 2021-02-09 | 986 | 30,798 |
| 2021-02-10 | 934 | 52,504 |
| 2021-02-11 | 888 | 68,812 |
| 2021-02-12 | 833 | 62,012 |
| 2021-02-13 | 791 | 58,760 |
| 2021-02-14 | 753 | 48,701 |
| 2021-02-15 | 780 | 30,355 |
| 2021-02-16 | 782 | 27,005 |
| 2021-02-17 | 726 | 33,977 |
| 2021-02-18 | 763 | 56,165 |
| 2021-02-19 | 695 | 65,372 |
| 2021-02-20 | 709 | 57,194 |
| 2021-02-21 | 707 | 48,178 |
| 2021-02-22 | 709 | 31,163 |
| 2021-02-23 | 724 | 25,979 |
| 2021-02-24 | 683 | 54,852 |
| 2021-02-25 | 698 | 66,351 |
| 2021-02-26 | 682 | 64,049 |
| 2021-02-27 | 705 | 59,416 |
| 2021-02-28 | 663 | 49,185 |
| 2021-03-01 | 682 | 35,015 |
| 2021-03-02 | 681 | 30,767 |
| 2021-03-03 | 667 | 52,613 |
| 2021-03-04 | 647 | 65,643 |
| 2021-03-05 | 643 | 64,748 |
| 2021-03-06 | 625 | 57,829 |
| 2021-03-07 | 625 | 46,586 |
| 2021-03-08 | 662 | 38,063 |
| 2021-03-09 | 701 | 33,264 |
| 2021-03-10 | 686 | 54,149 |
| 2021-03-11 | 688 | 60,619 |
| 2021-03-12 | 681 | 64,611 |
| 2021-03-13 | 698 | 58,431 |
| 2021-03-14 | 675 | 47,618 |
| 2021-03-15 | 728 | 33,975 |
| 2021-03-16 | 771 | 28,526 |
| 2021-03-17 | 748 | 49,128 |
| 2021-03-18 | 737 | 58,560 |
| 2021-03-19 | 767 | 56,134 |
| 2021-03-20 | 772 | 52,083 |
| 2021-03-21 | 801 | 49,233 |
| 2021-03-22 | 848 | 31,089 |
| 2021-03-23 | 858 | 32,556 |
| 2021-03-24 | 896 | 51,962 |
| 2021-03-25 | 901 | 60,077 |
| 2021-03-26 | 918 | 53,436 |
| 2021-03-27 | 991 | 61,005 |
| 2021-03-28 | 984 | 50,227 |
| 2021-03-29 | 1,023 | 39,470 |
| 2021-03-30 | 1,093 | 36,071 |
| 2021-03-31 | 1,117 | 52,532 |
Footnotes
[1] The FAO’s first list of COVID-19-related response measures was published in September 2020. See FAO, “Federal and Provincial COVID-19 Response Measures,” 2020.
[2] Direct support measures include increased spending (spending measures) or reduced revenue (revenue measures). The federal and provincial governments have also implemented liquidity measures (e.g., deferring tax payments or providing interest-free loans), which are reviewed in the appendix of this report.
[3] As of September 2020, the federal government’s share of direct support measures was 97 per cent ($102.0 billion) and the provincial government’s share was three per cent ($3.6 billion). See FAO, “Federal and Provincial COVID-19 Response Measures,” 2020.
[4] For 2020-21, by quarter, the FAO estimates that provincial spending on COVID-19 direct support measures was $2.4 billion (11.5 per cent) in the first quarter, $2.8 billion (13.6 per cent) in the second quarter, $4.9 billion (23.6 per cent) in the third quarter, and $10.5 billion (51.2 per cent) in the fourth quarter.
[5] The FAO’s first list of COVID-19-related response measures was published in September 2020. See FAO, “Federal and Provincial COVID-19 Response Measures,” 2020.
[6] Information on liquidity support measures is included in the appendix.
[7] Includes 12 liquidity measures with a budget balance impact.
[8] Excludes unallocated COVID-19-related funds of $5.0 billion ($2.2 billion in 2021-22 and $2.8 billion in 2022-23), as announced in the 2021-22 First Quarter Finances and 2021 Ontario Budget. The FAO’s total for provincial direct support measures only includes specific measures that have been announced.
[9] Combined with provincial liquidity support measures (see appendix for details), total provincial COVID-19 response measures are estimated at $45.7 billion over four years, from 2019-20 to 2022-23. This is $5.3 billion less than the Province’s estimate of $51 billion over four years reported in the 2021 Ontario Budget (p. ix).
[10] As of September 2020, the federal government’s share of direct support measures was 97 per cent ($102.0 billion) and the provincial government’s share was three per cent ($3.6 billion). See FAO, “Federal and Provincial COVID-19 Response Measures,” 2020.
[11] For information on the target of support for only provincial direct support measures, see the appendix.
[12] Federal cash transfers to the Province are categorized based on the ultimate beneficiary of the spending.
[13] For information on what has changed since September 2020 for only provincial direct support measures, see the appendix.
[14] Based on information as of April 2021, the FAO estimates that it will cost $1.3 billion and take 3.5 years to clear the elective surgery and non-emergent procedures backlog, with $556 million (43 per cent) of the estimated cost projected to be spent by 2022-23. For more information, see FAO, “Ministry of Health: Spending Plan Review,” 2021.
[15] Excludes the federal Safe Long-term Care Fund, which would provide $388 million to Ontario. As of the writing of this report, the Province and federal government have not reached an agreement on this potential funding. The FAO has also excluded two federal government infrastructure transfers from its analysis of COVID-19 response measures: the COVID-19 Resilience Stream of the Investing in Canada Infrastructure Program and the Canada Community-Building Fund (previously called the Gas Tax Fund).
[16] Includes revenue measures.
[17] Reallocated spending and savings include decisions by the Province to repurpose funds from non-COVID-19-related programs and also the use of savings from non-COVID-19-related program budgets that resulted from the impact of the COVID-19 pandemic (i.e., changes in behaviour, such as lower demand for physician services, that resulted in program savings).
[18] Average monthly OW and ODSP beneficiaries declined by 9.3 per cent and 0.3 per cent, respectively, in 2020-21 compared to 2019-20.
[19] For more information on program savings in 2020-21, see FAO, “Expenditure Monitor 2020-21: Q4,” 2021.
[20] The FAO has adjusted estimated spending to a cash basis from an accrual expense basis where known.
[21] See appendix for more information.
[22] The total cost of the Ontario Small Business Support Grant is estimated to be $3.0 billion, with $1.3 billion in cash spending in the fourth quarter of 2020-21 and the remaining $1.6 billion in 2021-22.
[23] For more information on provincial direct support measures in the health sector, see FAO, “Ministry of Health: Spending Plan Review,” 2021.
[24] For more information on provincial direct support measures for schools and child care, see FAO, “Ministry of Education: Spending Plan Review,” 2021.
[25] After accounting for a $2.6 billion increase in federal cash transfers since September 2020, the net cost to the province of its direct support measures increased by $22.0 billion.
[26] Total estimated support excludes seven liquidity measures where a liquidity support estimate is not available (five federal and two provincial).
[27] Excludes liquidity measures provided by the Bank of Canada, the Canada Mortgage and Housing Corporation, and commercial lenders, as well as capital relief provided by the Office of the Superintendent of Financial Institutions.
[28] The two new liquidity measures are Supporting Jobs and Safe Operations of Junior Mining Companies, which extends the timelines for spending the capital raised via flow-through shares by 12 months, and Highly Affected Sectors Credit Availability Program, which provides low-interest loans up to $1 million to businesses that are heavily impacted by the COVID-19 pandemic.
[29] In 2020-21, there were approximately 217,000 hospital days occupied by COVID-19 patients and 12.6 million COVID-19 laboratory tests completed. Based on information as of August 13, 2021 from COVID-19 cases in hospital and ICU, by Ontario Health (OH) region, Ministry of Health, and the Ontario COVID-19 Data Tool, Public Health Ontario.
[30] Public sources of information include the 2020-21 Public Accounts of Ontario, 2021 Ontario Budget, 2021 Federal Budget, letters to and agreements with service partners (such as municipalities and transit agencies), and other government news releases.
[31] For more information, see, “Government of Canada COVID-19 Authorities and Expenditures.”
[32] For more information, see, “PBO's Costing of Canada's Economic Response Plan.”


