Table of Abbreviations
|
Abbreviation |
Long Form |
|---|---|
|
FAO |
Financial Accountability Office |
|
FES |
Fall Economic Statement |
|
GGRA |
Greenhouse Gas Reduction Account |
|
LHINs |
Local Health Integration Networks |
|
MOHLTC |
Ministry of Health and Long-Term Care |
|
MPP |
Member of Provincial Parliament |
|
OHIP |
Ontario Health Insurance Program |
|
OMA |
Ontario Medical Association |
|
SCE |
Standing Committee on Estimates |
1 | Essential Points
Overview
- On November 29, 2018, the Government of Ontario (the Province) tabled in the Legislative Assembly the 2018-19 Expenditure Estimates. The Expenditure Estimates (or Estimates) set out the fiscal year’s spending requirements for ministries and legislative offices[1] and constitute the government’s formal request to the legislature for approval to spend the amounts as detailed in the Estimates. After reviewing the Estimates, Members of Provincial Parliament (MPPs) approve the government’s spending request through passage of the annual Supply Bill.[2]
- In the 2018-19 Expenditure Estimates, the Province is requesting spending authority through the Supply Bill of $140.7 billion for expenses and $5.1 billion for investments for total Supply Bill spending authority of $145.8 billion.[3]
2018-19 Expenditure Estimates, Supply Bill spending request, billions of dollars
|
($ billions) |
Expenses |
Investments |
Total |
|---|---|---|---|
|
Supply Bill spending request |
140.7 |
5.1 |
145.8 |
Source: FAO analysis of volume 1 of the 2018-19 Expenditure Estimates.
Key Issues for 2018-19
2018-19 Expenditure Estimates and the 2018 Fall Economic Statement
- The government presented an updated 2018-19 spending plan in the 2018 Ontario Economic Outlook and Fiscal Review (also known as the Fall Economic Statement or FES) on November 15, 2018 and, on November 29, 2018, tabled in the legislature its 2018-19 Expenditure Estimates. However, the 2018-19 Expenditure Estimates were not updated to reflect the spending plan presented in the Fall Economic Statement and instead presents the spending plan from the 2018 Ontario Budget.
- The 2018 Ontario Budget had a total expense plan for 2018-19 of $158.5 billion, while the 2018 Fall Economic Statement has an expense plan of $161.8 billion, an increase of $3.3 billion (see table below). Based on the FAO’s review, the $3.3 billion expense increase represents a $0.1 billion net increase in Supply Bill spending, a $0.9 billion net increase in spending by standalone legislation, a $0.8 billion net increase in other spending and a $1.4 billion net increase resulting from the elimination of savings targets included in the 2018 Ontario Budget. None of these changes are reflected in the 2018-19 Expenditure Estimates.
2018-19 fiscal year spending plans, 2018-19 Expenditure Estimates compared to the 2018 Fall Economic Statement, billions of dollars
|
($ billions) |
2018-19 Expenditure Estimates / |
2018 Fall Economic Statement |
Variance |
|---|---|---|---|
|
Supply Bill |
140.7 |
140.8 |
0.1 |
|
Standalone legislation |
16.8 |
17.7 |
0.9 |
|
Other spending |
2.1 |
2.9 |
0.8 |
|
Legislative offices |
0.4 |
0.4 |
0 |
|
Savings targets |
-1.4 |
0 |
1.4 |
|
Total |
158.5 |
161.8 |
3.3 |
Note: This analysis does not include any changes in investments between the 2018-19 Expenditure Estimates / 2018 Ontario Budget and the 2018 Fall Economic Statement.
Source: FAO analysis of the 2018 Ontario Budget, 2018 Fall Economic Statement, 2018-19 Expenditure Estimates and information provided by the Province.
- The $0.1 billion increase in Supply Bill spending from the 2018-19 Expenditure Estimates to the Fall Economic Statement means that the government’s formal request to the legislature for Supply Bill spending authority is less than the current spending forecast.[4] Since the government cannot spend more on Supply Bill funded programs than authorized under the Supply Act, the Province will need to identify savings of $0.1 billion.
- Moreover, the $0.1 billion net increase reflects spending changes to approximately 40 of the 128 ministry expense programs funded through the Supply Bill.[5] This means that, for over 30 per cent of ministry programs, the spending request in the 2018-19 Expenditure Estimates does not reflect current government plans.[6]
Impact on the Standing Committee on Estimates
- After the government tables the Expenditure Estimates, the Standing Committee on Estimates (SCE) is mandated to review the Estimates of six to twelve ministries and report back to the House.[7] Overall, the SCE’s review of the Estimates provides a valuable opportunity for MPPs to scrutinize the government’s spending plan and to support MPPs’ review of the annual Supply Bill.
- The 2018-19 Expenditure Estimates were tabled in the legislature by the government on November 29, 2018. As the Estimates were tabled after mid-November, the SCE did not have an opportunity to review the 2018-19 Expenditure Estimates.[8]
Supply Bill Spending: Ministry Programs
- In 2018-19, the Province is requesting $140.7 billion in Supply Bill spending authority for ministry program expenses and $5.1 billion for ministry program investments.
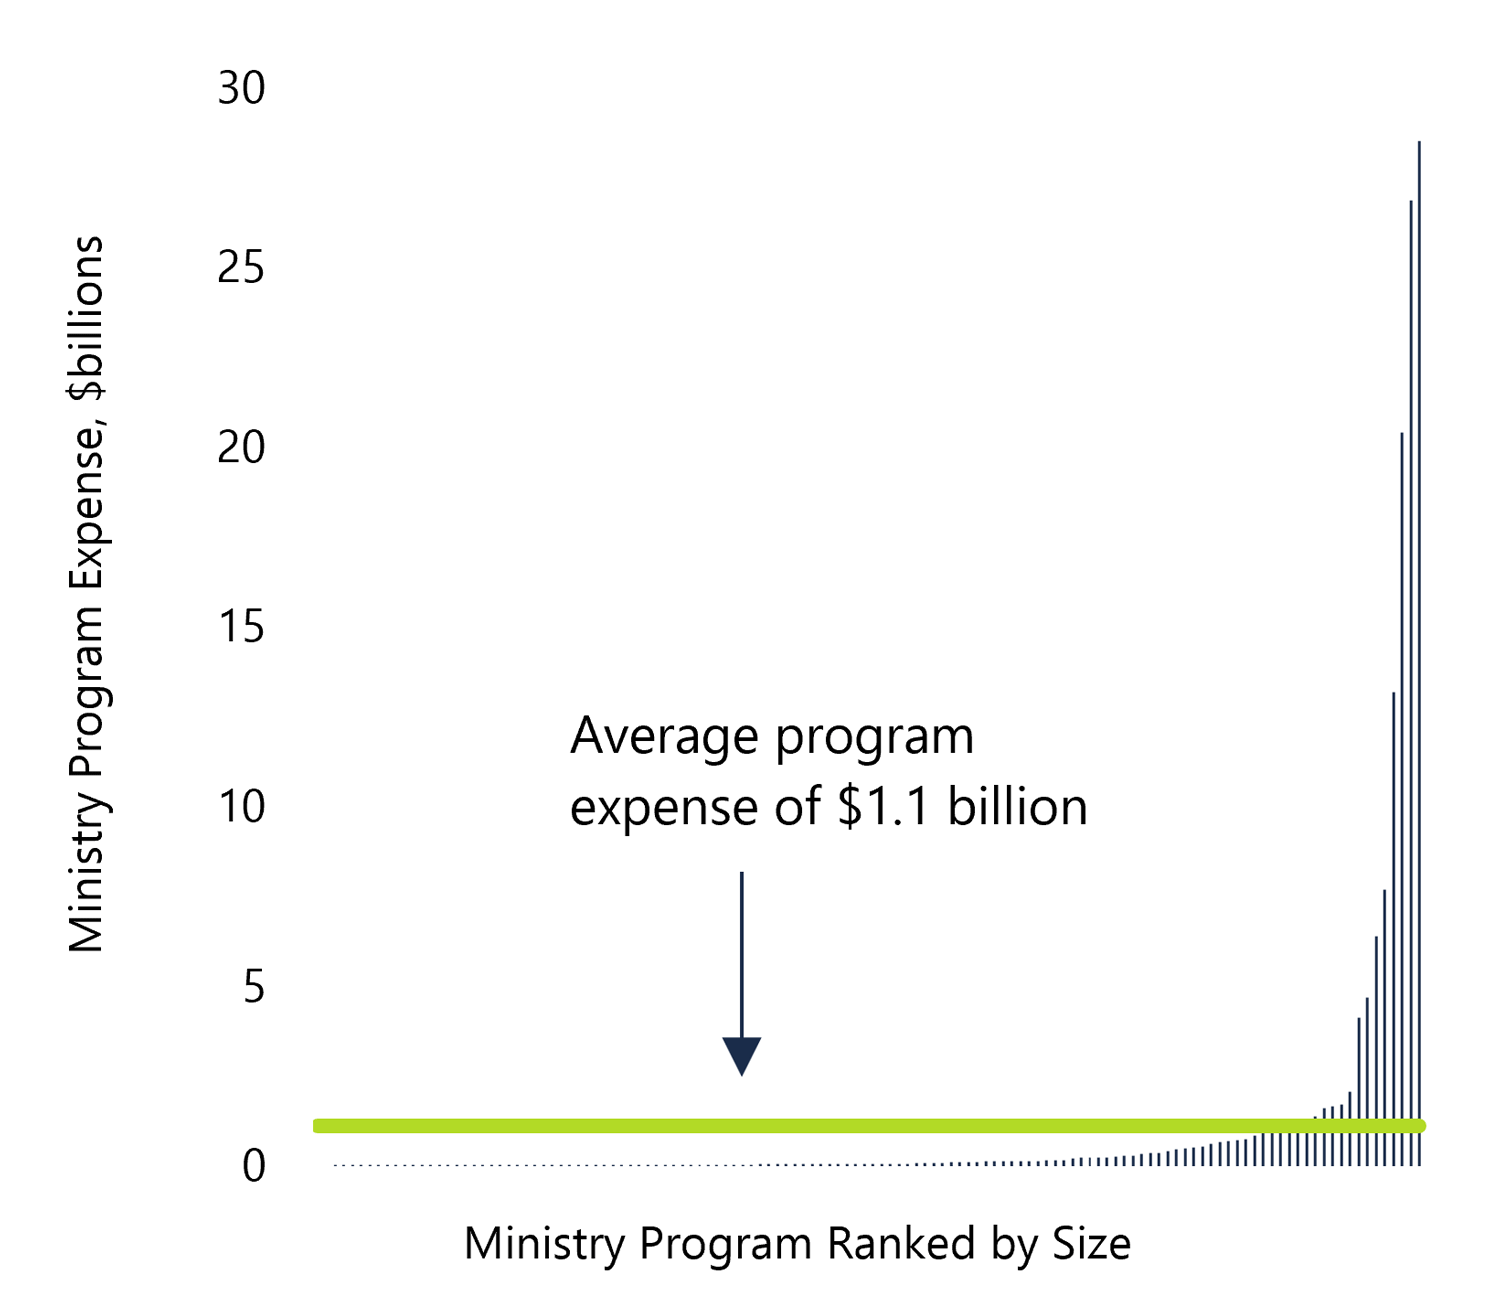
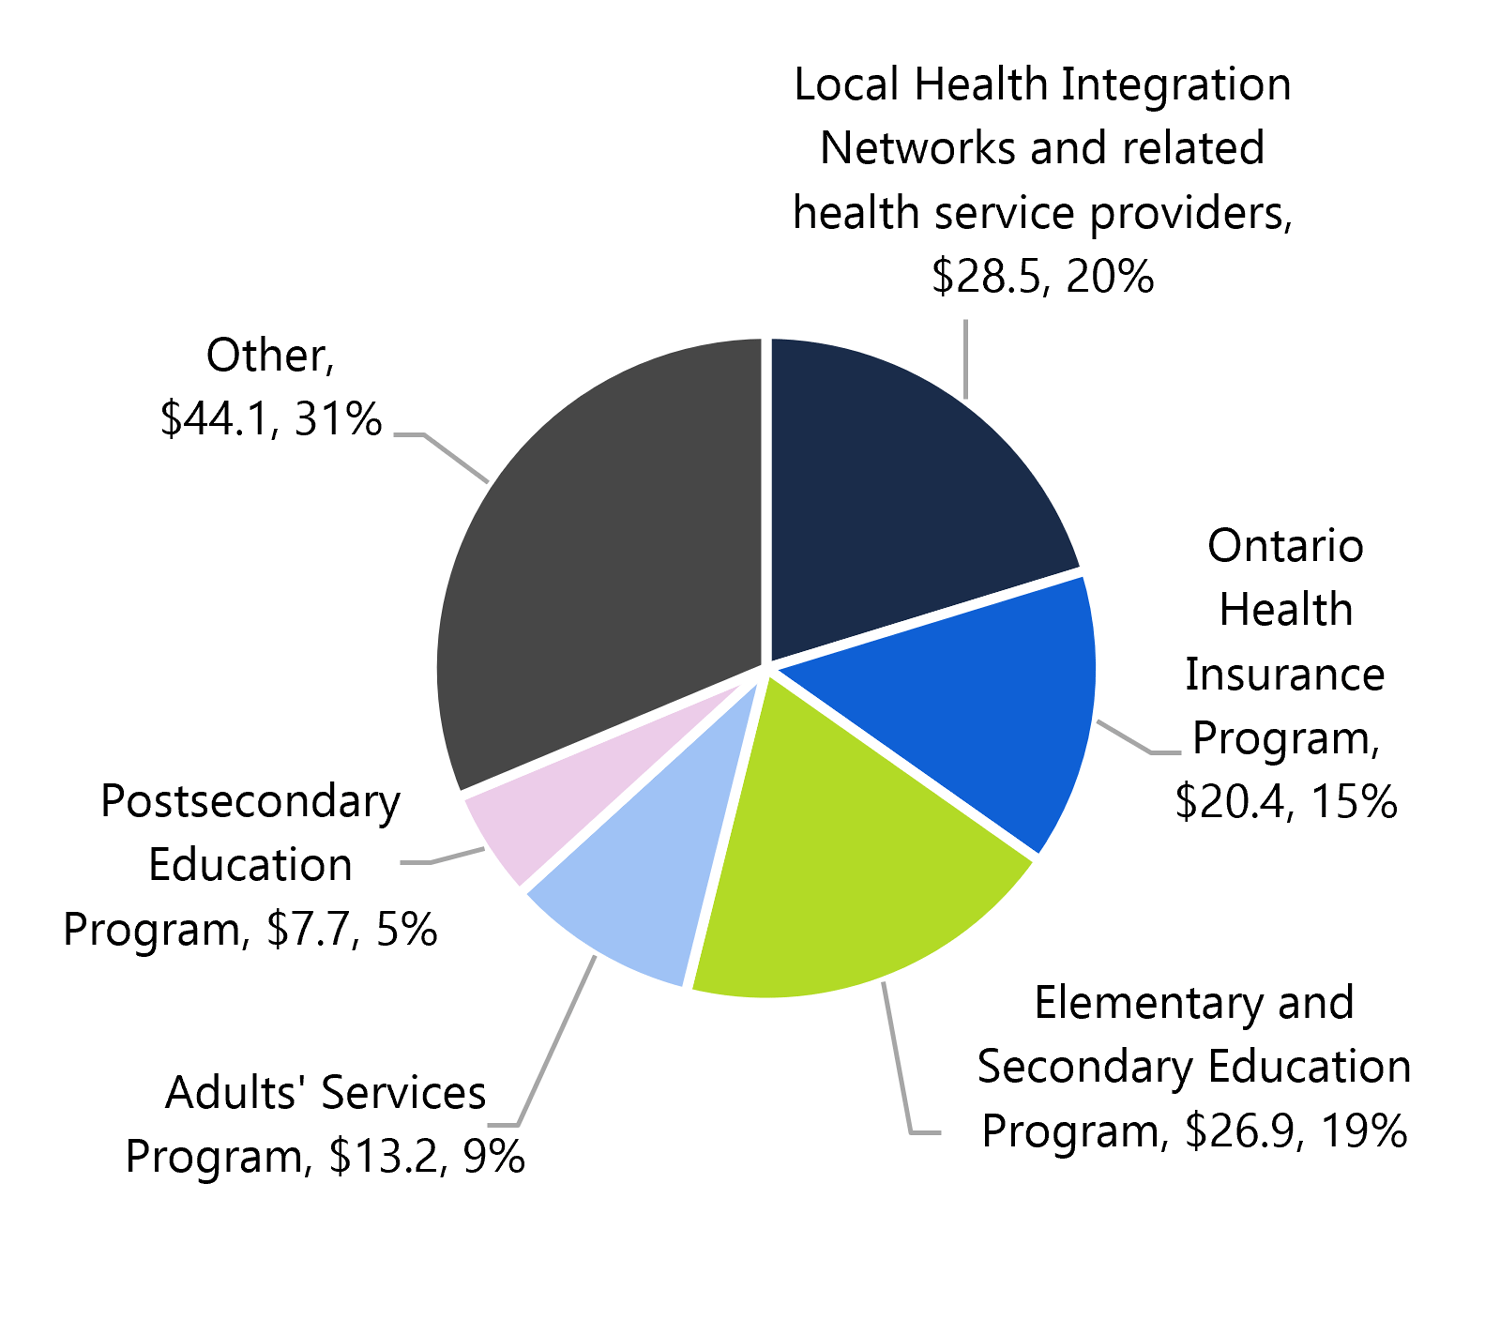
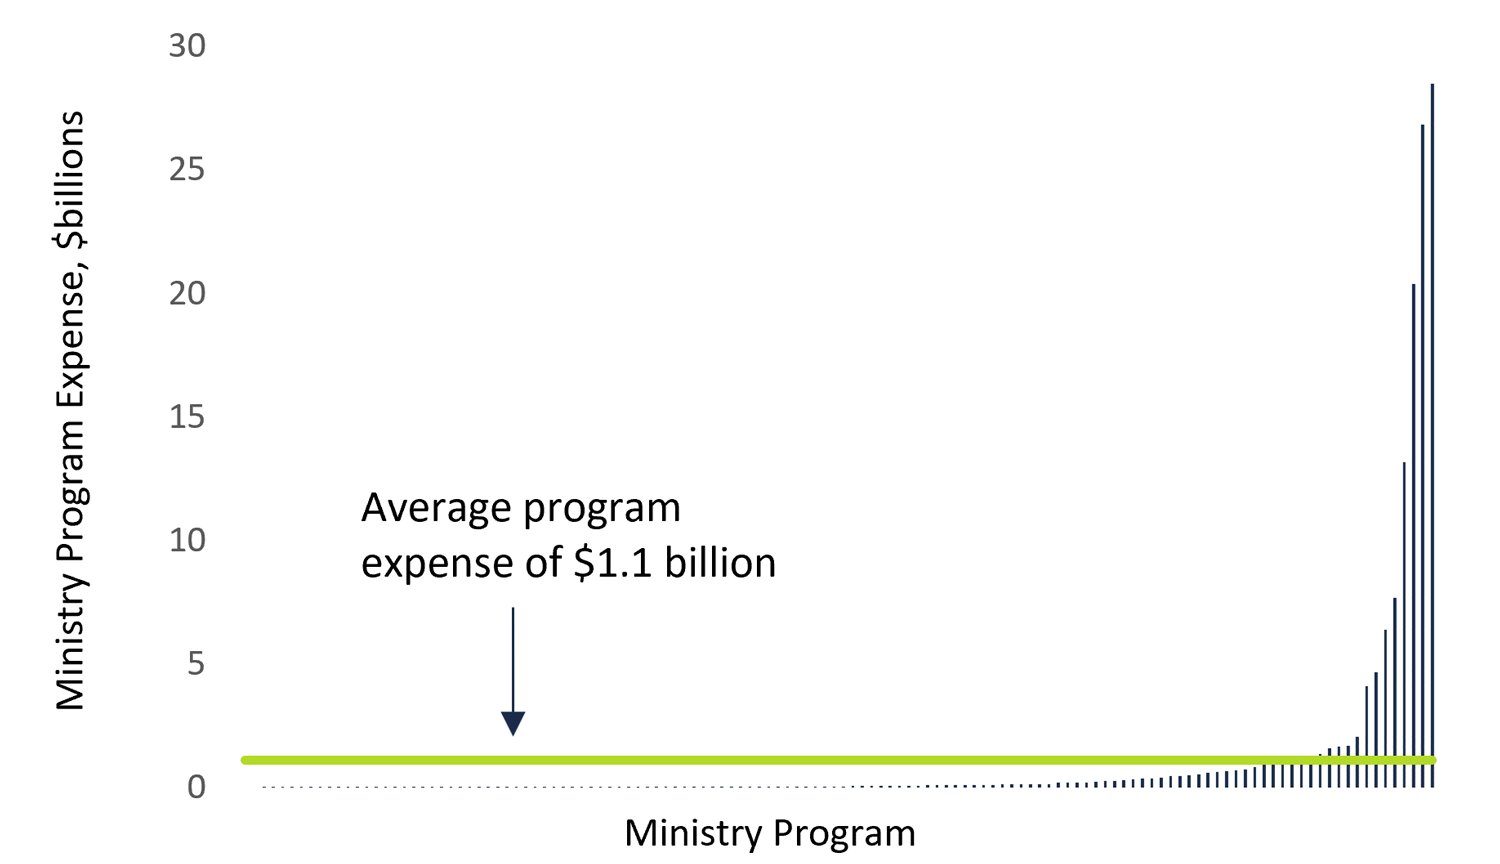
- Overall, the $140.7 billion in ministry program expense is to be allocated to 128 programs (known in the Estimates as votes) with a median program expense of $57 million and an average program expense of $1.1 billion. Moreover, five programs account for almost 70 per cent of requested Supply Bill expense spending.
Ministry program expense, ranked from least to most expensive, 2018-19, billions of dollars
Source: FAO analysis of the 2018-19 Expenditure Estimates.
Five programs account for almost 70 per cent of requested Supply Bill expense,billions of dollars
Source: FAO analysis of the 2018-19 Expenditure Estimates.
- For program level spending analysis, including growth rates and recent developments, see chapter 4.
2 | Introduction
Overview
On November 29, 2018, the Government of Ontario (the Province) tabled in the Legislative Assembly the 2018-19 Expenditure Estimates. The Expenditure Estimates (or Estimates) set out the fiscal year’s spending requirements for ministries and legislative offices[9] and constitute the government’s formal request to the legislature for approval to spend the amounts as detailed in the Estimates. After reviewing the Estimates, Members of Provincial Parliament (MPPs) approve the government’s spending request through passage of the annual Supply Bill.[10]
In the 2018-19 Expenditure Estimates, the Province is requesting spending authority through the Supply Bill of $140.7 billion for expenses and $5.1 billion for investments for total Supply Bill spending authority of $145.8 billion.[11]
2018-19 Expenditure Estimates, Supply Bill spending request, billions of dollars
|
($ billions) |
Expenses |
Investments |
Total |
|---|---|---|---|
|
Supply Bill spending request |
140.7 |
5.1 |
145.8 |
Source: FAO analysis of volume 1 of the 2018-19 Expenditure Estimates.
The purpose of this report is to analyze the 2018-19 Expenditure Estimates in order to support MPPs’ review of the 2018-19 Supply Bill. The report begins with a review of key issues for the current fiscal year, including how the 2018-19 Expenditure Estimates compare to the government’s 2018 Ontario Economic Outlook and Fiscal Review (also known as the Fall Economic Statement or FES). The report then looks at the largest spending programs funded through the Supply Bill and identifies spending trends and recent developments.
Appendix C provides more information on the development of this report.
Background
How Spending in Ontario is Authorized
In Ontario, the majority of spending each year is authorized by the legislature through the passage of the annual Supply Bill.[12] However, spending also occurs each year through standalone legislation[13], and through provincial agencies and broader public sector entities controlled by the Province (such as hospitals, colleges and school boards) that can raise and spend their own funds[14] and other minor adjustments.[15] Together, these three spending components represent the Province’s total annual spending plan as presented in the Ontario budget, with actual results reported at the end of the year in the Public Accounts of Ontario.
The Expenditure Estimates provide details on the government’s total spending plan for the upcoming fiscal year by spending category (Supply Bill spending, standalone legislation spending and other spending), and also include program and sub-program level information (known as votes and items). However, only Supply Bill spending (known as spending “to be voted”) is included in the Supply Act for MPP approval. Details on standalone legislation spending and other spending is provided in the Estimates for information purposes only.
How the Supply Bill Spending Process Works in Ontario
In Ontario, the Supply Bill spending process begins before the start of the fiscal year with the passage of the Interim Appropriation Act. This legislation is typically passed months before the start of the Province’s April 1st fiscal year and allows Supply Bill spending to occur until the passage of the Supply Act.[16]
Near the start of the fiscal year, the government presents its Ontario budget, followed soon after by the Expenditure Estimates, which formally request the Supply Bill spending component of the Province’s expense plan outlined in the Ontario budget.[17]
After the Estimates are tabled in the legislature, the Standing Committee on Estimates begins its scrutiny of the government’s spending request by selecting between six and twelve ministries for review. This review continues until mid-November, after which the Estimates are reported back to the House. The Supply Bill is then formally introduced for approval by all MPPs.
Ontario’s annual Supply Bill spending cycle
Source: FAO.
3 | Key Issues for 2018-19
For the 2018-19 fiscal year, the “typical” Supply Bill spending process, as described in chapter 2, has not occurred, largely due to the timing of the June 7, 2018 provincial election.
In December 2017, the Interim Appropriation for 2018-2019 Act, 2017 was passed, which secured interim Supply Bill spending authority for most of 2018-19. This was followed in March 2018 with the 2018 Ontario Budget and then the tabling of the 2018-19 Expenditure Estimates in April. However, with the dissolution of the legislature in May, the 2018-19 Expenditure Estimates were voided.
After the election, the new government presented its updated 2018-19 spending plan on November 15, 2018 in the Fall Economic Statement and, on November 29, 2018, tabled in the legislature its 2018-19 Expenditure Estimates. However, the 2018-19 Expenditure Estimates were not updated to reflect the spending plan presented in the Fall Economic Statement and instead presents the spending plan from the 2018 Ontario Budget.
The following two sections of this chapter review how the government’s request for Supply Bill spending authority in the 2018-19 Expenditure Estimates compares to the spending plan in the 2018 Fall Economic Statement, and provides considerations regarding the Standing Committee on Estimates.
2018-19 Expenditure Estimates and the 2018 Fall Economic Statement
As noted above, the 2018-19 Expenditure Estimates reflect the spending plan from the 2018 Ontario Budget, not the 2018 Fall Economic Statement.
The 2018 Ontario Budget had a total expense plan for 2018-19 of $158.5 billion, while the 2018 Fall Economic Statement has an expense plan of $161.8 billion, an increase of $3.3 billion. Based on the FAO’s review, the $3.3 billion expense increase represents a $0.1 billion net increase in Supply Bill spending, a $0.9 billion net increase in spending by standalone legislation, a $0.8 billion net increase in other spending and a $1.4 billion net increase resulting from the elimination of savings targets included in the 2018 Ontario Budget. None of these changes are reflected in the 2018-19 Expenditure Estimates (see Figure 1).
Figure 1: 2018-19 fiscal year spending plans, 2018-19 Expenditure Estimates compared to the 2018 Fall Economic Statement, billions of dollars
|
($ billions) |
2018-19 Expenditure Estimates / |
2018 Fall Economic Statement |
Variance |
|---|---|---|---|
|
Supply Bill |
140.7 |
140.8 |
0.1 |
|
Standalone legislation |
16.8 |
17.7 |
0.9 |
|
Other spending |
2.1 |
2.9 |
0.8 |
|
Legislative offices |
0.4 |
0.4 |
0.0 |
|
Savings targets |
-1.4 |
0.0 |
1.4 |
|
Total |
158.5 |
161.8 |
3.3 |
Note: This analysis does not include any changes in investments between the 2018-19 Expenditure Estimates / 2018 Ontario Budget and the 2018 Fall Economic Statement. Source: FAO analysis of the 2018 Ontario Budget, 2018 Fall Economic Statement, 2018-19 Expenditure Estimates and information provided by the Province.
The $0.1 billion increase in Supply Bill spending from the 2018-19 Expenditure Estimates to the Fall Economic Statement means that the government’s formal request to the legislature for Supply Bill spending authority is less than the current spending forecast.[18] Since the government cannot spend more on Supply Bill funded programs than authorized under the Supply Act, the Province will need to identify savings of $0.1 billion.
Moreover, the $0.1 billion net increase reflects spending changes to approximately 40 of the 128 ministry expense programs funded through the Supply Bill.[19] This means that, for over 30 per cent of ministry programs, the spending request in the 2018-19 Expenditure Estimates does not reflect current government plans.
Importantly, for each ministry program, the Supply Act ensures that the government does not spend more than the amount presented in the Expenditure Estimates.[20] However, the legislature has delegated authority to the Treasury Board, a Cabinet committee, to increase spending for a program, beyond the amount approved in the Expenditure Estimates, if the spending is offset by reduced spending on another program.[21] Therefore, Treasury Board Orders will be required to adjust the spending levels of ministry programs to reflect the Province’s 2018 Fall Economic Statement.[22]
The following section reviews in more detail the $0.1 billion net spending adjustment from the 2018-19 Expenditure Estimates to the 2018 Fall Economic Statement.
Changes from the 2018-19 Expenditure Estimates to the 2018 Fall Economic Statement
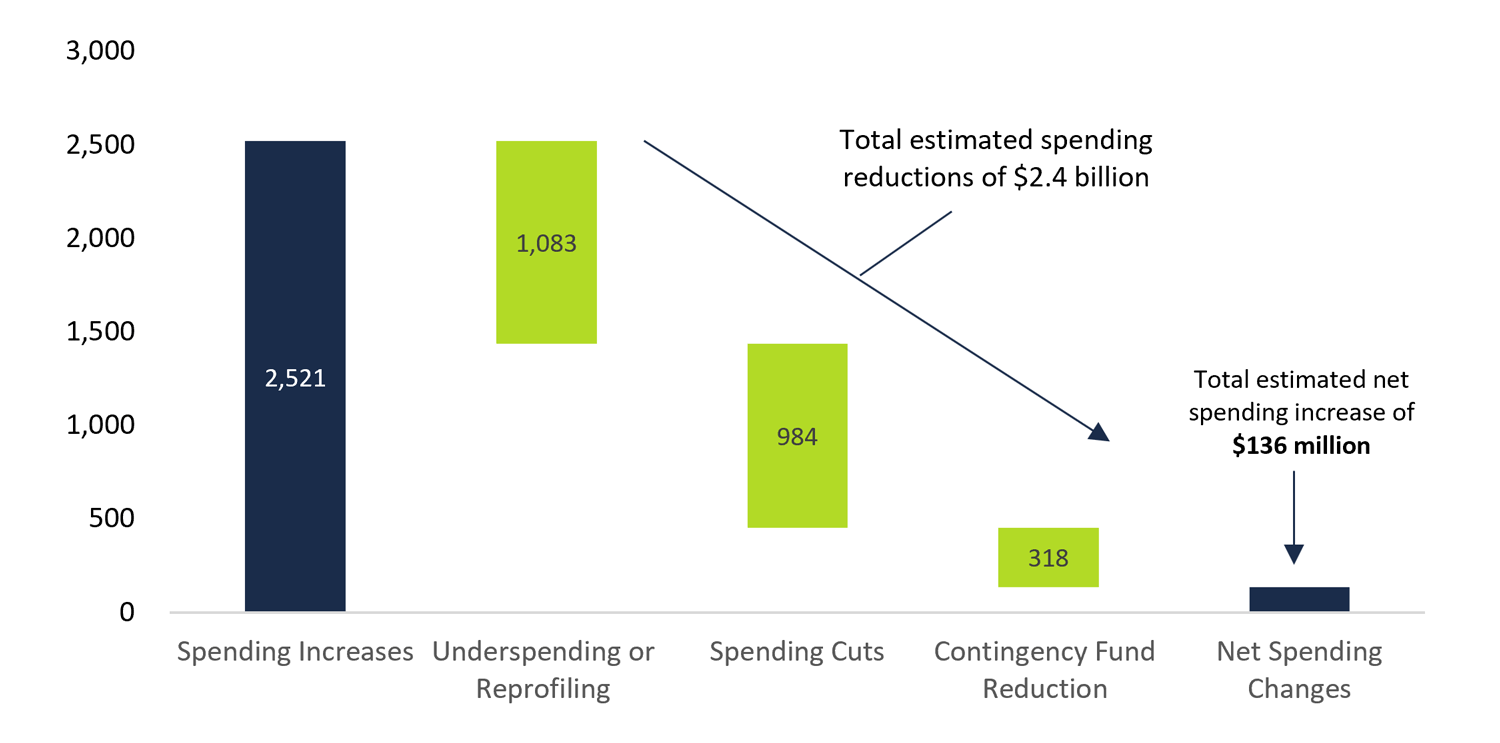
Overall, the FAO estimates that the government has made changes to approximately 40 programs for a net increase in planned Supply Bill spending of $0.1 billion. However, this small net increase masks several large changes among programs.
Planned spending changes from the 2018-19 Expenditure Estimates to the 2018 Fall Economic Statement, millions of dollars
Source: FAO analysis of the 2018-19 Expenditure Estimates, the 2018 Fall Economic Statement and information provided by the Province.
The FAO estimates Supply Bill spending has increased by approximately $2.5 billion for 10 programs compared to the amounts presented in the 2018-19 Estimates. The biggest change is an increase for the Electricity Price Mitigation program resulting from the government’s decision to adjust the accounting treatment for the global adjustment refinancing component of the Fair Hydro Plan.[23]Other programs that are expected to spend more than requested in the Estimates include the Public Protection program for emergency forest firefighting and the Local Health Integration Networks (LHINs) and Related Health Service Providers program to increase hospital capacity.[24]
The FAO estimates Supply Bill spending has decreased by a total of $2.4 billion for over 30 programs compared to the amounts presented in the 2018-19 Expenditure Estimates. This includes a $1.1 billion spending reduction due to program underspending or reprofiling of program expenses to future years, a $1.0 billion spending reduction resulting from permanent spending cuts, and a $0.3 billion reduction in cash allocated to the contingency fund.[25] Notable program spending reductions announced in the 2018 Fall Economic Statement include a permanent spending cut to the Adults’ Services Program from the new government’s decision to replace the previous government’s planned 3.0 per cent increase in social assistance rates with a 1.5 per cent increase, and underspending in the Employment Ontario Program.[26]
Impact on the Standing Committee on Estimates
After the government tables the Expenditure Estimates, the Standing Committee on Estimates (SCE) is mandated to review the Estimates of six to twelve ministries and report back to the House.[27] This work typically begins after the Expenditure Estimates are tabled in the legislature in the spring and concludes by mid-November.[28] Overall, the SCE’s review of the Estimates provides a valuable opportunity for MPPs to scrutinize the government’s spending plan and to support MPPs’ review of the annual Supply Bill.
After the June 7, 2018 election, the new membership of the Standing Committee on Estimates was appointed on July 26, 2018. However, as the new government had not yet tabled the 2018-19 Expenditure Estimates in the legislature, the SCE could not begin its review of the Estimates.
On November 29, 2018, the 2018-19 Expenditure Estimates were tabled in the legislature by the government. As the Estimates were tabled after mid-November, the SCE did not have an opportunity to review the 2018-19 Expenditure Estimates.[29]
4 | Supply Bill Spending: Ministry Programs
In 2018-19, the Province is requesting $140.7 billion in Supply Bill spending authority for ministry program expenses.[30] Overall, the $140.7 billion is to be allocated to 128 programs (known in the Estimates as votes) with a median program expense of $57 million and an average program expense of $1.1 billion.
Ministry program expense, ranked from least to most expensive, 2018-19, billions of dollars
Source: FAO analysis of the 2018-19 Expenditure Estimates.
As depicted above, there are a relatively small number of programs that account for most of the $140.7 billion in requested spending. In fact, five programs account for almost 70 per cent of requested Supply Bill spending for ministry expense (see Figure 2, below). The LHINs and Related Health Service Providers program makes up 20 per cent of Supply Bill spending, followed by Elementary and Secondary Education Program (19 per cent), Ontario Health Insurance Program (OHIP) (15 per cent), Adults’ Services Program (9 per cent) and Postsecondary Education Program (5 per cent).
Figure 2: Five programs account for almost 70 per cent of requested Supply Bill expense, billions of dollars

Note: Numbers may not add due to rounding.
Source: FAO analysis of the 2018-19 Expenditure Estimates.
Local Health Integration Networks (LHINs) and Related Health Service Providers (vote 1411)
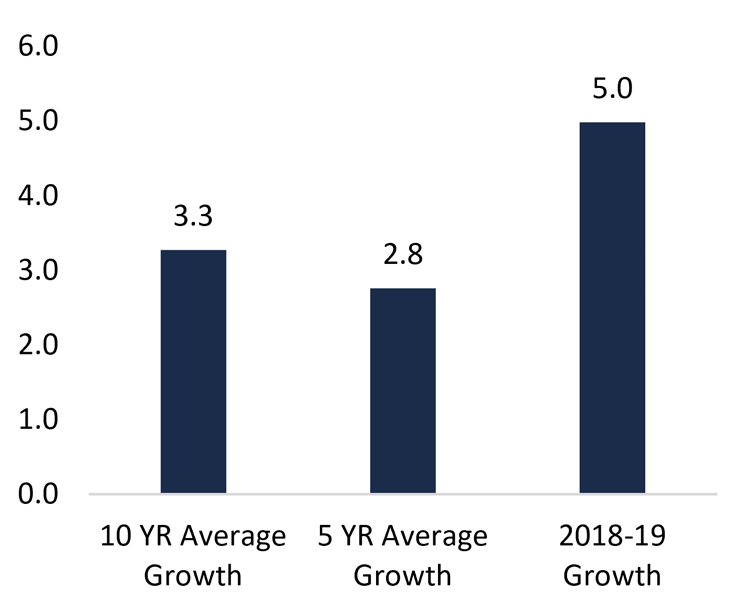
Overview: at $28.5 billion, spending for the Local Health Integration Networks and Related Health Service Providers program represents approximately 20 per cent of all requested Supply Bill spending for ministry expense.
LHINs and Related Health Service Providers growth rates (%)
Source: FAO analysis of the 2018-19 Expenditure Estimates and the Public Accounts of Ontario.
Funding for this program flows from the Ministry of Health and Long-Term Care (MOHLTC) to 14 LHINs in the form of transfer payments.[31] LHINs in turn are responsible for allocating funding to the health service providers (hospitals, long-term care homes and Community Health Centres) in their local network.[32] The LHIN’s must allocate funds as directed by MOHLTC but do have some flexibility based on regional needs.
Despite being the largest Supply Bill spending program, there is very little information included in the Estimates on how the $28.5 billion will be spent. The Estimates do provide information on how much funding will be allocated to each of the 14 LHINs, however, there is no information on how much funding will be allocated by hospital, long-term care home or community program. The FAO estimates that over $18 billion in program funding will be transferred through the LHINs to hospitals, approximately $4 billion will be allocated to long-term care homes and approximately $6 billion to community programs.
Growth rates: for 2018-19, the $28.5 billion spending request is an increase of 5.0 per cent from 2017-18. This spending increase is higher than both the 10-year and 5-year growth rate averages of 3.3 per cent and 2.8 per cent, respectively. The low 5-year average growth rate is primarily due to the slow growth in hospital funding that occurred from 2011-12 to 2016-17. The increase to 5.0 per cent in 2018-19 is due to increases in operating funding for hospitals and added capacity for hospitals and community care.
Fall Economic Statement changes: the Fall Economic Statement announced increased spending in this program for hospital and community bed spaces.[33]
Ontario Health Insurance Program (vote 1405)
Overview: at $20.4 billion, spending for OHIP represents approximately 15 per cent of all requested Supply Bill spending for ministry expense. OHIP supplies funding to three sub-programs: Ontario Health Insurance ($15.1 billion), Drug Programs ($4.8 billion), and the Assistive Devices Program ($0.5 billion).
The Ontario Health Insurance sub-program funds coverage for over 6,000 health care services provided by physicians, optometrists, dental surgeons and podiatrists.[34]
The Drug Programs sub-program provides funding for Ontario’s six drug benefit programs. Eligibility for public drug programs is based on the individual’s age, income, type of drugs required and whether or not they are recipients of long-term or home care services. The drug programs cover over 4,400 products including prescription drugs, diabetic test strips and nutrition products. The majority of drug funding flows through the Ontario Drug Benefit Program which covers Ontarians aged 65 and older and 24 and younger.
The Assistive Devices Program provides funding for people with long-term physical disabilities to pay for equipment such as wheelchairs and hearing aids.
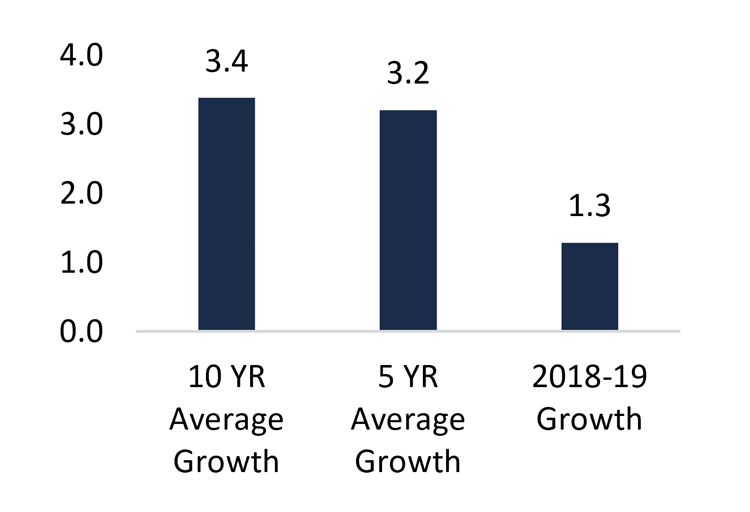
Growth rates: for 2018-19, the $20.4 billion spending request is an increase of 1.3 per cent from 2017-18. This spending increase is lower than both the 10-year and 5-year growth rate averages of 3.4 per cent and 3.2 per cent, respectively.
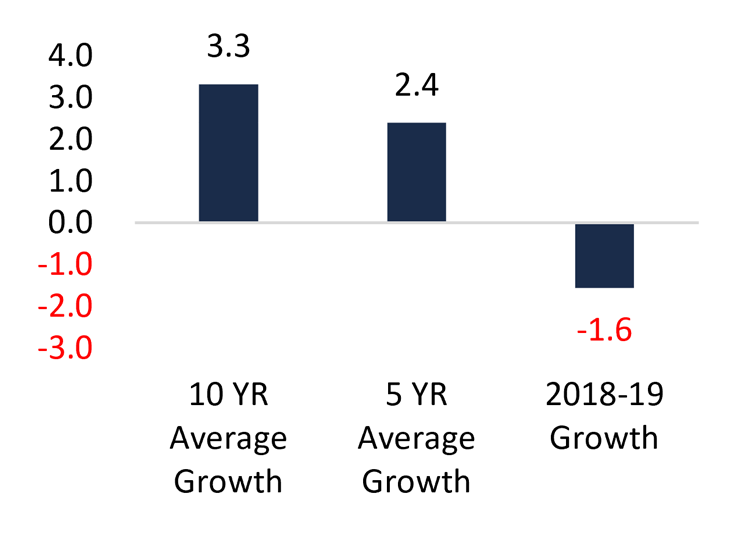
At the sub-program level, the spending request for the Ontario Health Insurance sub-program is down 1.6 per cent from 2017-18. Spending in 2017-18 grew by 8.1 per cent from 2016-17 due to higher demand for primary care. This could result in program pressures in 2018-19 if the higher than anticipated program demand continues.[35]
OHIP, growth rates (%)
Source: FAO analysis of the 2018-19 Expenditure Estimates and the Public Accounts of Ontario.
Ontario Health Insurance sub-program, growth rates (%)
Source: FAO analysis of the 2018-19 Expenditure Estimates and the Public Accounts of Ontario.
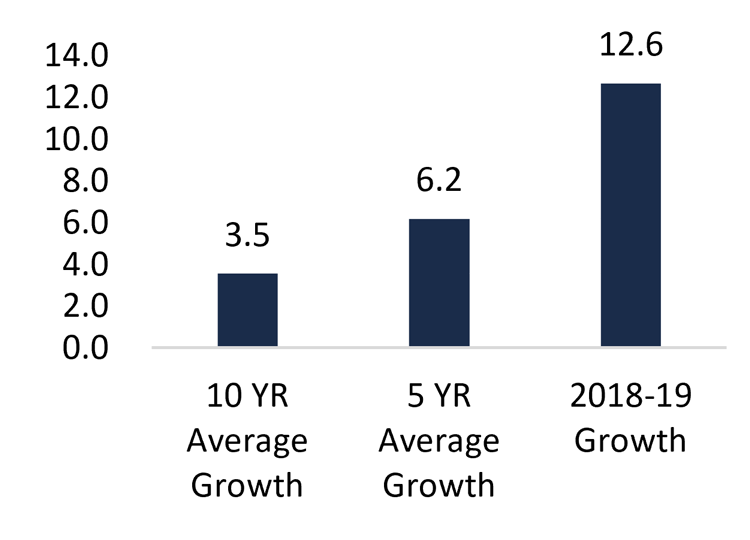
Drug Programs, growth rates (%)
Source: FAO analysis of the 2018-19 Expenditure Estimates and the Public Accounts of Ontario.
5-year and 10-year Drug Programs spending growth averaged 6.2 per cent and 3.5 per cent, respectively, however, there were large year-to-year variations in growth due to changes in the cost of drugs. Between 2010 and 2014 the expiry of patents on many popular brand name drugs placed downward pressure on the growth of drug spending as cheaper generic alternatives became available.[36] High growth rates of 9.3 per cent in 2017-18 and 12.6 per cent in 2018-19 were primarily due to new drug programs that were introduced by the Province. In January of 2018 the Province introduced OHIP+ which provided Ontarians under the age of 24 with drug coverage.
Fall Economic Statement changes: the FAO estimates no material Fall Economic Statement changes to this program.[37]
Elementary and Secondary Education Program (vote 1002)
Overview: the Elementary and Secondary Education Program is the second largest ministry expense program in the 2018-19 Expenditure Estimates, accounting for $26.9 billion in requested Supply Bill spending authority.
Over 90 per cent of program spending is transferred to school boards to administer elementary and secondary education. The School Board Operating Grant and the Education Property Tax Non-Cash Expense jointly fund the Grants for Student Needs – the primary mechanism for allocating funding among the Province’s 72 school boards.
The Elementary and Secondary Education Program also provides funding for curriculum development and program delivery, educational television programming through TVOntario and Télévision française de l'Ontario, and student achievement assessments through the Education Quality and Accountability Office.
Growth rates: for 2018-19, the $26.9 billion spending request is an increase of 4.5 per cent from 2017-18. This growth rate is higher than the five-year average of 2.7 per cent due to above average capital spending grants and increased funding for school boards.
Elementary and Secondary Education Program, growth rates (%)
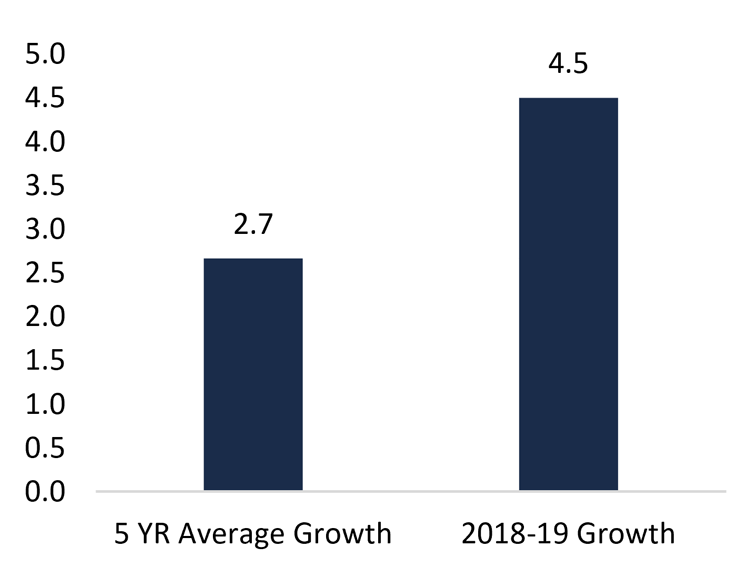
Note: The FAO has excluded a 10 YR growth rate due to accounting policy changes in 2010-11.
Source: FAO analysis of the 2018-19 Expenditure Estimates and the Public Accounts of Ontario.
Fall Economic Statement changes: the FAO estimates no material Fall Economic Statement changes to this program.[38]
Adults’ Services Program (vote 702)
Overview: at $13.2 billion, requested spending for the Adults’ Services Program represents 9 per cent of total Supply Bill spending in 2018-19.
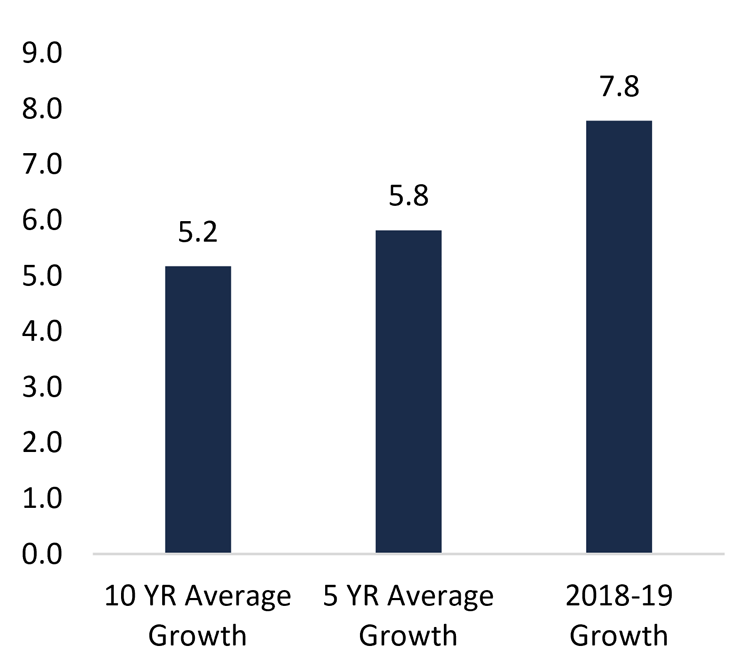
Adults’ Services Program, growth rates (%)
Source: FAO analysis of the 2018-19 Expenditure Estimates and the Public Accounts of Ontario.
The program provides funding to a variety of sub-programs, including social assistance programs ($10.1 billion for programs such as Ontario Works, the Ontario Disability Support Program and the Ontario Drug Benefit Plan) and community and developmental services programs ($3.0 billion for programs such as community and residential supports for adults with developmental disabilities, and support for women experiencing violence, human trafficking victims and survivors, and other residential services).
Growth rates: for 2018-19, the $13.2 billion spending request is an increase of 7.8 per cent from 2017-18. This spending increase is higher than both the 10-year and 5-year growth rate averages of 5.2 per cent and 5.8 per cent, respectively. The 7.8 per cent spending increase for 2018-19 is largely due to planned increases, announced in the 2018 Ontario Budget, in benefit rates for Ontario Works and the Ontario Disability Support Program,[39] and increased funding for community supports and residential services for people living with developmental disabilities.[40]
Fall Economic Statement Changes: the FAO estimates that program spending requirements have been reduced from the amount requested in the 2018-19 Expenditure Estimates due to the new government’s decision to replace the previous government’s planned 3.0 per cent increase in social assistance rates with a 1.5 per cent increase.[41]
Postsecondary Education Program (vote 3002)
Overview: the Postsecondary Education Program provides operating and capital grants to the Province’s colleges and universities and also funds student financial aid programs. In 2018-19, the Supply Bill funding request for the program totals $7.7 billion including:
- $1.7 billion for operating grants for colleges;
- $3.7 billion for operating grants for universities;
- $1.8 billion for student financial assistance programs; and
- $0.4 billion for capital programs.
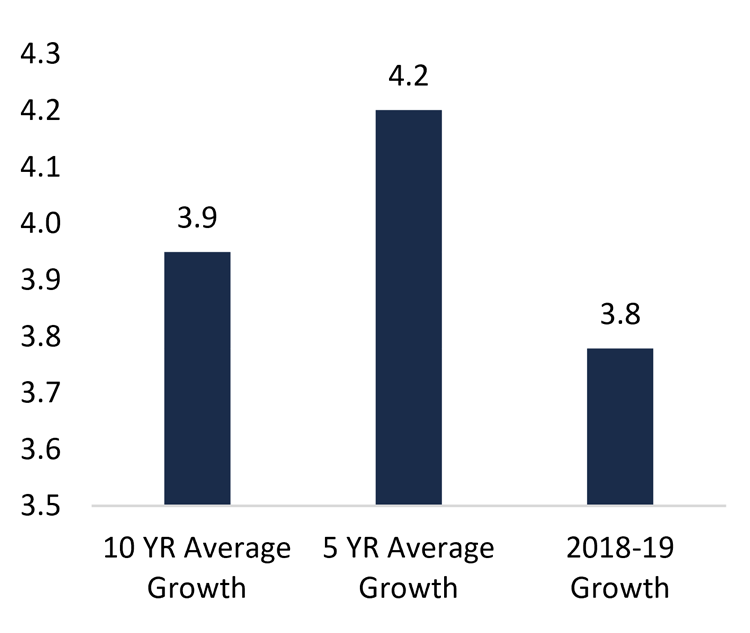
Growth rates: this year, total program funding is expected to increase by 3.8 per cent, down from the 4.2 per cent average annual growth experienced over the past five years. Spending over the last five years was above the 10-year average due to higher spending on the student financial assistance and capital programs. 2018-19 could experience program spending pressures if the increased cost in the student financial assistance programs identified by the Auditor General of Ontario continues.[42]
Fall Economic Statement changes: total spending at the Ministry of Training, Colleges and Universities has been reduced by $414 million from the 2018 Ontario Budget to the 2018 FES.[43]
Postsecondary Education Program, growth rates (%)
Source: FAO analysis of the 2018-19 Expenditure Estimates and the Public Accounts of Ontario.
Fastest growing programs in 2018-19, growth rates (%)
Source: FAO analysis of the 2018-19 Expenditure Estimates and the Public Accounts of Ontario.
Other Programs
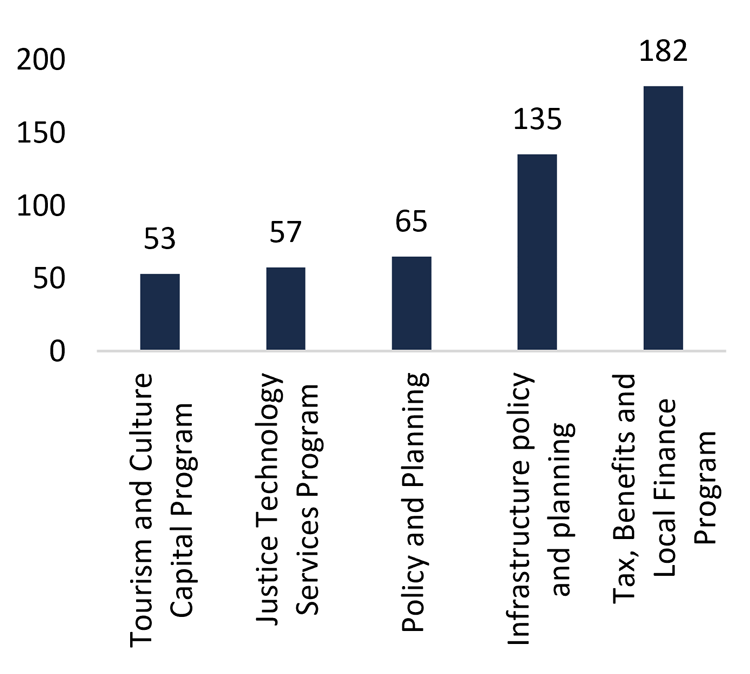
The Province is requesting $44.1 billion in Supply Bill spending for the remaining 123 expense programs, for an average expected program cost of about $360 million. A number of these programs are experiencing sharp year-over-year growth, ranging from 50 per cent to over 180 per cent.
- The Ministry of Finance’s Tax, Benefits and Local Finance Program is expected to grow by 1.8 times. This is due to the inclusion of the Municipal Support Programs sub-program, which was previously included in the Economic, Fiscal and Financial Policy Program.
- The Ministry of Infrastructure’s Infrastructure Policy and Planning program is expected to grow by 1.3 times, likely due to the amount of lapsed infrastructure spending in 2017-18 which may have been reprofiled to future years.[44]
- The Ministry of Transportation’s Policy and Planning program is expected grow by 65 per cent, likely due to the amount of lapsed infrastructure spending in 2017-18 which may have been reprofiled to future years.[45]
- The Ministry of Community Safety and Correctional Services’ Justice Technology Services Program is expected to grow by 57 per cent due to a large increase in transportation and communication expenses.
- The Tourism and Culture Capital Program is expected to grow by 53 per cent due to a large increase in grant funding.
5 | Appendices
Appendix A: Provincial Spending through Standalone Legislation and Other Spending
The 2018-19 Expenditure Estimates includes information on $18.9 billion in planned spending that is not authorized through the Supply Act. This information is included in the Estimates for information purposes, in order to reconcile total spending with the Ontario budget.
The non-Supply Bill spending includes $16.8 billion in spending authorized by standalone legislation and $2.1 billion in other spending, largely for provincial agencies and broader public sector entities controlled by the Province (such as hospitals, colleges and school boards) that can raise and spend their own funds.
Standalone Legislation Spending
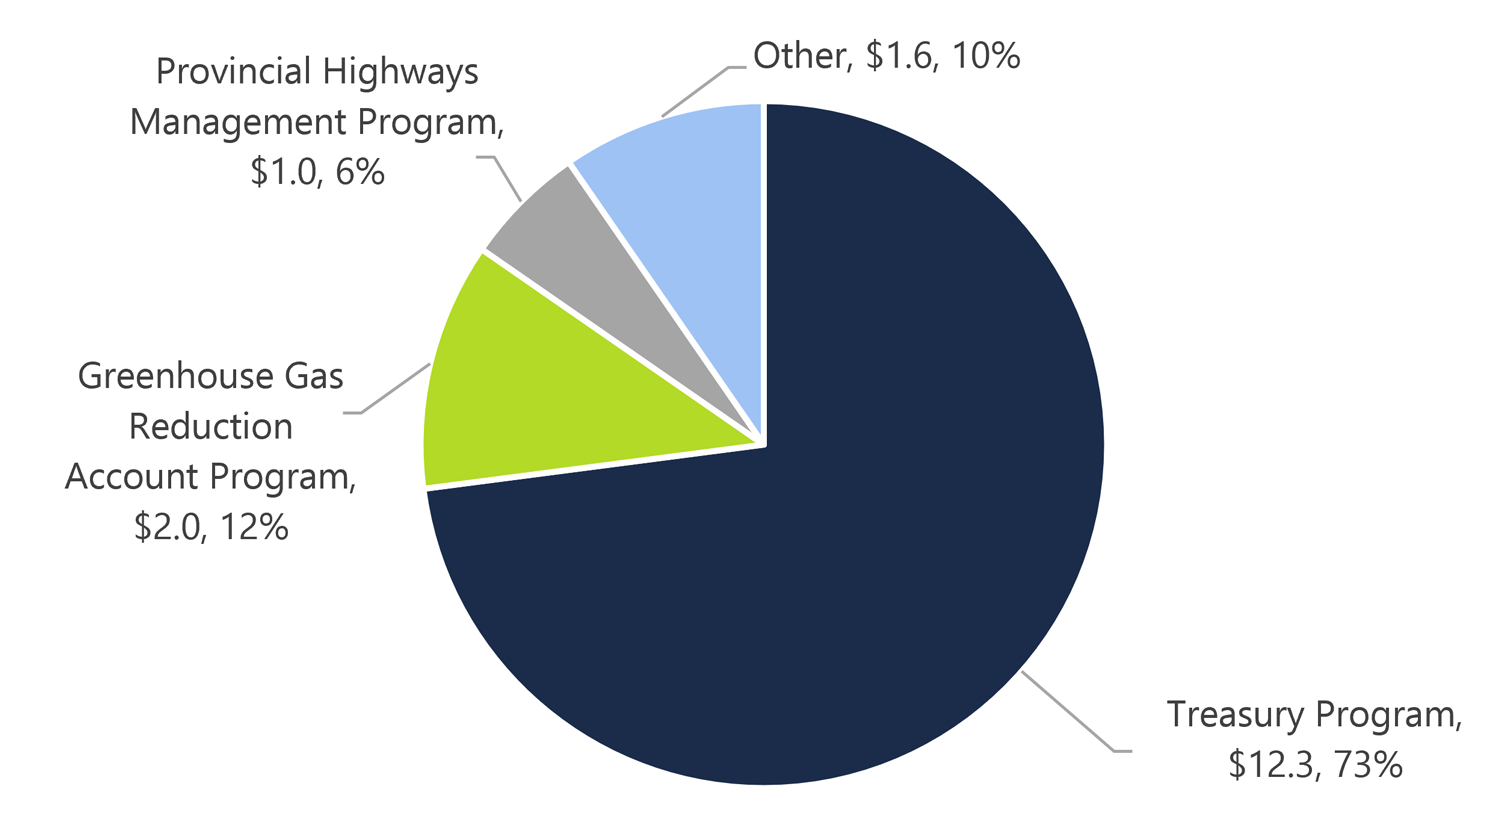
The 2018-19 Expenditure Estimates include $16.8 billion in projected spending on programs that are authorized by other legislation. The Treasury Program, which includes interest on debt payments, accounts for roughly 75 per cent of all standalone spending. Other significant standalone spending programs include the Greenhouse Gas Reduction Account (GGRA) program, under the recently cancelled cap and trade program, and amortization expenses related to the Provincial Highways Management Program.
Standalone legislation spending in the 2018-19 Expenditure Estimates, billions of dollars
Source: FAO analysis of the 2018-19 Expenditure Estimates.
Other Spending
The 2018-19 Expenditure Estimates include $2.1 billion in other spending, which is mostly related to the consolidation of provincial agencies and broader public sector entities that are controlled by the Province. The majority of spending by these entities occurs with funds provided by the Province through transfer payments. This funding is authorized through the annual Supply Bill. However, some spending occurs with funds raised independently by the entities. This spending is included in the Estimates for information purposes but is not authorized through the annual Supply Bill.
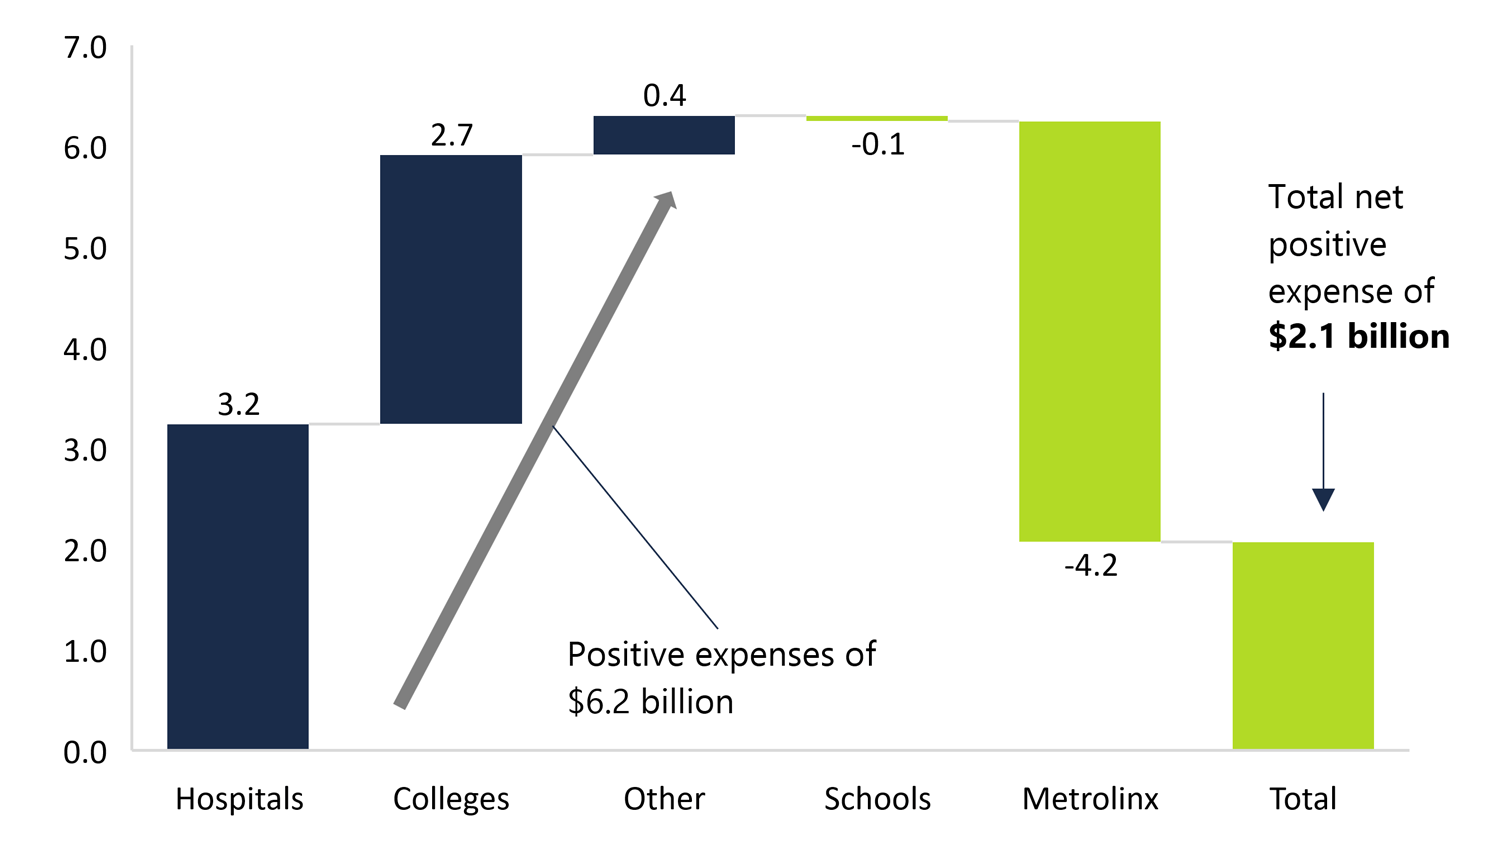
The chart below shows the other spending items for the broader public sector entities and agencies controlled by the Province as reported in the 2018-19 Expenditure Estimates. Hospitals and colleges have the largest positive spending adjustments at $3.2 billion and $2.7 billion, respectively, while schools have a small negative adjustment of $0.1 billion. Some entities can have a large negative spending adjustment, such as Metrolinx at $4.2 billion.[46] The total net change in all remaining other spending items is $0.4 billion.
Other spending in the 2018-19 Expenditure Estimates, billions of dollars
Source: FAO analysis of the 2018-19 Expenditure Estimates.
Appendix B: Supply Bill Spending: Ministry Investments
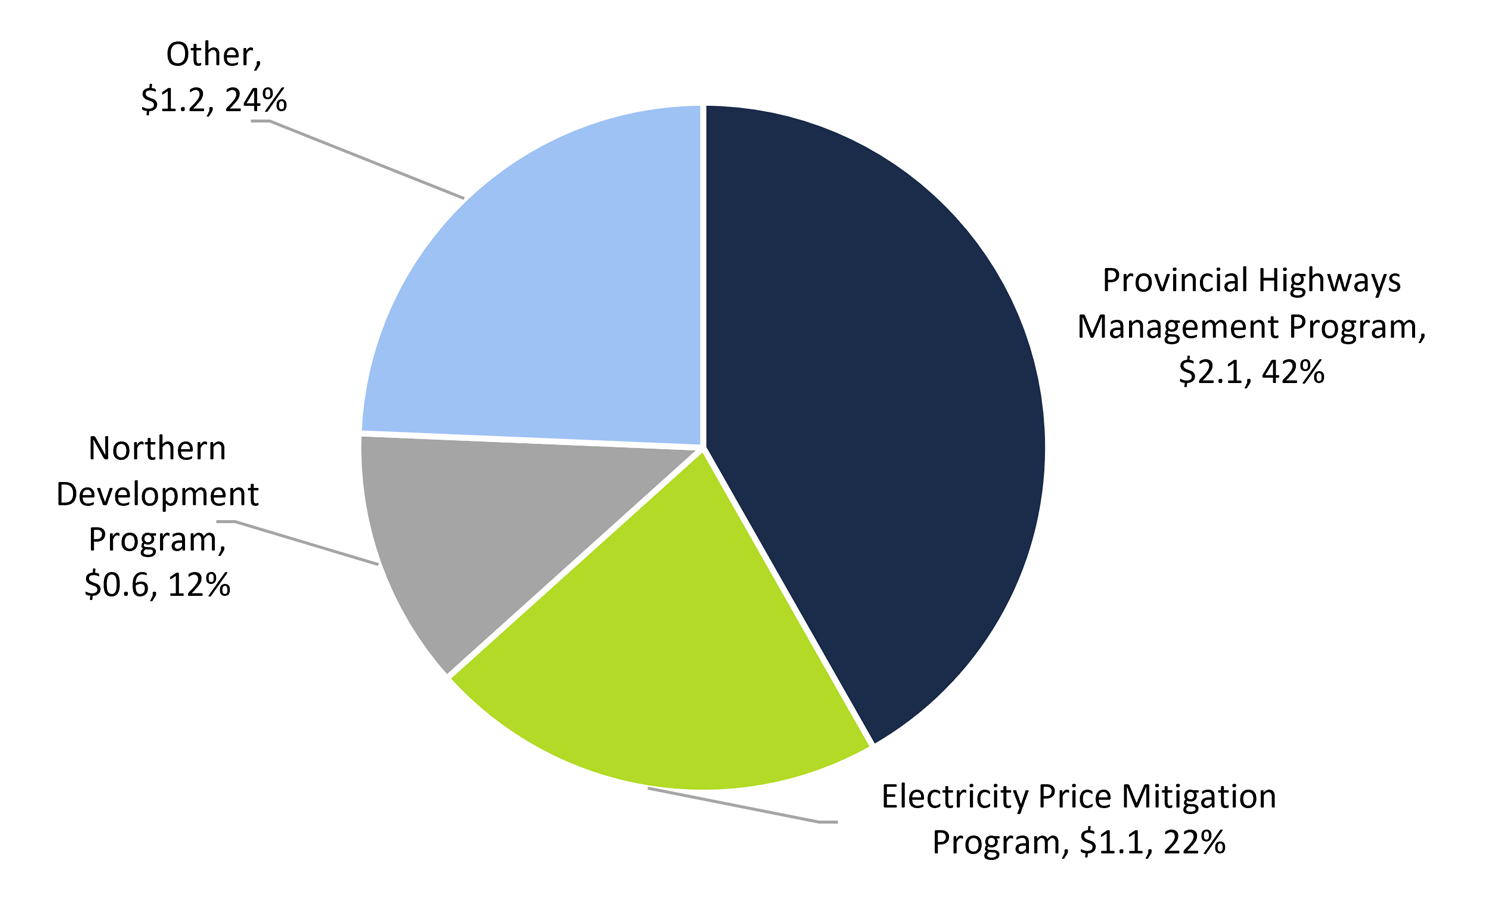
In 2018-19, the Province is requesting a total of $5.1 billion in Supply Bill spending for investments in 90 programs.[47] Three programs account for about 75 per cent of this funding request, which is summarized below. The costliest is the Provincial Highways Management program at $2.1 billion, and the average program investment is about $60 million.
Ministry investments to be approved in the 2018-19 Supply Bill, billions of dollars
Source: FAO analysis of the 2018-19 Expenditure Estimates.
The Provincial Highways Management Program oversees the provincial highway network and related transportation services (including year-round highway maintenance). The Province is requesting a total of $2.1 billion for capital investments in the provincial highway network for 2018-19, which is 9.1 per cent higher than actual spending incurred during the prior fiscal year.
The Northern Development Program also includes capital investments in highway infrastructure, which is expected to grow by 7.6 per cent in 2018-19.
The Electricity Price Mitigation Program consists of several policies to reduce electricity costs. The Province is requesting $1.1 billion in operating investments in 2018-19, which is for the Provincial investment in Ontario Power Generation to fund the costs of the global adjustment refinancing as related to the Fair Hydro Plan.
Appendix C: Development of this Report
Authority
The Financial Accountability Officer decided to undertake the analysis presented in this report under paragraph 10(1)(a) of the Financial Accountability Officer Act, 2013.
Key Questions
The following key questions were used as a guide while undertaking research for this report:
- How are the 2018-19 Expenditure Estimates structured?
- What is the total requested spending authority?
- How does the 2018-19 Expenditure Estimates compare to the 2018 Ontario Economic Outlook and Fiscal Review?
- What is the difference between voted appropriations, statutory appropriations, and consolidation and other adjustments?
- How are government organizations and other government-controlled entities accounted for?
- How has 2018-19 spending requirements changed from prior years?
- What are the largest government programs?
- How has program spending changed over time?
- What is the change in contingency funds?
Scope
The project does not seek to assess the cost efficiency and / or outcome effectiveness of government spending.
Methodology
This report has been prepared with the benefit of publicly available information and information provided by Treasury Board Secretariat and the Ministry of Finance.
All dollar amounts are in Canadian, current dollars (i.e. not adjusted for inflation) unless otherwise noted.
6 | About this document
Established by the Financial Accountability Officer Act, 2013, the Financial Accountability Office (FAO) provides independent analysis on the state of the Province’s finances, trends in the provincial economy and related matters important to the Legislative Assembly of Ontario.
The FAO produces independent analysis on the initiative of the Financial Accountability Officer. Upon request from a member or committee of the Assembly, the Officer may also direct the FAO to undertake research to estimate the financial costs or financial benefits to the Province of any bill or proposal under the jurisdiction of the legislature.
This report was prepared on the initiative of the Financial Accountability Officer. In keeping with the FAO’s mandate to provide the Legislative Assembly of Ontario with independent economic and financial analysis, this report makes no policy recommendations.
This analysis was prepared by Matthew Stephenson and Luan Ngo, under the direction of Jeffrey Novak, with contributions from Michelle Gordon, Matt Gurnham and Greg Hunter.
External reviewers provided comments on early drafts of the report. The assistance of external reviewers implies no responsibility for the final product, which rests solely with the FAO.
[1] Volume 1 of the Expenditure Estimates lists the spending requirements of ministries, while volume 2 lists the spending requirements of legislative offices. For 2018-19, both volumes were tabled in the Legislative Assembly on November 29, 2018.
[2] The 2018-19 Supply Bill is expected to be introduced in the legislature in late February or early March of 2019.
[3] This total excludes requested spending authority for legislative offices. In volume 2 of the 2018-19 Expenditure Estimates, the Province is also requesting spending authority of $0.3 billion for the legislative offices. Analysis of volume 2 of the Estimates is outside the scope of this report.
[4] Although there is also a variance in planned spending from standalone legislation and other spending of $0.9 billion and $0.8 billion, respectively, the planned spending from these two categories is presented in the Expenditure Estimates for information purposes only and does not represent a formal request for spending authority to the legislature. See appendix A for more information.
[5] In the Estimates, each program is referred to as a “vote” with sub-programs referred to as an “item”.
[6] See chapter 3 for more details.
[7] Standing Orders of the Legislative Assembly of Ontario, (SO No 60).
[8] According to the Standing Orders of the Legislative Assembly of Ontario (SO No 63c), the 2018-19 Expenditure Estimates were automatically deemed to be passed and reported back to the House without review by the SCE.
[9] Volume 1 of the Expenditure Estimates lists the spending requirements of ministries, while volume 2 lists the spending requirements of legislative offices. For 2018-19, both volumes were tabled in the Legislative Assembly on November 29, 2018.
[10] The 2018-19 Supply Bill is expected to be introduced in the legislature in late February or early March of 2019.
[11] This total excludes requested spending authority for legislative offices. In volume 2 of the 2018-19 Expenditure Estimates, the Province is also requesting spending authority of $0.3 billion for the legislative offices. Analysis of volume 2 of the Estimates is outside the scope of this report.
[12] In 2017-18, approximately 86 per cent of provincial spending was authorized through the 2017-18 Supply Bill. This calculation excludes Supply Bill funding for investments.
[13] For example, the Financial Administration Act, 1990, s.19 authorizes the payment of interest on debt expenses.
[14] For example, up to 15 per cent of a hospital’s operating spending may be financed from funds raised outside of the transfer payments provided by the Province. Financial Accountability Office of Ontario, “Ontario Health Sector: Expense Trends and Medium-Term Outlook Analysis,” January 2017, p. 45.
[15] See appendix A for more information.
[16] The Supply Act is typically passed near the end of the fiscal year.
[17] Standing Orders of the Legislative Assembly of Ontario (SO No 59). When a Budget has been presented, the main Estimates shall be tabled in the House no more than 12 sessional days later. If no Budget has been presented by the first sessional day following Victoria Day, the main Estimates shall be tabled at the next available sessional day. Upon tabling, the Estimates shall be deemed to be referred to the Standing Committee on Estimates.
[18] Although there is also a variance in planned spending from standalone legislation and other spending of $0.9 billion and $0.8 billion, respectively, the planned spending from these two categories is presented in the Expenditure Estimates for information purposes only and does not represent a formal request for spending authority to the legislature. See appendix A for more information.
[19] In the Estimates, each program is referred to as a “vote” with sub-programs referred to as an “item”.
[20] The programs and sub-programs in the Estimates, known as “votes and items”, “provide a framework for legislative control of public spending, which must be consistent with the purpose of each Vote and Item and cannot exceed Voted totals without further legislative authorization.” See 2018-19 Expenditure Estimates, Introduction.
[21] Financial Administration Act 1990, s. 1.0.8.
[22] Treasury Board Orders are disclosed after year-end in the Public Accounts of Ontario and the Ontario Gazette.
[23] This adjustment is consistent with the recommendation of the Auditor General of Ontario.
[24] 2018 Fall Economic Statement, table 3.4. The FAO cannot provide detailed program-by-program information because the Province has deemed this information to be a Cabinet record as per s. 12(2) of the Financial Accountability Officer Act, 2013 and Orders-in Council 1412/2016 and 1002/2018.
[25] In the 2018-19 Expenditure Estimates, the Province is requesting $1.6 billion in continency funds through the Treasury Board Support Program. Contingency funds are used to address program funding pressures and are allocated to programs through Treasury Board Orders. At the end of the fiscal year, any unused contingency funds reduce program spending and improve the budget balance.
[26] The FAO cannot provide detailed program-by-program information because the Province has deemed this information to be a Cabinet record as per s. 12(2) of the Financial Accountability Officer Act, 2013 and Orders-in Council 1412/2016 and 1002/2018.
[27] Standing Orders of the Legislative Assembly of Ontario, (SO No 60).
[28]According to the Standing Orders of the Legislative Assembly of Ontario, (SO No 63), the SCE must report back to the legislature by the third Thursday in November.
[29]According to the Standing Orders of the Legislative Assembly of Ontario, (SO No 63c), the 2018-19 Expenditure Estimates were automatically deemed to be passed and reported back to the House without review by the SCE.
[30] The Province is also requesting $5.1 billion for ministry program investments. See appendix B for more analysis.
[31] LHINs are crown agencies which function to integrate health systems within a geographic location. There are 14 LHINs which were established as part of the Local Health System Integration Act, 2006. LHINs have three primary functions which are to: identify and plan for the health needs of the local system, fund health service providers, and integrate the local health system they oversee.
[32] The Province has 147 hospital corporations, over 600 long-term care homes and 76 Community Health Centres.
[33] The FAO cannot provide the change in program funding as the Province has deemed this information to be a Cabinet record as per s. 12(2) of the Financial Accountability Officer Act, 2013 and Orders-in Council 1412/2016 and 1002/2018.
[34] Ministry of Health and Long-Term Care, “Schedule of Benefits for Physician Services,” June 2015.
[35] In addition, on February 19, 2019, an arbitration decision concerning the Province and the Ontario Medical Association on a new physician services agreement was released. The decision of the arbitration board will result in a new four-year agreement that covers fiscal years 2017-18 to 2020-21 and awards annual increases to physician fees which the FAO estimates will affect spending requirements in 2018-19.
[36] Canadian Institute for Health Information, ”National Health Expenditure trends, 1975 to 2018.”
[37] Beginning in March 2019 the Province is amending OHIP+ to only cover children and youth under the age of 24 who do not have private insurance. This change is not expected to materially impact program funding requirements for 2018-19.
[38] After the release of the FES, a $25 million reduction in program spending was reported. See: https://www.cbc.ca/news/canada/toronto/ontario-education-programs-funding-cuts-1.4948200.
[39] 2018 Ontario Budget, p. 40.
[40] 2018 Ontario Budget, p. 36.
[41] The FAO cannot provide estimated program savings as the Province has deemed this information to be a Cabinet record as per s. 12(2) of the Financial Accountability Officer Act, 2013 and Orders-in Council 1412/2016 and 1002/2018. For announcement see Ontario News, “Helping People with A Plan to Reform Social Assistance,” available at: https://news.ontario.ca/mcys/en/2018/07/helping-people-with-a-plan-to-reform-social-assistance.html, accessed on Nov. 30, 2018.
[42] Auditor General of Ontario, “2018 Annual Report. Section 3.10: Ontario Student Assistance Program,” December 2018.
[43] The FAO cannot provide program level analysis as the Province has deemed this information to be a Cabinet record as per s. 12(2) of the Financial Accountability Officer Act, 2013 and Orders-in Council 1412/2016 and 1002/2018. In addition, changes to the student financial assistance programs recently announced by the Province will impact program spending starting in 2019-20. https://news.ontario.ca/maesd/en/2019/01/affordability-of-postsecondary-education-in-ontario.html.
[44] The government requested $0.7 billion for infrastructure programs in 2017-18 and spent only $0.3 billion.
[45] In 2017-18, the government requested almost $6.0 billion and spent only $3.5 billion.
[46] Metrolinx receives a transfer payment from the Province which is invested in capital infrastructure. The transfer payment is recorded as an expense by the Province, so to reflect the investment in a capital asset a negative spending adjustment is recorded. After the capital project is completed the Province will recognize an expense over the life of the asset.
[47] This consists of $1.7 billion in operating investments and $3.4 billion in capital investments. Operating investments include loans and other financial assets, whereas capital investments include the building of infrastructure, such as new schools or highways.
Ministry program expense, ranked from least to most expensive, 2018-19, billions of dollars
This chart shows the total Supply Bill program expense as detailed in the 2018-19 estimates, for every program, ranked from least to most expensive, in billions of dollars. The chart shows an average program expense of $1.1 billion, with most programs showing very small expenses, and only a few programs showing very large expenses.
Five programs account for almost 70 per cent of requested Supply Bill expense, billions of dollars
This chart shows the contribution, in percentages, and total dollar amounts, in billions, of the largest programs to the total requested Supply Bill expense for 2018-19. The Local Health Integration Networks and related health service providers has a contribution of 20 per cent at $28.5 billion. The Ontario Health Insurance Program has a contribution of 15 per cent at $20.4 billion. The Elementary and Secondary Education Program has a contribution of 19 per cent at $26.9 billion. The Adults’ Services Program has a contribution of 9 per cent at $13.2 billion. The Postsecondary Education Program has a contribution of 5 per cent at $7.7 billion. The total of all other remaining programs has a contribution of 31 per cent at $44.1 billion.
Planned spending changes from the 2018-19 Expenditure Estimates to the 2018 Fall Economic Statement, millions of dollars
This chart shows the FAO estimate of planned spending changes from the 2018-19 Expenditure Estimates to the 2018 Fall Economic Statement, in millions of dollars. The first change shows a total spending increase of $2,521 million. The second change is a $1,083 million spending reduction due to underspending or reprofiling. The third change is a $984 million spending reduction due to spending cuts. The fourth change is a $318 million spending reduction due to a reduction in the contingency fund. The total of all four changes is a net spending increase of $136 million.
LHINs and Related Health Service Providers growth rates
This chart shows the FAO estimate of growth rates in Supply Bill spending for the LHINs and related health service providers for 2018-19, over the past 5 years and over the past 10 years, which are 5.0 per cent, 2.8 per cent and 3.3 per cent, respectively.
OHIP growth rates
This chart shows the FAO estimate of growth rates in Supply Bill spending for the OHIP program for 2018-19, over the past 5 years and over the past 10 years, which are 1.3 per cent, 3.2 per cent and 3.4 per cent, respectively.
Ontario health insurance sub-program growth rates
This chart shows the FAO estimate of growth rates in Supply Bill spending for the Ontario health insurance sub-program for 2018-19, over the past 5 years and over the past 10 years, which are negative 1.6 per cent, positive 2.4 per cent and positive 3.3 per cent, respectively.
Drug programs growth rates
This chart shows the FAO estimate of growth rates in Supply Bill spending for drug programs for 2018-19, over the past 5 years and over the past 10 years, which are 12.6 per cent, 6.2 per cent and 3.5 per cent, respectively.
Elementary and secondary education program growth rates
This chart shows the FAO estimate of growth rates in Supply Bill spending for the elementary and secondary education program for 2018-19 and over the past 5 years, which are 4.5 per cent and 2.7 per cent, respectively.
Adults’ services program growth rates
This chart shows the FAO estimate of growth rates in Supply Bill spending for the Adults’ services program for 2018-19, over the past 5 years and over the past 10 years, which are 7.8 per cent, 5.8 per cent and 5.3 per cent, respectively.
Postsecondary education program growth rates
This chart shows the FAO estimate of growth rates in Supply Bill spending for the postsecondary education program for 2018-19, over the past 5 years and over the past 10 years, which are 3.8 per cent, 4.2 per cent and 3.9 per cent, respectively.
Fastest growing programs in 2018-19, growth rates
This chart shows the FAO estimate of the fastest growing programs in 2018-19, which are the Tax, Benefits and Local Finance program at 182 per cent, the Infrastructure policy and planning program at 135 per cent, the Policy and Planning program at 65 per cent, the Justice Technology Services Program at 57 per cent and the Tourism and Culture Capital program at 53 per cent.
Standalone legislation spending in the 2018-19 Expenditure Estimates, billions of dollars
This chart shows the contribution, in percentages, and total dollar amounts, in billions, of the largest programs in 2018-19 that have spending authorized through standalone legislation. The Treasury Program contributes 73 per cent at $12.3 billion, the Greenhouse Gas Reduction Account Program contributes 12 per cent at $2.0 billion, the Provincial Highways Management Program contributes 6 per cent at $1.0 billion and the total of all other remaining programs contribute 10 per cent at $1.6 billion.
Other spending in the 2018-19 Expenditure Estimates, billions of dollars
This chart shows the largest other spending items (i.e. not in the Supply Bill or authorized by other legislation) in 2018-19 that are incurred by broader public entities and agencies controlled by the Province. The first item is $3.2 billion for hospitals. The second is $2.7 billion for colleges. The fourth is negative $4.2 billion for Metrolinx. The third is $0.4 billion for the total of all remaining items. The total net spending for the other spending item category is positive $2.1 billion.
Ministry investments to be approved in the 2018-19 Supply Bill, billions of dollars
This chart shows the contribution, in percentages, and total dollar amounts, in billions, of the largest programs in 2018-19 for the investment category of Supply Bill spending. The Provincial Highways Management Program contributes 42 per cent at $2.1 billion. The Electricity Price Mitigation Program contributes 22 per cent at $1.1 billion. The Northern Development Program contributes 12 per cent at $0.6 billion, and the total of all other remaining programs contributes 24 per cent at $1.2 billion.


