


1 | Executive Summary
Ontario child care costs and female labour force participation
- In Ontario, the average cost of child care was approximately $12,800 in 2018. Ontario’s child care costs are the second highest in Canada, after British Columbia, and approximately 40 per cent higher than the national average. The province with the lowest average child care costs is Quebec, at $4,400 a year, a third of Ontario’s costs.
Ontario had the second highest average child care costs in Canada in 2018

- Ontario’s relatively high child care costs contribute to the province’s relatively low rate of child care usage. Only 40 per cent of Ontario children below the age of six participate in child care,[1] the second lowest rate in the country.
- Low child care usage is closely associated with lower female labour force participation[2] because mothers are often forced to limit their working hours or take time off to care for their children. In 2018, the participation rate for core-age Ontario women, at 81.5 per cent, was the lowest in the country.
Ontario’s participation rate for core-age women is the lowest in Canada, 2018

The CARE tax credit
- Acknowledging that the cost of child care can be a barrier to employment, the 2019 Ontario Budget announced the Childcare Access and Relief from Expenses (CARE) tax credit. The purpose of the CARE tax credit is to reduce child care costs for working families and to “help experienced employees return to work sooner after a parental leave or job separation.”[3]
Impact to the Province’s budget balance
- The FAO estimates the cost of the CARE tax credit to be $435 million in 2019-20, rising to a peak of $475 million in 2021-22. Over the next five years, the CARE tax credit is estimated to cost about $460 million per year on average or $2.3 billion in total.
- By comparison, in the 2019 budget, the Province estimates that the CARE tax credit will cost $390 million each year over the next five years, totaling $2.0 billion. Overall, the FAO projects that over five years the CARE tax credit will cost $0.4 billion more than the government’s forecast.
Comparison of FAO and Province’s Estimate of the Cost of the CARE Tax Credit
|
($ millions) |
2019-20 |
2020-21 |
2021-22 |
2022-23 |
2023-24 |
Total |
|
FAO Estimate |
435 |
465 |
475 |
470 |
460 |
2,305 |
|
Government Estimate |
390 |
390 |
390 |
390 |
390 |
1,950 |
|
Difference |
45 |
75 |
85 |
80 |
70 |
355 |
Impact on households
- There are approximately 1,477,000 families in Ontario with children aged 16 or under,[4] of which roughly 547,000 use paid child care arrangements. The FAO estimates that approximately 310,000 families with children will receive the CARE tax credit.
- Approximately 237,000 Ontario families with child care expenses will not receive the CARE tax credit, mainly because their family income exceeds the $150,000 limit to be eligible for the tax credit.[5]
Out of all Ontario families with children, 21 per cent will receive the CARE tax credit

- The CARE tax credit provides a maximum benefit entitlement of $6,000 per child under seven, $3,750 for children between seven and sixteen and $8,250 for a child with disability.[6]
o Based on the FAO’s analysis, fewer than 300 families, or 0.1 per cent of all CARE tax credit recipients, will receive the maximum benefit entitlement per child.
o Families that receive the CARE tax credit will receive an average benefit of approximately $1,300.
- Even though the CARE tax credit is income tested, so that the eligible benefit gradually falls to zero for families with incomes above $150,000, the average CARE tax credit benefit paid per household will be similar across income groups.
o Lower-income families generally spend less on child care expenses.[7] In contrast, higher-income families generally claim more expenses, but their benefit is reduced by lower CARE tax credit benefit rates.
Lower income families to receive similar relief from CARE tax credit as higher income families

Note: estimates are based on the 2019 tax year without behavioural change.
- Approximately two-thirds of the total CARE tax credit benefit will be distributed to families with incomes over the 50th income percentile ($63,700 or more), including almost 10 per cent of the total benefit to families above the 75th income percentile ($118,700). Only three per cent of the total CARE tax credit benefit will be distributed to families with incomes below the 25th income percentile ($21,400 or less). Families with incomes between the 25th to 50th percentile ($21,400 to $63,700) will receive about one-third of the total CARE tax credit benefit.
Distribution of the CARE tax credit benefit by family income

Note: estimates are based on the 2019 tax year without behavioural change. The income ranges on the x-axis represent income quartiles for Ontario families with children, and the values are rounded to the nearest hundred. The definition of family income is identical to the income used to calculate the CARE tax credit rate. Numbers may not add up due to rounding.
Economic impact of the CARE tax credit
- The FAO estimates that the CARE tax credit could result in about 6,000 to 15,000 more people entering the Ontario workforce. This increase would modestly boost the labour force participation rate for core-age Ontario women from 81.5 per cent to 81.9 per cent. However, this would still be well below the national average at 83.2 per cent or Quebec’s rate of 86.7 per cent.
CARE tax credit to modestly boost labour force participation rate of core-age women

- Encouraging more women to enter the labour force would lead to gains in economic output, higher employment and increases in household income. Specifically, the FAO estimates that the CARE tax credit will boost Ontario’s GDP by about $1 billion (in 2018 dollars) and household incomes by $0.7 billion (in 2018 dollars) after a 10-year period of adjustment (see chapter 6 for more details).
Ontario’s child care system
In Ontario, families have access to child care services that are delivered by licensed and unlicensed providers. Licensed child care centres and licensed home-based child care providers are subject to provincial health and safety standards as well as inspections by the Ministry of Education. In contrast, unlicensed child care services, such as relatives, friends, neighbours or nannies[8] are not subject to the same standards or inspections.
Together, licensed child care centres and licensed home-based child care operators provide roughly 463,000 child care spaces[9] in Ontario for children under 13 years of age and are supported by approximately $2 billion in annual provincial funding. This support, largely provided by transfer payments through municipal service managers, allows child care operators to provide subsidized fees to families.
Households’ out-of-pocket child care expenses are also supported by benefits through the tax system. The federal-provincial Child Care Expense Deduction (CCED) allows households to claim child-care expenses to reduce their federal and provincial income tax payable. In 2019, Ontario households are projected to reduce their personal income tax by roughly $700 million through the CCED, of which $240 million is a reduction in Ontario personal income tax.[10] In addition, the Canada Child Benefit and Ontario Child Benefit provide families with payments to support the cost of raising children, although these benefits are not targeted towards child care expenses.
Despite these financial supports, many Ontarians have indicated that finding affordable child care is a challenge. As a result, many parents, particularly mothers, are discouraged from remaining in the labour force due to child care responsibilities, which reduces Ontario’s potential labour force and lowers the lifetime earnings potential of women.
Ontario’s new child care tax credit
Acknowledging that the cost of child care can be a barrier to employment, the 2019 Ontario Budget announced the Childcare Access and Relief from Expenses (CARE) tax credit. The purpose of the CARE tax credit is to reduce child care costs for working families and to “help experienced employees return to work sooner after a parental leave or job separation.”[11]
Purpose and structure of this report
The purpose of this report is to assess the financial and economic implications of the new CARE tax credit. This report estimates the impact of the CARE tax credit on the Province’s budget balance, the financial benefits it will provide to households, and its potential impact on Ontario’s labour market and the broader economy.
This report is structured as follows:
- Chapter 3 provides an overview of the cost of child care services in Ontario and the implications of Ontario’s relatively high child care costs for households and Ontario’s labour force.
- Chapter 4 presents the FAO’s estimate of the cost of the CARE tax credit in comparison to the government’s estimate from the 2019 Ontario Budget.
- Chapter 5 reviews the impact of the CARE tax credit on Ontario households, including the number of families who are expected to benefit from the credit, the average benefit per family, the likelihood of a family receiving the maximum available credit and the distribution of the CARE tax credit by family income.
- Lastly, chapter 6 discusses the potential impact of the CARE tax credit on the broader economy and discusses Ontario’s labour force participation rate compared to the rest of the country.
Ontario’s child care costs are higher than the Canadian average
In Ontario, the average cost of child care in 2018 was approximately $12,800. Ontario’s child care costs are the second highest in Canada, after British Columbia. The province with the lowest child care costs is Quebec, where fees are estimated to be $4,400 a year, a third of Ontario’s costs.
Figure 3.1: Ontario had the second highest average child care costs in Canada in 2018

Note: values represent households’ average out-of-pocket child care expenses for children 0-12 years of age in child care for at least 30 hours per week. These values include provincial subsidies that lower households’ out-of-pocket expenses but excludes subsidies or tax credits paid directly to households.
Although child care costs in Ontario averaged $12,800 in 2018, child care costs vary depending on the age of the child, the location of the centre and the type of care provided. For example, the median child care fees for infants at licensed Toronto child care centres or homes is approximately $20,000 a year.[12]
On average, full-time child care costs are estimated to absorb 17 per cent of Ontario families’ after-tax income (Figure 3.2). However, families with infants, who are subject to significantly higher fees, can spend one-quarter of their after-tax income on child care services.
Figure 3.2: On average, families with children in full-time care spend 17 per cent of after-tax income on child care

High child care costs in Ontario contribute to lower child care usage as well as low rates of female labour force participation
In 2019, 40 per cent of Ontario children below the age of six are estimated to participate in child care,[13] the second lowest rate in Canada. Child care usage in Ontario is significantly lower than Quebec where 74 per cent of children are in child care.
Figure 3.3: Ontario has second lowest share of children in child care in Canada, 2019

Note: Represents children aged 0 to 5 in preschool, daycare and child care centres, home care, and before and after school programs. The figure excludes children in family organized arrangements, such as care by relatives or nannies.
According to a recent Statistics Canada survey, the low usage of child care in Ontario is connected to affordability. Specifically, 28 per cent of Ontarians who do not use child care indicated that cost was a barrier, compared to six per cent who indicated that shortage of spaces was a challenge.[14]
At the same time, Ontario’s low child care usage is closely associated with lower female labour force participation[15] because mothers reduce hours worked or take time off to care for their children.[16] In Ontario, 85 per cent of core-age[17] women without children participate in the labour force. In contrast, the labour force participation rate for women with children below the age of six is 73 per cent. As children age and require less care, the proportion of mothers participating in the labour force increases. For women with children aged six to 12, the participation rate is 81 per cent and rises to 85 per cent for women with adult children.
Figure 3.4: Women with children less likely to participate in the labour force in Ontario, 2018

Overall, Ontario’s female labour force participation rate for mothers with children aged 12 and under is 77 per cent. Compared to other provinces, Ontario ranks third lowest, two percentage points below the national average and seven percentage points below Quebec.
Figure 3.5: A smaller proportion of women with young children participate in the labour force in Ontario compared to most other provinces

The relatively low female labour force participation rate of Ontario mothers contributes to Ontario’s low overall female participation rate, compared to other provinces. In 2018, the participation rate for core-age Ontario women, at 81.5 per cent, was the lowest in the country. In contrast, Quebec had the highest participation rate in Canada at 86.7 per cent. If Ontario women were to participate in the labour force at the same rate as in Quebec, Ontario’s economy would benefit from nearly 160,000 more workers. (See chapter 6 for a discussion on the potential economic impact of an increase in the female labour force participation rate in Ontario.)
Figure 3.6: Ontario’s participation rate for core-age women is the lowest in Canadaa

|
Comparing Labour Force Participation Rates for Women in Ontario and Quebec Historically, core-age women in Ontario were more likely to participate in the workforce than in Quebec. However, the participation rate for core-age Quebec women increased steadily through the late 1990s, coinciding with the introduction of universal day care in 1997,[18] while the Ontario rate remained relatively unchanged. By 2006, Quebec’s female participation rate exceeded that of Ontario and has continued to track higher over the past decade. Figure 3.7: Participation rate for Quebec women increased following the introduction of universal subsidized daycare, surpassing Ontario by 2006
Source: Statistics Canada.
|

The CARE tax credit is a refundable tax credit designed to offset a portion of the cost of child care for “working families, particularly families with low and moderate incomes.”[19]


To receive the CARE tax credit, households are required to claim child care expenses on their income tax returns.[20] However, the amount of claimable expenses for the CARE tax credit is capped based on the number of children, the age and circumstances of the children, and the spouse’s income.[21]
The CARE tax credit benefit is income tested, starting at 75 per cent of claimable child care expenses for family incomes below $20,000 and gradually falling to zero for families with incomes above $150,000.[22] The claimable child care expense reported for income tax purposes is multiplied by the appropriate credit rate to determine the CARE tax credit benefit.[23]
Impact to the Province’s budget balance
The FAO estimates the cost of the CARE tax credit to be $435 million in 2019-20, rising to a peak of $475 million in 2021-22. Over the next five years, the CARE tax credit is estimated to cost about $460 million per year on average or $2.3 billion in total. The FAO’s projection includes the following adjustments:[24]
- An increase in reported child care expenses on tax returns by families who are already using child care;
- An expected rise in the total number of families using child care; and
- Rising average family incomes, which will reduce the cost of the CARE tax credit over time, as the credit’s income rates are not indexed to inflation.
By comparison, in the 2019 budget, the Province estimates that the CARE tax credit will cost $390 million each year over the next five years, totalling $2.0 billion. Overall, the FAO projects that over five years the CARE tax credit will cost $0.4 billion more than the government’s forecast.
Figure 4.2: Comparison of FAO and Province’s Estimate of the Cost of the CARE Tax Credit
|
($ millions) |
2019-20 |
2020-21 |
2021-22 |
2022-23 |
2023-24 |
Total |
|
FAO Estimate |
435 |
465 |
475 |
470 |
460 |
2,305 |
|
Government Estimate |
390 |
390 |
390 |
390 |
390 |
1,950 |
|
|
45 |
75 |
85 |
80 |
70 |
355 |
The following sections provide a brief overview of the FAO’s adjustments.
More families that are currently using child care will report their child care expenses on tax returns
The FAO estimates that only 85 per cent of Ontario families using child care currently report their child care expenses on tax returns. Some families do not claim child care expenses under the CCED because, as a tax deduction, it may not provide any tax benefit to a spouse with no tax payable.[25] Other factors could include lack of awareness of the CCED, the perceived complexity of the income tax process, and whether the income tax benefit from reporting child care expenses is perceived to be insignificant.[26]
However, in response to the introduction of the CARE tax credit, more families with child care expenses are expected to report those expenses on their tax return.[27] Importantly, since CARE is a refundable tax credit,[28] families could be eligible for a tax refund even if a spouse has no tax payable. As a result, the FAO estimates that the share of eligible families reporting child care expenses on their tax returns will rise from 85 per cent to 94 per cent over two years.[29]
More families expected to use child care services
By offsetting a portion of the cost of child care, the CARE tax credit will encourage households to increase their use of paid child care arrangements, leading to higher overall child care expenses. Based on previous studies, the FAO estimates that the CARE tax credit will result in Ontario families spending an additional $340 million on child care by 2021-22, an increase of eight per cent.[30] As Ontario families spend more on child care, it will increase the cost of the CARE tax credit.[31], [32]
Figure 4.3: CARE tax credit expected to increase use of child care, resulting in higher CARE tax credit cost over time

Income growth will reduce CARE tax credit benefits
As noted above, the calculation of the CARE tax credit benefit is income tested starting at a credit benefit rate of 75 per cent for families with incomes below $20,000 and gradually falling to zero for families with incomes above $150,000. Importantly, the income levels are not indexed to inflation. As a result, the cost of the CARE tax credit to the Province is projected to decrease over time as average family incomes increase.[33]
There are approximately 1,477,000 families in Ontario with children aged 16 or under,[34] of which roughly 547,000 use paid child care arrangements. The FAO estimates that approximately 310,000 families with children will receive the CARE tax credit, with an average benefit of approximately $1,300 per family in 2019.[35] The estimate is comparable to the Province’s projection of an average benefit of $1,250 for about 300,000 families.[36]
Approximately 237,000 Ontario families with child care expenses will not receive the CARE tax credit, mainly because their family income exceeds the $150,000 limit to be eligible for the tax credit. However, some families with child care expenses will not receive the CARE tax credit because one spouse has no earned income or the family is not reporting child care expenses on their tax returns.
Figure 5.1: Out of all Ontario families with children, 21 per cent will receive the CARE tax credit

Few families are expected to receive the full CARE tax credit benefit
The CARE tax credit provides a maximum benefit entitlement of $6,000 per child under seven, $3,750 for children between seven and sixteen and $8,250 for a child with disability.[37] Based on the FAO’s analysis, fewer than 300 families, or 0.1 per cent of all CARE tax credit recipients, will receive the maximum per child benefit entitlement due to the following factors:
- Only low-income families earning $20,000 or less are eligible to receive the maximum benefit entitlement;
- A family earning $20,000 or less would need to spend at least $8,000 in child care expenses for each child under seven and at least $5,000 in child care expense for each child between seven and sixteen, in order to receive the maximum benefit entitlement; and
- Even if a family earning $20,000 or less were to spend the maximum claimable child care expenses per child, the total claimable amount for that family cannot be higher than two-thirds of the lower-earning spouse’s income.
Average CARE tax credit benefit roughly similar across household income categories
Based on the FAO’s analysis, the average CARE tax credit benefit per household will be similar across income groups, ranging from an average benefit of $1,190 for families with incomes between $20,001 and $40,000 to $1,750 for families with incomes between $40,001 and $60,000.
Lower-income families generally spend less in child care expenses and their claimable child care expenses cannot exceed two-thirds of the lower-income spouse’s earned income. In contrast, higher-income families generally claim more expenses, but their benefit is reduced by lower CARE tax credit benefit rates. Due to the impact of these factors, average CARE tax credit benefits are expected to be relatively flat across family income groups.
Figure 5.2: Lower income families to receive similar relief from CARE tax credit as higher income families

Two-thirds of benefit distributed to families with above median-income
Although the purpose of the CARE tax credit is to support working families, particularly families with low and moderate incomes,[38] only three per cent of the credit benefit will be distributed to families with incomes below the 25th income percentile ($21,400 or less). Families with incomes between the 25th to 50th percentile ($21,400 to $63,700) will receive about one-third of the total CARE tax credit benefit. Approximately two-thirds of the CARE tax credit benefit will be distributed to families with incomes over the 50th income percentile ($63,700 or more).
Figure 5.3: Distribution of the CARE tax credit benefit by family income

Note: estimates are based on the 2019 tax year without behavioural change. The income ranges on the x-axis represent income quartiles for Ontario families with children, and the values are rounded to the nearest hundred. The definition of family income is identical to the income used to calculate the CARE tax credit rate. Numbers may not add up due to rounding.
Lower income families will receive a small amount of the overall benefit because they generally spend less on child care and their maximum CARE tax credit is constrained by the income of the lower-earning parent. Middle- and higher-income families will receive most of the total CARE tax credit benefit, reflecting the fact that child care expenses typically increase with family income. Families above the 75th income percentile ($118,700) will receive almost 10 per cent of the total CARE tax credit benefit, despite the declining benefit rate and exclusion of families earning more than $150,000.
Nearly 70 per cent of eligible families have above-median incomes
Similarly, most families who are eligible for the CARE tax credit have above-median incomes. The FAO estimates that 7,300 or just over two per cent of the 310,000 Ontario families who are expected to receive the CARE tax credit in 2019 have incomes below the 25th percentile ($21,400 or less). Around 88,200 families (28 per cent) have incomes between the 25th and 50th percentile ($21,400 to $63,700), while 214,200 (69 per cent) of families that will receive the CARE tax credit in 2019 have above median incomes ($63,700 or more).
Figure 5.4: Allocation of the estimated 310,000 CARE tax credit recipients by family income percentile

Note: estimates are based on the 2019 tax year without behavioural change. The income ranges on the x-axis represent income quartiles for Ontario families with children, and the values are rounded to the nearest hundred. The definition of family income is identical to the income used to calculate the CARE tax credit rate. Numbers may not add up due to rounding.
CARE tax credit will offset 10 per cent of total child care expenses in Ontario
In 2019, Ontarians will spend approximately $4.5 billion on child care expenses.[39] The FAO estimates that the CARE tax credit will offset approximately 10 per cent of households’ child care costs in 2019.
Figure 5.5: CARE tax credit to relieve 10 per cent of child care expenses, on average

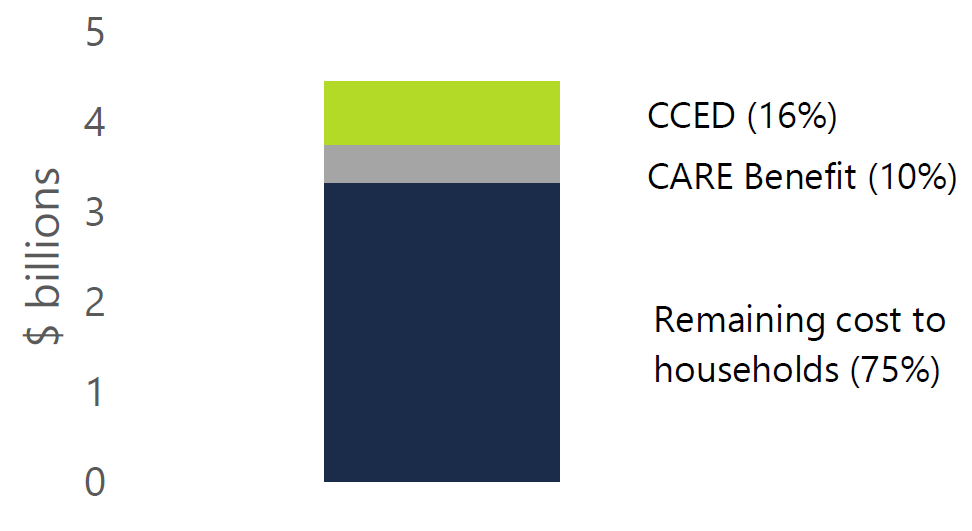
Combined with the existing benefits from the CCED, approximately 26 per cent of households’ child care expenses will be offset through the tax system.
Based on FAO estimates, the CARE tax credit will provide an average of $460 million per year in refundable tax credits to households, offsetting about 10 per cent of total child care costs in Ontario.
Research suggests that lower child care costs encourage greater female participation in the labour force.[40] Based on this research, the FAO estimates that the CARE tax credit could result in about 6,000 to 15,000 more people entering the Ontario workforce, increasing the labour force participation rate of core-age women by about 0.4 percentage points. The FAO’s estimate is slightly lower than the government’s 2019 budget estimate of 9,000 to 19,000 new labour force entrants due to the CARE tax credit.[41]
Encouraging more women to enter the labour force would lead to gains in economic output, higher employment and increases in household income. Specifically, the FAO estimates that the CARE tax credit will boost Ontario’s GDP by about $1 billion (in 2018 dollars) and household incomes by $0.7 billion (in 2018 dollars) after a 10-year period of adjustment (see appendix for more details).
Even with the CARE tax credit, Ontario women expected to participate in the labour force at rates below the national average
Even after the introduction of the CARE tax credit, the labour force participation rate of Ontario women is expected to continue to lag other provinces. As discussed in chapter 3, Ontario has the lowest provincial participation rate for core-age women, at 81.5 per cent in 2018. Based on the FAO’s estimates, the CARE tax credit is expected to modestly improve Ontario’s core-age female participation rate to 81.9 per cent. However, this would still be well below the national average at 83.2 per cent or Quebec’s rate of 86.7 per cent.
Figure 6.1: CARE tax credit to modestly boost labour force participation rate of core-age women

If Ontario were to reduce the average cost of child care to approximately the national average, the gap in Ontario’s female participation rate with the national average would be nearly closed. In this scenario, to achieve an average cost of child care near the national average, the Province would need to provide an additional $0.8 billion in support (on top of the CARE tax credit) to Ontario families with child care expenses. Under this scenario, around 43,000 workers would enter the labour force, resulting in Ontario’s female labour force participation rate increasing to 82.8 per cent, closer to the national average of 83.2 per cent. [42]
Economic impacts of reducing Ontario child care costs
Research suggests that lower child care costs lead to greater female participation in the labour force.[43] Lower child care fees encourage greater use of professional child care arrangements, freeing time for mothers to join the workforce. Specifically, previous studies suggest that every 10 per cent decrease in childcare costs would increase the number of women in the workforce by 2 to 4 per cent.[44]
In the short run, the higher participation rate would increase unemployment and reduce wage growth. On the other hand, higher labour force participation would increase potential output, lowering price inflation and interest rates which would result in a lower Canadian dollar exchange rate, compared to the status quo. The lower currency combined with lower unit labour costs would boost exports. In turn, higher employment, as more women find employment, would increase household incomes and consumption.
The combination of higher exports and household consumption would boost economic output and employment. After a period of roughly ten years, the FAO projects the economy would absorb the influx of new workers and the unemployment rate would return to its long-term average.[45]
Given these economic dynamics, the FAO estimates that the 10 per cent decrease in child care costs resulting from the CARE tax credit will:[46]
- Add 6,000 to 15,000 workers to Ontario’s labour force;
- Increase household income by $0.4 to $1.0 billion (in 2019 dollars); and
- Increase GDP by $0.6 to $1.5 billion (in 2019 dollars).
These estimates imply that the economic benefit from reducing child care fees would significantly outweigh the cost. For every dollar reduction in child care costs, GDP would increase by about $2.4 dollars in the long-term.[47]
8 | About this document
Established by the Financial Accountability Officer Act, 2013, the Financial Accountability Office (FAO) provides independent analysis on the state of the province’s finances, trends in the provincial economy, and related matters important to the Legislative Assembly of Ontario.
The FAO produces independent analysis on the initiative of the Financial Accountability Officer. Upon request from a member or committee of the Assembly, the Officer may also direct the FAO to undertake research to estimate the financial costs or financial benefits to the Province of any bill or proposal under the jurisdiction of the legislature.
This report was prepared on the initiative of the Financial Accountability Officer. In keeping with the FAO’s mandate to provide the Legislative Assembly of Ontario with independent economic and financial analysis, this report makes no policy recommendations. This report was prepared by Zohra Jamasi, Jacob Kim and Luan Ngo, under the direction of Jeffrey Novak and David West. Contributions were also made by Gamze Demiray, Jessica Kelly, and Ben Premi-Reiller.
External reviewers provided comments on early drafts of this report. The assistance of external reviewers implies no responsibility for the final product, which rests solely with the FAO.
The content of this report is based on information available to August 1, 2019. Background data used in this report are available upon request.
This analysis is based on Statistics Canada's Social Policy Simulation Database and Model (SPSDM). The assumptions and calculations underlying the simulation results were prepared by the FAO and the responsibility for the use and interpretation of these data is entirely that of the authors.
Ontario had the second highest child care costs in Canada in 2018
This chart shows the average annual cost of full-time child care for all provinces in 2018. This chart highlights that British Columbia had the highest average child care costs at $14,200 followed by Ontario with an average cost of $12,800, while Quebec had the lowest child care costs at $4,400. This chart highlights that the national average cost of child care is $9,200.
On average, families with children in full-time care spend 17 per cent of after-tax income on child care, 2018
This chart shows the share of after-tax income that families with children spend on full-time child care. This chart highlights that the average after-tax income of families with children is $75,000, and the average full-time child care costs of $12,800 take up 17 per cent of the average after-tax income.
Ontario has the second lowest share of children in child care in Canada, 2019
This chart shows the percentage of children under the age of six in child care for all provinces in 2019. This chart highlights that in Quebec, 74 per cent of children under the age of six are enrolled in child care while in Ontario, only 40 per cent are enrolled in child care. This chart also shows that the national average sits at 49 per cent.
Women with children less likely to participate in the labour force in Ontario, 2018
This chart compares the labour force participation rate of core-age women with and without children in Ontario, broken down by the age of their youngest child. Women without children have the highest participation rate of 85 per cent. Women with children under the age of six have the lowest participation rate of 73 per cent. For women with children aged 6 to 12, 13 to 17, and 18 to 24, the participation rates are 81 per cent, 84 per cent, and 85 per cent, respectively.
A smaller proportion of women with young children participate in the labour force in Ontario compared to most other provinces
This chart shows the labour force participation rate of core-age women with children below the age of 13 for all provinces in 2018. This chart highlights that the participation rate of core-age women in Quebec is 84 per cent while it is 77 per cent in Ontario. This chart also highlights that the national average for the labour force participation rate of core-age women with children below the age of 13 is 79 per cent.
Ontario’s participation rate for core-age women is the lowest in Canada
This chart shows the labour force participate rate of all core-age women for all provinces in 2018. This chart highlights that Quebec has the highest participation rate for core-age women at 86.7 per cent while Ontario has the lowest participation rate at 81.5 per cent. This chart also highlights that the national average participation rate of core-age women is 83.1 per cent.
Participation rate for Quebec women increased following the introduction of universal subsidized daycare, surpassing Ontario starting in 2006
This chart shows the trend of labour force participation rate of all women in Ontario and Quebec between 1976 and 2018. Historically, Ontario’s labour force participation rate was higher than Quebec’s. The gap closed steadily through the late 1990s, and Quebec’s participation rate surpassed Ontario’s in 2006. This chart highlights that Quebec introduced universal subsidized daycare in 1997.
Ontario CARE Tax Credit Rates
This chart shows the CARE tax credit rates by family income. Families with income less than or equal to $20,000 are subject to a tax credit rate of 75 per cent. Then, the rate steadily decreases to 59 per cent for families earning $40,000, 51 per cent for families earning $60,000, and 0 per cent for families earning above $150,000.
Comparison of FAO and the Province’s Estimate of the Cost of the CARE Tax Credit
This table shows a comparison of the FAO and the Province’s estimate of the cost of the CARE tax credit in millions of dollars from the period 2019-20 to 2023-24. The table shows that the FAO estimate is $435 million in 2019-20, $465 million in 2020-21, $475 million in 2021-22, $470 million in 2022-23, and $460 million in 2023-24, totaling $2.305 billion over five years. The table shows that the Ontario government’s estimate is $390 million each year from 2019-20 to 2023-24, totaling $1.95 billion. The table also highlights that over the five years the FAO estimate is $355 million lower than the government’s estimate.
CARE tax credit expected to increase use of child care, resulting in higher CARE tax credit cost over time
This flow diagram explains that the CARE tax credit will increase families’ use of child care, leading to q higher CARE tax credit cost. The CARE tax credit partially offsets child care costs which results in families using more child care services. Higher child care usage leads to an increase in child care expenses, which increases the cost of the CARE tax credit.
Out of all Ontario families with children, 21 per cent will receive the CARE tax credit
This chart shows that out of the 1,477,00 families with children aged 16 or under in Ontario, 310,000 families with reported child care expenses will receive the CARE tax credit benefit. There are 237,000 families with reported child care expenses that are not eligible for the CARE tax credit. The rest consists of 930,000 families reporting no child care expenses.
Lower income families to receive similar relief from CARE tax credit as higher income families
This chart shows the average amount of the CARE tax credit benefit per family by family income groups. Families with income between $0 and $20,000 will receive $1,280 on average. Families with income between $20,001 and $40,000 will receive $1,190 on average. Families with income between $40,001 and $60,000 will receive $1,750 on average. Families with income between $60,001 and $150,000 will receive $1,240 on average. This chart highlights that the average amount across all income groups is $1,300.
Distribution of the CARE tax credit benefit by family income
This chart shows the share of the total CARE tax credit benefit by family income quartile in Ontario. Families with income below the 25th percentile (< $21,400) will receive 3 per cent of the total benefit. Families with income between the 25th and 50th percentiles ($21,400 - $63,700) will receive 32 per cent of the total benefit. Families with income between the 50th and 75th percentiles ($63,700 - $118,700) will receive 56 per cent of the total benefit. Families with income above the 75th percentile (> $118,700) will receive 9 per cent of the total benefit.
Allocation of the estimated 310,000 CARE tax credit recipients by family income
This chart shows the number and share of families that will receive the CARE tax credit by family income quartile in Ontario. There are 7,300 families or 2 per cent of all recipients with income below the 25th percentile (< $21,400). There are 88,200 families or 28 per cent of all recipients with income between the 25th and 50th percentiles ($21,400 - $63,700). There are 143,200 families or 46 per cent of all recipients with income between the 50th and 75th percentiles ($63,700 - $118,700). There are 71,000 families or 23 per cent of all recipients with income above the 75th percentile (> $118,700).
CARE tax credit to relieve 10 per cent of child care expenses, on average
This chart shows the share of Ontario child care expenses that will be offset by the CARE tax credit and the CCED. CCED benefits will offset 16 per cent of all child care expenses and the CARE tax credit will offset 10 per cent of all child care expenses, leaving 75 per cent of the expenses for households to cover.
Care Tax Credit to modestly boost labour force participation rate of core-age women
This chart shows the estimated effect the CARE tax credit will have on Ontario’s labour force participation rate of core-age women. This chart highlights that the CARE tax credit is expected to boost Ontario’s participation rate by a modest 0.4 percentage points bringing it up to 81.9 per cent. This chart also highlights that if Ontario had the national average child care costs, Ontario’s participation rate would be closer to the national average of 83.1 per cent.
[1] Represents children aged 0 to 5 in preschool, daycare and child care centres, home care and before and after school programs. Excludes children in family organized arrangements, such as care by relatives or nannies. Statistics Canada’s Survey on Early Learning and Child Care Arrangements, 2019.
[2] The labour force participation rate is the share of the population who are either employed or looking for employment.
[3] 2019 Ontario Budget, p. 100.
[4] The CARE tax credit offsets child care expenses for children aged 16 or under.
[5] As well, some families with child care expenses will not receive the CARE tax credit because one spouse has no earned income or the family is not reporting child care expenses on their tax returns.
[6] These amounts are then aggregated for each family to determine the family maximum based on the number of children and their age and circumstance. For instance, a family with two children under seven would be eligible for a maximum CARE tax credit benefit up to $12,000.
[7] In addition, claimable child care expenses cannot exceed two-thirds of the lower-income spouse’s earned income.
[8] https://www.mcss.gov.on.ca/en/mcss/programs/social/directives/odsp/is/5_5_ODSP_ISDirectives.aspx.
[9] See Ontario's Early Years and Child Care Annual Report, 2018. for more details.
[10] FAO estimates based on data from Statistics Canada’s Social Policy Simulation Database and Model. The Province estimates that the CCED reduced provincial personal income tax revenue by $220 million in 2018. See Transparency Taxation Report 2018.
[11] 2019 Ontario Budget, p. 100. The 2019 budget also noted two initiatives aimed at improving access to child care services. The Province announced that it would allocate $1 billion over five years in capital spending to create up to 30,000 new child care spaces in schools, and announced regulatory changes that would encourage an expansion in the number of home-based child care spaces.
[12] See the Canadian Centre for Policy Alternatives’ 2019 Child Care Report: Developmental Milestones.
[13] Represents children aged 0 to 5 in preschool, daycare and child care centres, home care and before and after school programs. Excludes children in family organized arrangements, such as care by relatives or nannies. Statistics Canada’s Survey on Early Learning and Child Care Arrangements, 2019.
[14] Survey of Early Learning and Child Care, Statistics Canada, 2019.
[15] The labour force participation rate is the share of the population who are either employed or looking for employment.
[16] For more information, see Do childcare policies increase maternal employment?, Daniela Vuri, 2016.
[17] Core-age workers refer to people between the ages of 25 to 54.
[18] Quebec’s 1997 reform is estimated to have increased employment of women in two-parent families by 14.5 per cent. See Baker, Gruber and Milligan. 2008. “Universal childcare, maternal labor supply and family well-being.” Journal of Political Economy, Vol. 116 (4), pages 709-745.
[19] 2019 Ontario Budget, p. 100.
[20] The eligible expenses are based on the same definition as the CCED, which includes fees from child care centres, adult family members, nannies and baby sitters, day nursery schools, day care centres, day camps and sports camps.
[21] For each family, the claimable amount mirrors the CCED and is capped at $8,000 for each child under the age of seven, $5,000 for each child aged between seven and sixteen, and $11,000 for each child with severe disability. These amounts are not automatically adjusted for inflation. Furthermore, the maximum total expenses claimed cannot exceed two-thirds of the lower-income spouse’s earned income.
[22] The family income brackets for the calculation of the CARE tax credit benefit are fixed and will not be adjusted for inflation.
[23] For example, a family making $60,000 would be eligible to receive a 51 per cent rebate on their eligible child care expenses. If this family incurred $5,000 in eligible expenses, they would be entitled to a CARE tax credit benefit of $2,550.
[24] FAO projection based on data from Statistics Canada’s Social Policy Simulation Database and Model.
[25] CCED allows tax filers to deduct the eligible portion of their child care expenses from taxable income, thereby reducing tax payable. But, for families that already have a spouse with no tax liability, reducing taxable income does not generate additional tax benefits.
[27] Studies find that tax credits’ take-up rates rise when the entitlement increases. For more information, see Brewer, Suarez and Walker, 2003.
[28] Refundable tax credits provide the full credit amount to eligible tax filers even if they have no tax payable.
[29] The FAO’s analysis is based on a review of previous studies. For more information, see Brewer, Suarez and Walker (2003), Department of Finance Canada (2017), and HM Customs (2010).
[30] The FAO assumes that the CARE tax credit would increase demand by 8 per cent (representing a demand elasticity of 0.8), phased in over three years. This elasticity is within the range found by existing studies. For example, Baker et al 2008 found an elasticity of 0.6 for Canada and Chaplin et al (2000) found an average elasticity of 1.1 across several studies. Also see Lefebvre, Merrigan and Verstraete (2009) and Lefebvre and Merrigan (2008).
[31] The cost of the CCED would also increase. However, a review of the CCED is beyond the scope of this report.
[32] If families use more child care, it is expected that spouses will increase hours worked, leading to increased income tax revenue and reduced income tested benefit payments. See Jacob Kim and Alexandre Laurin, Mothers at Work: The Fiscal Implications of the Proposed Ontario Childcare Rebate (2019) and chapter 6 for more details.
[33] Should the income levels for calculating the CARE tax credit’s benefit rate be adjusted through a future amendment to the Taxation Act, 2007, the FAO’s estimate of the impact of the CARE tax credit to the Province’s budget balance would change.
[34] The CARE tax credit offsets child care expenses for children aged 16 or under.
[35] These estimates are based on the 2019 tax year without behavioural change.
[36] 2019 Ontario Budget, p. 100.
[37] These amounts are then aggregated for each family to determine the family maximum based on the number of children and their age and circumstance. For instance, a family with two children under seven would be eligible for a maximum CARE tax credit benefit up to $12,000.
[38] Ontario Budget 2019, p. 100.
[39] Based on 2015 Canadian Income Survey, which asks families how much was spent on child care for the year, projected to 2019 through the Social Policy Simulation Database and Model.
[40] See Pierre Fortin, Quebec’s Child care Program at 20, Inroads, (2018) for a review of studies analyzing the impact of child care on the female labour force and OECD’s Society at a Glance 2016.
[41] 2019 Ontario Budget, p. 100.
[42] Other factors that affect Ontario’s labour force participation rate compared to other provinces include postsecondary education enrolment rates, industrial make-up, family compositions, social norms, and immigration rates.
[43] See Pierre Fortin, Quebec’s Child care Program at 20, Inroads, (2018) for a review of studies analyzing the impact of child care on the female labour force and OECD’s Society at a Glance 2016.
[44] In Universal Child care, Maternal Labour Supply and Family Well-being (2005), Baker, Gruber and Milligan provide an overview of the literature on the impact of child care costs on the labour supply decision of women. Baker et al. conclude that the elasticity of labour supply for mothers with young children ranges from -0.156 to -0.388. Also see Fortin, Godbout and St-Cerny, Impact of Quebec’s universal low-fee child care program on female labour force participation, domestic income and government budgets, 2012 for a comparison of estimates in the literature.
[45] Two international studies have examined similar scenarios. Although based on a different methodology, a Taiwanese study identified similar economic channels and impacts. A study of Mediterranean countries employed a similar methodology to the FAO and achieved similar results, namely higher female labour force participation rates lead to lower production costs, higher exports, higher private consumption, and a boost to GDP.
[46] Figures represent estimated impacts after a 10-year period of adjustment.
[47] A 10 per cent reduction in child care costs in Ontario would cost around $460 million and generate around $1 billion in real GDP gains. Based on this, the FAO estimates the spending multiplier of child care to be 2.4. This is within the 1.3 to 2.8 range estimated by other studies. See Early Childhood Educators of BC.

