


1. Summary
- This report analyzes the Ministry of Education’s spending plan as set out in the 2022 Ontario Budget and the 2022-23 Expenditure Estimates. The report discusses the FAO’s spending projection by program area and identifies key assumptions, issues and risks. The final chapter of the report compares planned spending for the 2022-23 fiscal year against actual spending in 2021-22.
Ministry of Education Spending Outlook
- Based on current program design and announced commitments, the FAO projects that Ministry of Education (EDU) spending will grow at an average annual rate of 4.5 per cent between 2021-22 and 2027-28, reaching $40.9 billion in 2027-28. In contrast, in the 2022 Ontario Budget, the Province projects that EDU spending will grow at an average annual rate of 3.6 per cent, reaching $38.9 billion in 2027-28.
- The spending gap between the FAO’s projection and the Province’s outlook is $0.4 billion in 2022-23, increasing to $2.0 billion in 2027-28.
- Overall, the FAO estimates that the Ministry of Education spending plan in the 2022 budget has a cumulative $6.0 billion shortfall that will need to be addressed either by allocating more funding to the ministry or by introducing measures that will lower program costs.
School Board Operations
- Spending on school board operations, which comprises approximately 80 per cent of ministry spending, represents total spending by Ontario’s 72 school boards to administer elementary and secondary education.[1] The FAO projects school board operations spending will grow by an average annual rate of 2.7 per cent between 2021-22 and 2027-28.
- The largest component of school board operating spending is compensation, which accounted for approximately 88 per cent of all school board operating spending in 2021-22. Growth in compensation spending is driven by enrolment levels (which impacts staffing levels) and wage rate increases.
- The FAO projects enrolment for students in kindergarten through grade 12 will increase at an average annual rate of 0.8 per cent between 2022-23 and 2027-28, reflecting an expected recovery in the enrolment rate (i.e., enrolment as a share of the student-age population), which declined during the COVID-19 pandemic, and growth in the student-age population. Based on these enrolment levels, the FAO estimates that the number of school board workers will increase from approximately 289,000 in 2021-22 to 300,000 in 2027-28, for an average annual growth rate of 0.7 per cent.
- School board employee wages are largely set by collective bargaining agreements. The most recent round of agreements for the education sector expired on August 31, 2022.
- The FAO’s spending projection for the Ministry of Education reflects information available as of October 12, 2022. As of that date, new collective agreements for school board employees had not been reached. Consequently, the FAO’s spending projection in this report assumes school board employees’ wages will increase at an average annual rate of 2.2 per cent per year, which reflects historical average wage growth in the education sector.
- Since, as of the writing of this report, new collective agreements for school board workers have not been reached,[2] the FAO has estimated the potential impact of two additional bargaining outcomes to the FAO’s spending projection. If school board workers receive average wage increases of 3.2 per cent per year over the next three years, followed by a return to historical wage growth, the FAO estimates that it would increase its projection for school board compensation spending by $113 million in 2022-23, growing to $620 million in 2027-28. Under this scenario, the FAO’s projection for school board compensation spending would increase by $2.7 billion over six years.
- In the second scenario, if school board workers receive an average wage increase of 4.2 per cent per year over three years, followed by a return to historical average wage growth of 2.2 per cent, then it would increase the FAO’s projection for school board compensation spending by $226 million in 2022-23, growing to $1.3 billion in 2027-28. Under this scenario, which nearly matches expected inflation over this period,[3] the FAO’s projection for school board compensation spending would increase by $5.5 billion over six years.
- Additional risk to the FAO’s compensation spending projection: In response to Bill 124, which capped public sector base salary increases to one per cent per year for a period of three years, a coalition of over 40 Ontario unions launched a lawsuit to challenge the legislation. If the lawsuit is successful, the FAO estimates that the cost to the Ministry of Education could be $1.5 billion in 2022-23, assuming retroactive payments, and, over the entire six-year projection period, total incremental spending could reach $4.4 billion.
School Board Capital Amortization Expense and Investments
- In the 2022 Ontario Budget, the Province plans to invest $21.2 billion in education sector infrastructure over 10 years, from 2022-23 to 2031-32. The $21.2 billion investment represents a $1.5 billion (eight per cent) increase from the $19.7 billion education sector infrastructure investment over the previous 10 years from 2012-13 to 2021-22. However, after adjusting for inflation, the 10-year education sector infrastructure spending plan in the 2022 budget represents a $3.0 billion (14 per cent) spending decline (in 2021 dollars) compared to the previous 10-year period.
Child Care
- The child care program area consists primarily of transfer payments to Consolidated Municipal Service Managers and District Social Services Administration Boards to support licensed child care, and child and family programs in the province.
- On March 28, 2022, the Province announced an agreement with the federal government to “lower fees for families and deliver an average of $10 a day child care by September 2025.”[4] As the Province begins to implement the new $10-a-day child care program, provincial spending on the child care program area will increase significantly, from $2.2 billion in 2021-22 (about seven per cent of ministry spending) to a projected $6.5 billion in 2027-28, representing an average annual growth rate of 19.9 per cent.
- The Agreement[5] has two main objectives. The first is to reduce the cost of licensed child care for children under age six to an average cost of $10 per day by September 2025. The second objective is to add 71,000 net new licensed child care spaces for children under age six by the end of 2026. Overall, the Agreement calls for a total investment in child care of $10.5 billion over five years, of which 97 per cent of the funds will be provided by the federal government.
- The FAO’s preliminary review identified four key issues associated with the Agreement.
Issue 1: How does the Province plan to create 71,000 net new licensed child care spaces for children under age six?
- Under the Agreement, the ministry has committed to create 71,000 net new licensed child care spaces by the end of 2026, including 27,000 net new licensed spaces by the end of 2023.[6] If achieved, this would bring the total number of licensed child care spaces for children under age six to 375,111 by the end of 2026. The ministry plans to create 71,000 net new spaces through what it terms natural growth (48,459 spaces) and induced demand (22,406 spaces).
- To support the creation of the 71,000 net new licensed child care spaces by providers, the ministry plans to: fund the creation of licensed child care spaces in schools, provide funding for start-up grants, and provide funding for training and increased wages. However, uncertainties over some aspects of the $10-a-day child care program, such as the extent of ministry reimbursement of future cost increases to child care providers, could reduce incentives for child care providers to create spaces.
- If the target of 71,000 net new licensed child care spaces is achieved, the FAO projects that the number of licensed child care spaces as a share of the population of children under age six would increase from 35.3 per cent in 2021 to 40.8 per cent in 2026. For context, the number of licensed child care spaces as a share of the population of children under age six was 20.4 per cent in 2011.
Issue 2: How many child care providers will enrol in the $10-a-day child care program?
- Although the Agreement calls for the creation of 71,000 net new licensed child care spaces for children under age six, it does not specify a target for how many licensed child care providers (existing or new) will enrol in the program to provide $10-a-day child care. Therefore, it is not certain how many of the expected 375,111 licensed child care spaces for children under age six, as of the end of 2026, will be enrolled in the $10-a-day child care program.
- Child care providers who enrol in the program will provide discounted child care to parents in exchange for an equivalent amount in government subsidies. While the agreement offers a significant financial benefit for parents, child care providers do not receive any more revenue than they would otherwise receive for a given child. At the same time, enrolled child care providers will face new regulatory restrictions, including caps on future fee increases. However, child care providers who do not enrol may face the risk of operating below licensed capacity as families may choose subsidized competitors.
Issue 3: Is there enough funding available to support $10-a-day child care for all who want it?
- Based on the FAO’s preliminary analysis, the funding allocated to the $10-a-day child care program from 2022-23 to 2025-26 is likely sufficient to achieve the child care fee reduction targets for the 375,111 planned licensed child care spaces (assuming full take-up of the program by licensed child care providers). If more than the planned number of licensed child care spaces are created and enrolled, there is a risk that program funding could be exhausted.
- However, even if the Province is able to create and enrol 375,111 $10-a-day licensed child care spaces by 2026, the FAO estimates that there may still be significant excess demand for the $10-a-day program. The FAO estimates that by 2026, Ontario families of approximately 602,257 children under age six will wish to have access to $10-a-day child care. With only 375,111 $10-a-day licensed child care spaces planned, the families of 227,146 children under age six (25 per cent of the projected under age six population of 919,866 children in 2026) would be left wanting but unable to access $10-a-day child care.
Issue 4: Will the federal government continue to fully fund the program?
- The Agreement signed by the Province and the federal government concludes in 2025-26. The federal government has signalled its intention to renew the Agreement and has committed a minimum funding amount of $2.9 billion for 2026-27, while the Province has committed $128 million. Based on the FAO’s preliminary review of the $10-a-day child care program, the FAO estimates that the Province will need to spend $4.3 billion in both 2026-27 and 2027-28 to maintain the program. This means that there is a committed funding shortfall of $1.2 billion in 2026-27 (based on the minimum federal and provincial commitment) and $4.3 billion in 2027-28 (based on the absence of any federal or provincial commitment) pending a renewal/extension of the Agreement.
- In addition to the risk of program underfunding, there is a risk that the federal government could choose not to continue the program after the Agreement expires in 2025-26. For example, in 2006, the federal government cancelled its 2005 Early Learning and Child Care Agreement with Ontario and did not provide any further funding beyond 2006-07 towards its commitments under that agreement.
Other Program Areas
- Chapter 4 of the report concludes with a discussion of the FAO’s spending projection for the Ontario Teachers’ Pension Plan, ministry operations and other education programs. Combined, these three program areas accounted for $2.2 billion (seven per cent) of ministry spending in 2021-22. The FAO projects spending in these program areas will grow by an average annual rate of 2.2 per cent between 2021-22 and 2027-28.
2022-23 Expenditure Estimates Review
- Chapter 5 reviews 2022-23 requested and projected spending for the Ministry of Education, as outlined in the 2022-23 Expenditure Estimates, by program vote (Supply Bill spending), standalone legislation (statutory) spending, and other spending (consolidation and other adjustments).
2. Introduction
This report reviews the Ministry of Education’s spending plan in the 2022 Ontario Budget and the 2022-23 Expenditure Estimates. The report is organized as follows:
- Chapter 3 discusses the FAO’s projection for ministry spending from 2022-23 to 2027-28, based on current program design and announced commitments, and compares this spending projection against the ministry’s spending plan in the 2022 budget.
- Chapter 4 reviews projected ministry spending by major program area and identifies key assumptions, issues and uncertainties behind the FAO’s spending forecast. Included in this chapter is a discussion of the new $10-a-day child care program.
- Chapter 5 reviews the ministry’s 2022-23 Expenditure Estimates, which constitutes the government’s formal request to the legislature for spending authority in the 2022-23 fiscal year, and compares planned spending for the 2022-23 fiscal year against actual spending in 2021-22.
3. Ministry of Education Spending Outlook
Based on current program design and announced commitments, the FAO projects that Ministry of Education (EDU) spending will grow at an average annual rate of 4.5 per cent between 2021-22 and 2027-28, reaching $40.9 billion in 2027-28. In contrast, in the 2022 Ontario Budget, the Province projects that EDU spending will grow at an average annual rate of 3.6 per cent, reaching $38.9 billion in 2027-28. The spending gap between the FAO’s projection and the Province’s outlook increases from $0.4 billion in 2022-23 to $2.0 billion in 2027-28. Overall, the cumulative spending gap from 2022-23 to 2027-28 is $6.0 billion. To address the shortfall, the Province will need to either increase funding to the education sector or introduce new spending restraint measures.
Figure 1 Ministry of Education spending projections, FAO vs. 2022 Ontario Budget, $ billions
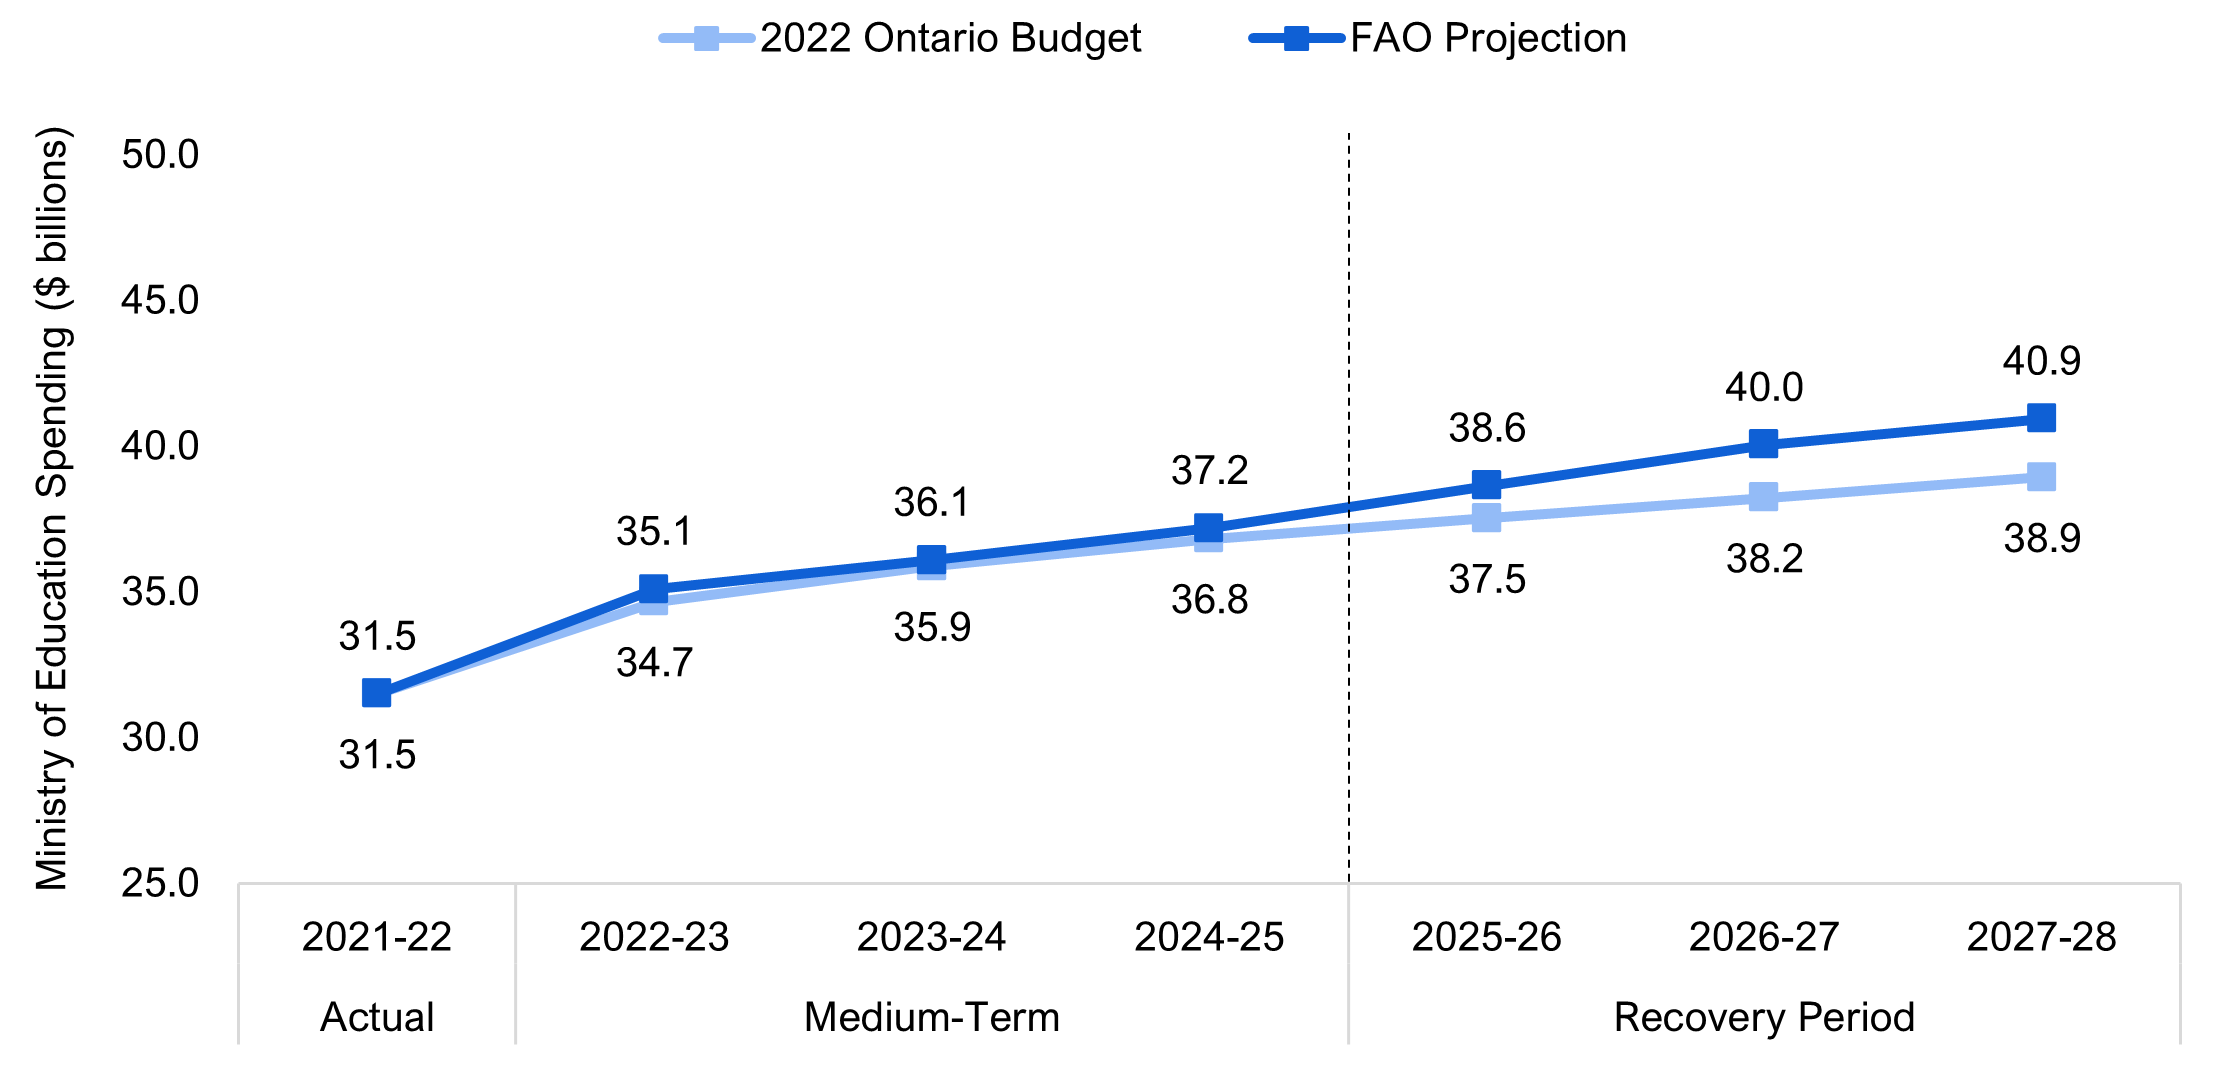
Note: Ministry of Education spending includes the Ontario Teachers’ Pension Plan (OTPP).
Source: 2021-22 Public Accounts of Ontario, 2022 Ontario Budget and FAO analysis of information provided by the Province.
Medium Term: In 2022-23, the FAO’s projection for EDU spending is $0.4 billion higher than the Province’s spending plan in the 2022 Ontario Budget, primarily due to the addition of the $365 million Catch Up Payments program announced after the release of the 2022 budget.[7] The spending gap between the two projections narrows to $0.2 billion in 2023-24, before returning to $0.4 billion in 2024-25. Overall, the FAO projects 5.7 per cent average annual growth between 2021-22 and 2024-25. In contrast, the Province forecasts slower growth, averaging 5.3 per cent over the medium term.
Recovery Period: The Province plans to reduce the growth rate of EDU spending to an annual average of 1.9 per cent between 2024-25 and 2027-28. Based on current program design and announced commitments, the FAO projects spending will grow at an average annual rate of 3.3 per cent over the same period. As a result, the FAO projects that education spending will be $2.0 billion higher in 2027-28 compared to the forecast in the 2022 budget.
4. Spending Outlook by Program Area
Between 2021-22 and 2027-28, the FAO projects Ministry of Education spending will grow at an average annual rate of 4.5 per cent. By program area, the FAO projects spending on school board operations will increase at an average annual rate of 2.7 per cent over the outlook, while school board capital spending will increase at an average annual rate of 3.4 per cent. The FAO projects child care spending will increase at an average annual rate of 19.9 per cent due to the signing of the Canada – Ontario Canada-wide Early Learning and Child Care Agreement, which includes the Province’s commitment to provide an average of $10-a-day child care by 2025. Spending on the Ontario Teachers’ Pension Plan (OTPP) and ministry operations is projected to grow by annual averages of 2.3 per cent and 2.4 per cent, respectively. Finally, the FAO projects spending on other education programs will increase at an average annual rate of 1.1 per cent.
| Program Area | 2021-22 Actual Spending ($ millions) |
2027-28 Projected Spending ($ millions) |
Average Annual Growth Rate (%) 2021-22 to 2027-28 |
|
|---|---|---|---|---|
| School Board Operations | 25,549 | 29,997 | 2.7 | |
| School Board Capital | 1,567 | 1,915 | 3.4 | |
| Child Care | 2,203 | 6,543 | 19.9 | |
| Ontario Teachers’ Pension Plan | 1,610 | 1,847 | 2.3 | |
| Ministry Operations | 317 | 364 | 2.4 | |
| Other Education Programs | 262 | 279 | 1.1 | |
| Total Ministry of Education | 31,507 | 40,945 | 4.5 | |
The following sections describe each program area and identify the key assumptions, issues and uncertainties behind the FAO’s spending projection.
School Board Operations
Spending on school board operations, which comprises approximately 80 per cent of total ministry spending, represents total spending by Ontario’s 72 school boards to administer elementary and secondary education.[8] The primary funding source for school board operations is the ministry’s Grants for Student Needs program, which includes funding for teachers, school administration and other staff, classroom supplies, and specific priorities such as special education, student transportation and mental health. The FAO projects school board operations spending will grow by an average annual rate of 2.7 per cent between 2021-22 and 2027-28. The following discussion outlines the key assumptions and risks underlying the FAO’s forecast for school board operations spending.
Compensation
The largest component of school board operating spending is compensation, which comprised approximately 88 per cent of all school board operating spending in 2021-22. Growth in compensation spending is driven by enrolment levels, which impact the overall number of teachers and other employees, and wage increases, which are largely negotiated through collective bargaining agreements. Overall, total spending on compensation is projected to grow from an estimated $18.8 billion in 2022-23 to $21.0 billion in 2027-28, representing an average annual growth rate of 2.3 per cent.[9]
Enrolment Growth
The FAO projects enrolment for students in kindergarten through grade 12 will increase at an average annual rate of 0.8 per cent between the 2022-23 and 2027-28 school years. This is in line with historical growth prior to the COVID-19 pandemic. Between 2015-16 and 2019-20, enrolment increased at an average annual rate of 0.8 per cent. As a result of the COVID-19 pandemic, enrolment declined by 1.5 per cent in the 2020-21 school year and remained relatively flat at 0.2 per cent average annual growth in 2021-22 and 2022-23 (estimated).The FAO’s forecast reflects an expected recovery in the enrolment rate (i.e., enrolment as a share of the student-age population), which declined during the COVID-19 pandemic, and growth in the student-age population.
Figure 2 Historical and projected enrolment, 2015-16 to 2027-28 school years
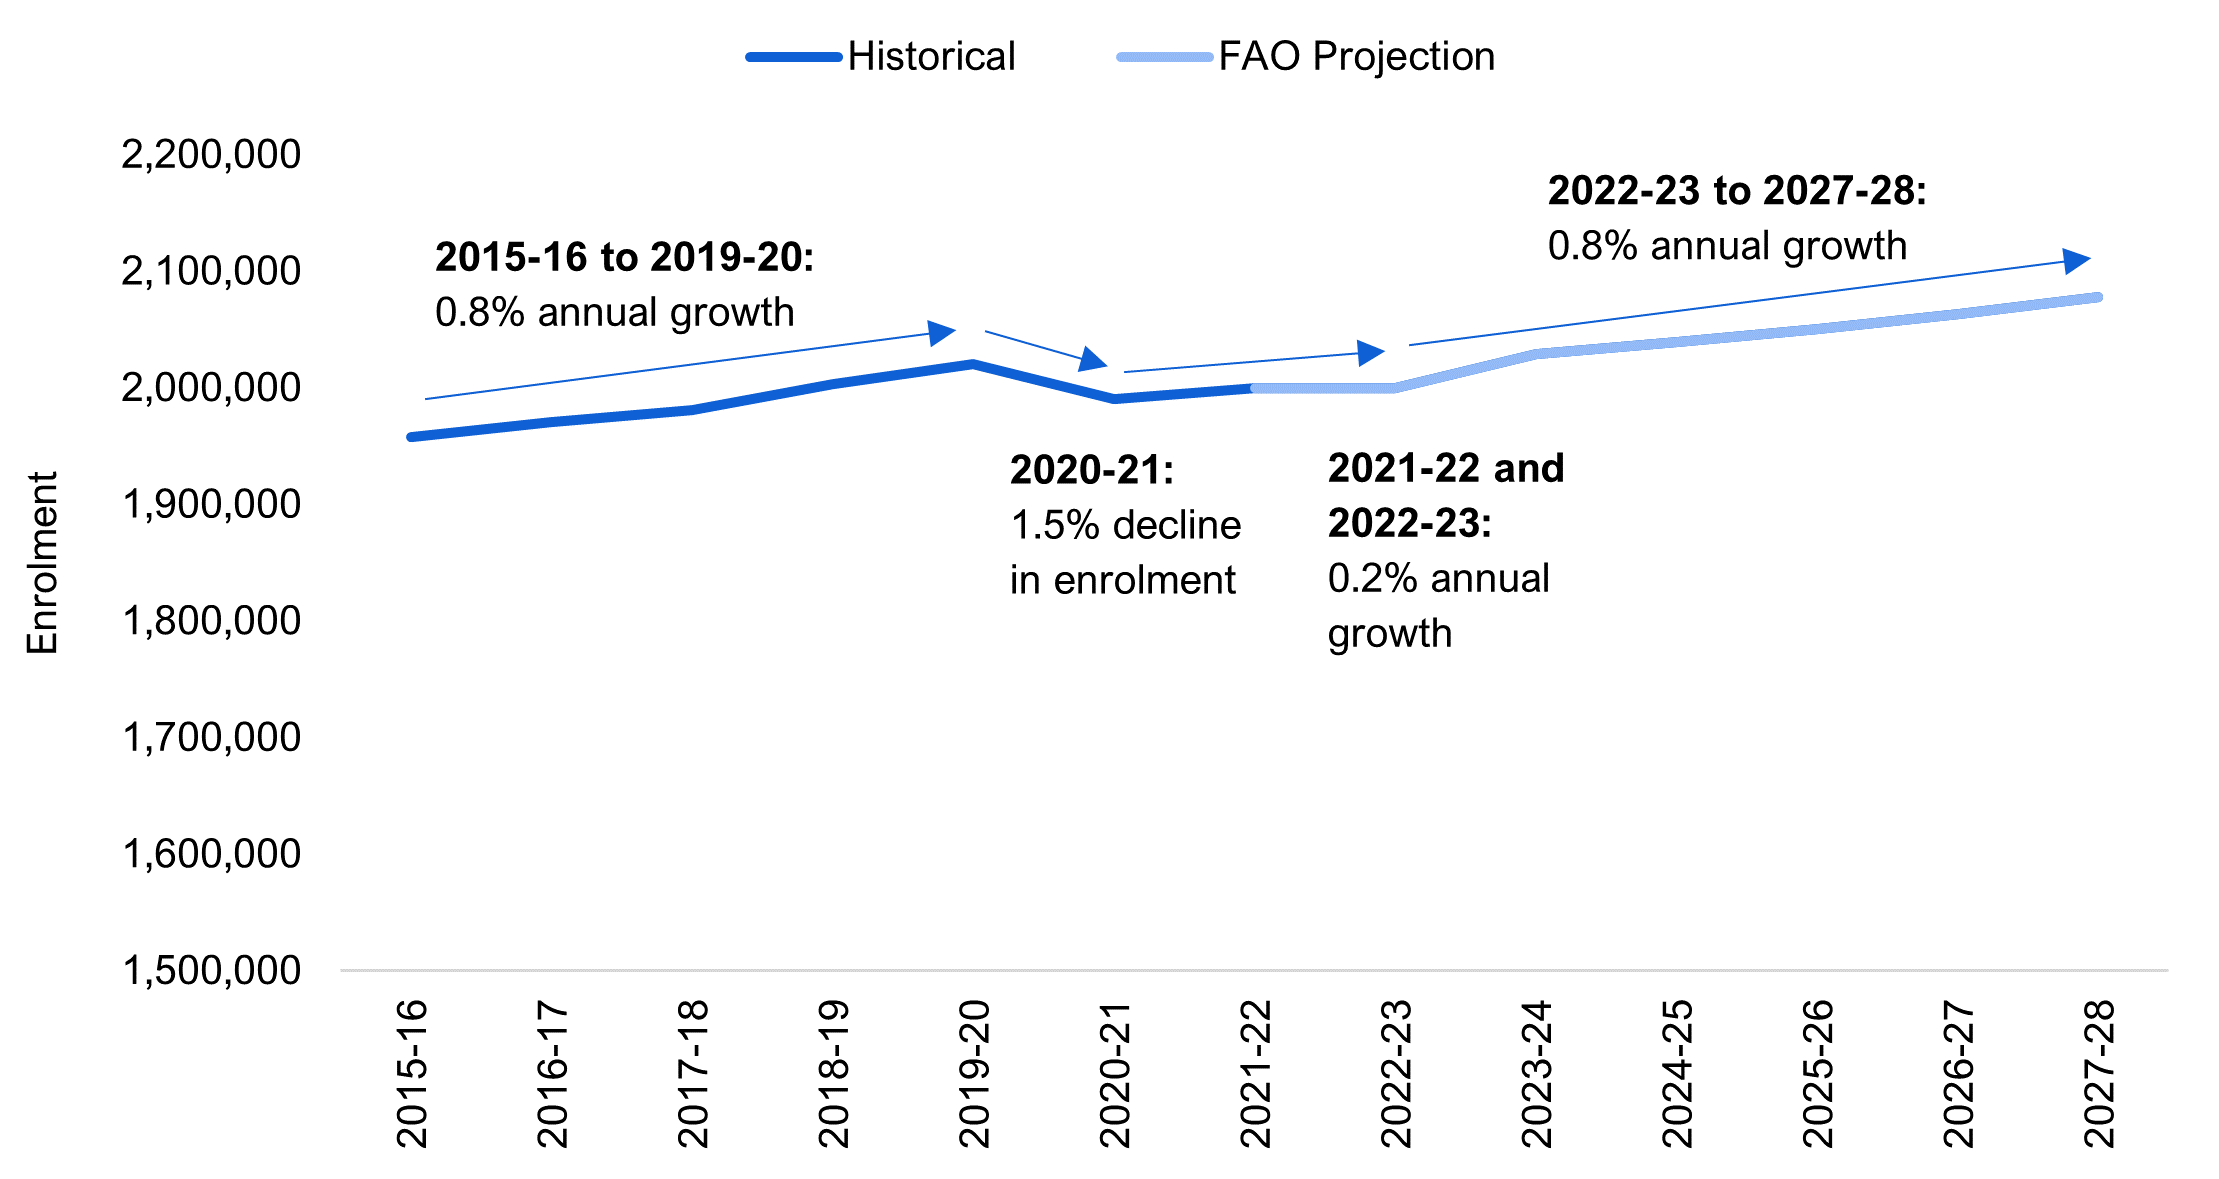
Source: Statistics Canada, Ministry of Finance and FAO analysis of information provided by the Province.
As noted above, enrolment growth primarily drives staff levels in school boards, given regulated class sizes. The FAO estimates that the number of school board education workers will increase from approximately 289,000 in 2021-22 to 300,000 in 2027-28, for an average annual growth rate of 0.7 per cent.
Wage Growth
School board employee wages are largely set by collective bargaining agreements. The most recent round of agreements for the education sector expired on August 31, 2022. These agreements, which impacted approximately 258,000 school board workers, included 1.0 per cent base wage increases each year for three years as mandated by provincial wage restraint legislation known as Bill 124.[10]
The FAO’s spending projection for the Ministry of Education reflects information available as of October 12, 2022. As of that date, new collective agreements for school board employees had not been reached. Consequently, the FAO’s spending projection in this report assumes school board employees’ wages will increase at an average annual rate of 2.2 per cent per year, which reflects historical average wage growth in the education sector.
On November 3, 2022, the Ontario legislature passed the Keeping Students in Class Act, 2022, which imposed a collective agreement on approximately 55,000 education workers who are members of the Canadian Union of Public Employees (CUPE). However, as of the writing of this report, the Province has announced that it intends to introduce legislation that, if passed, would repeal the Keeping Students in Class Act, 2022, and that the ministry would restart collective agreement negotiations with CUPE.
Since, as of the writing of this report, new collective agreements for school board workers have not been reached, the FAO has estimated the potential impact of two additional bargaining outcomes to its spending projection. As noted above, the FAO’s spending projection in this report assumes that school board employee wages will increase at an average annual rate of 2.2 per cent per year, which reflects historical average wage growth in the education sector. Alternatively, if school board workers receive average wage increases of 3.2 per cent per year over three years, followed by a return to historical wage growth, the FAO estimates that it would increase school board compensation spending by $113 million in 2022-23, growing to $620 million in 2027-28. Under this scenario, the FAO’s projection for school board compensation spending would increase by $2.7 billion over six years. In the second scenario, if school board workers receive an average wage increase of 4.2 per cent per year over three years, followed by a return to historical average wage growth of 2.2 per cent, then the FAO’s projection for school board compensation spending would increase by $226 million in 2022-23, growing to $1.3 billion in 2027-28. Under this scenario, which nearly matches expected inflation over this period,[11] the FAO’s projection for school board compensation spending would increase by $5.5 billion over six years.
| 2022-23 | 2023-24 | 2024-25 | 2025-26 | 2026-27 | 2027-28 | Total | |||
|---|---|---|---|---|---|---|---|---|---|
| 2.2% annual wage growth (FAO base case) | - | - | - | - | - | - | - | ||
| 3.2% annual wage growth over three years, then 2.2% | 113 | 303 | 500 | 587 | 603 | 620 | 2,726 | ||
| 4.2% annual wage growth over three years, then 2.2% | 226 | 607 | 1,008 | 1,186 | 1,219 | 1,254 | 5,501 | ||
Additional Risk to the Compensation Spending Projection: the Court Challenge to Bill 124
In response to Bill 124, which capped public sector base salary increases to one per cent per year for a period of three years, a coalition of over 40 Ontario unions launched a lawsuit to challenge the legislation. In the lawsuit, the unions argue that Bill 124 infringed on their rights to associate and collectively bargain as guaranteed under the Canadian Charter of Rights and Freedoms. The unions have asked the court to declare Bill 124 null and void, and that the Province repay workers for lost earnings. As of the writing of this report, a decision is expected in 2023.
To illustrate the potential increase in Ministry of Education spending if the lawsuit is successful, the FAO developed a scenario where school board employees are compensated for wage restraint that applied under Bill 124, estimated as the difference between historical average wage growth and the amount received under collective agreements subject to Bill 124. Overall, the FAO estimates that the cost to the ministry could be $1.5 billion in 2022-23, assuming retroactive payments, and, over the entire projection period, total incremental spending could reach $4.4 billion.
Figure 3Potential impact of a successful Bill 124 court challenge to the FAO’s projection for school board compensation spending, 2021-22 to 2027-28
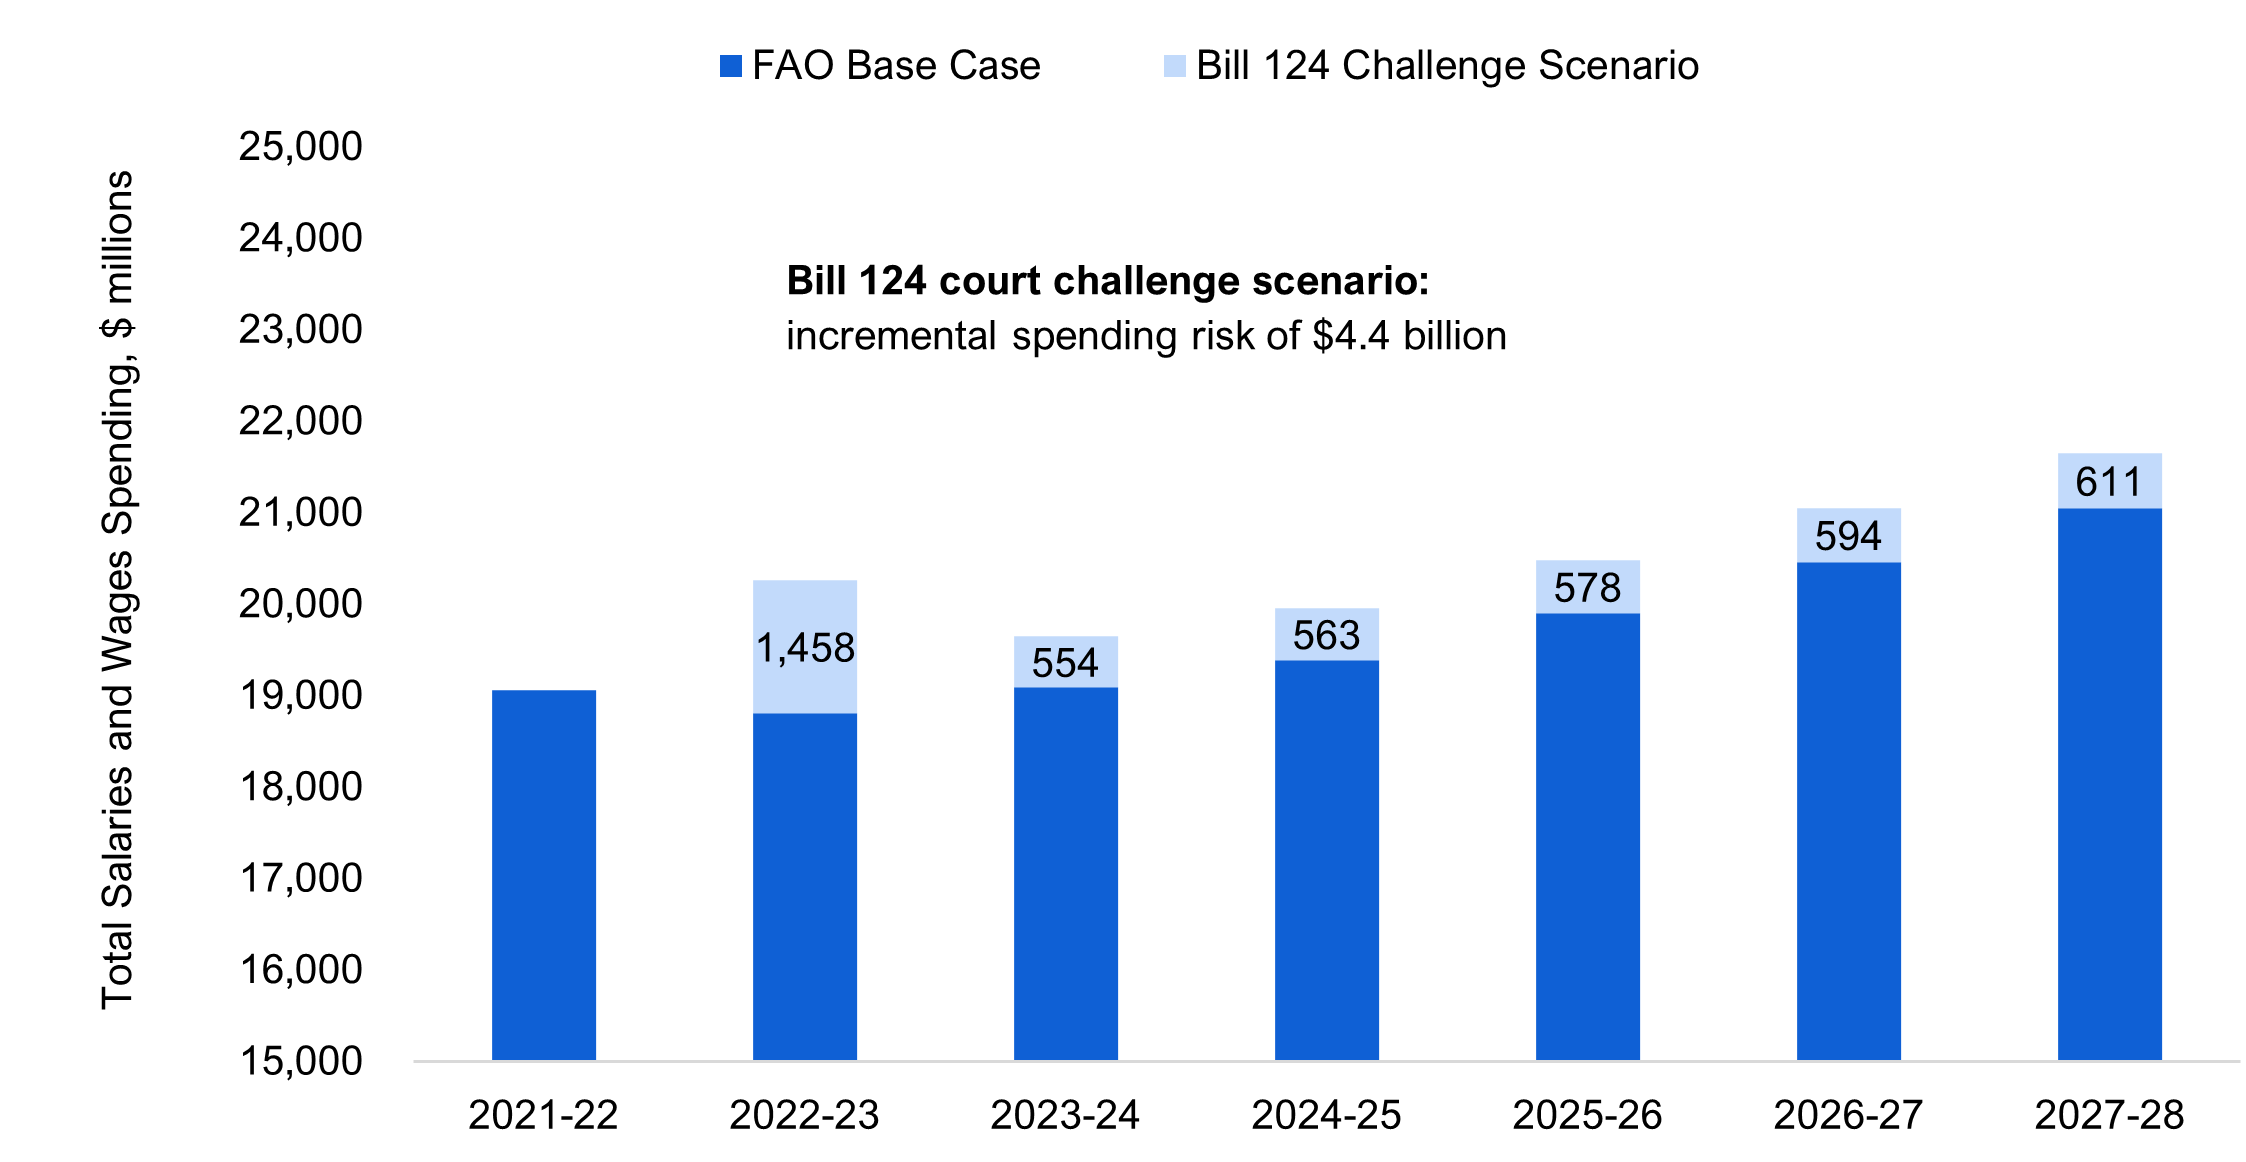
Note: If the Bill 124 court challenge is successful, assumes that unionized school board employees are compensated for Bill 124 wage growth restrictions that have applied since 2019, estimated as the difference between historical average wage growth and the amount received under collective agreements subject to Bill 124 wage restraint.
Source: FAO estimates.
Non-Compensation Spending
For non-compensation school board operating spending, such as classroom supplies and school facilities services, the FAO assumes 4.4 per cent and 3.5 per cent growth in 2022-23 and 2023-24, respectively, before a return to historical spending growth of 1.5 per cent. Higher non-compensation spending growth in 2022-23 and 2023-24 reflects the expected impact of inflationary pressures on education supplies and services.[12]
School Board Capital
School board capital spending reflects the amortization expense for school board infrastructure assets. Investments in school board infrastructure are amortized and expensed over the useful life of the asset. These assets include approximately 5,000 school buildings, totalling about 290 million square feet, as well as machinery and equipment (such as laboratory equipment and facility maintenance machinery). The FAO projects school board capital spending will increase at an average annual rate of 3.4 per cent, based on the amortization profile of school boards’ infrastructure assets and the Province’s 10-year infrastructure plan for schools in the 2022 Ontario Budget.
Investments in School Board Capital Assets
The Province provides funding to invest in school board infrastructure through the School Board Capital Grants program and, on a time-limited basis, the Investing in Canada Infrastructure Program. School boards use these funds to either rehabilitate existing assets (to keep assets in a state of good repair) or build new assets (i.e., expansion projects). In the 2022 Ontario Budget, the Province plans to invest $21.2 billion in education sector infrastructure over the 10-year period from 2022-23 to 2031-32, which is unchanged from the planned 10-year investment from the 2021 Ontario Budget.
If the $21.2 billion planned investment in education sector infrastructure is achieved, it would be a $1.5 billion (eight per cent) increase from the $19.7 billion education sector infrastructure investment over the previous 10 years from 2012-13 to 2021-22. However, on a real basis, the Province’s 10-year education infrastructure plan in the 2022 budget represents a decline in spending on infrastructure assets compared to the previous 10-year period. After adjusting for inflation, the Province spent $21.4 billion over the previous 10 years (in 2021 dollars), and plans to spend $18.3 billion (in 2021 dollars) over the next 10 years. Therefore, in real terms, the 10-year education sector infrastructure spending plan in the 2022 budget represents a $3.0 billion (14 per cent) spending decline compared to the previous 10-year period.
Figure 4 Actual and planned investments in education sector infrastructure assets in nominal and real (2021) dollars, 2012-13 to 2031-32, $ millions
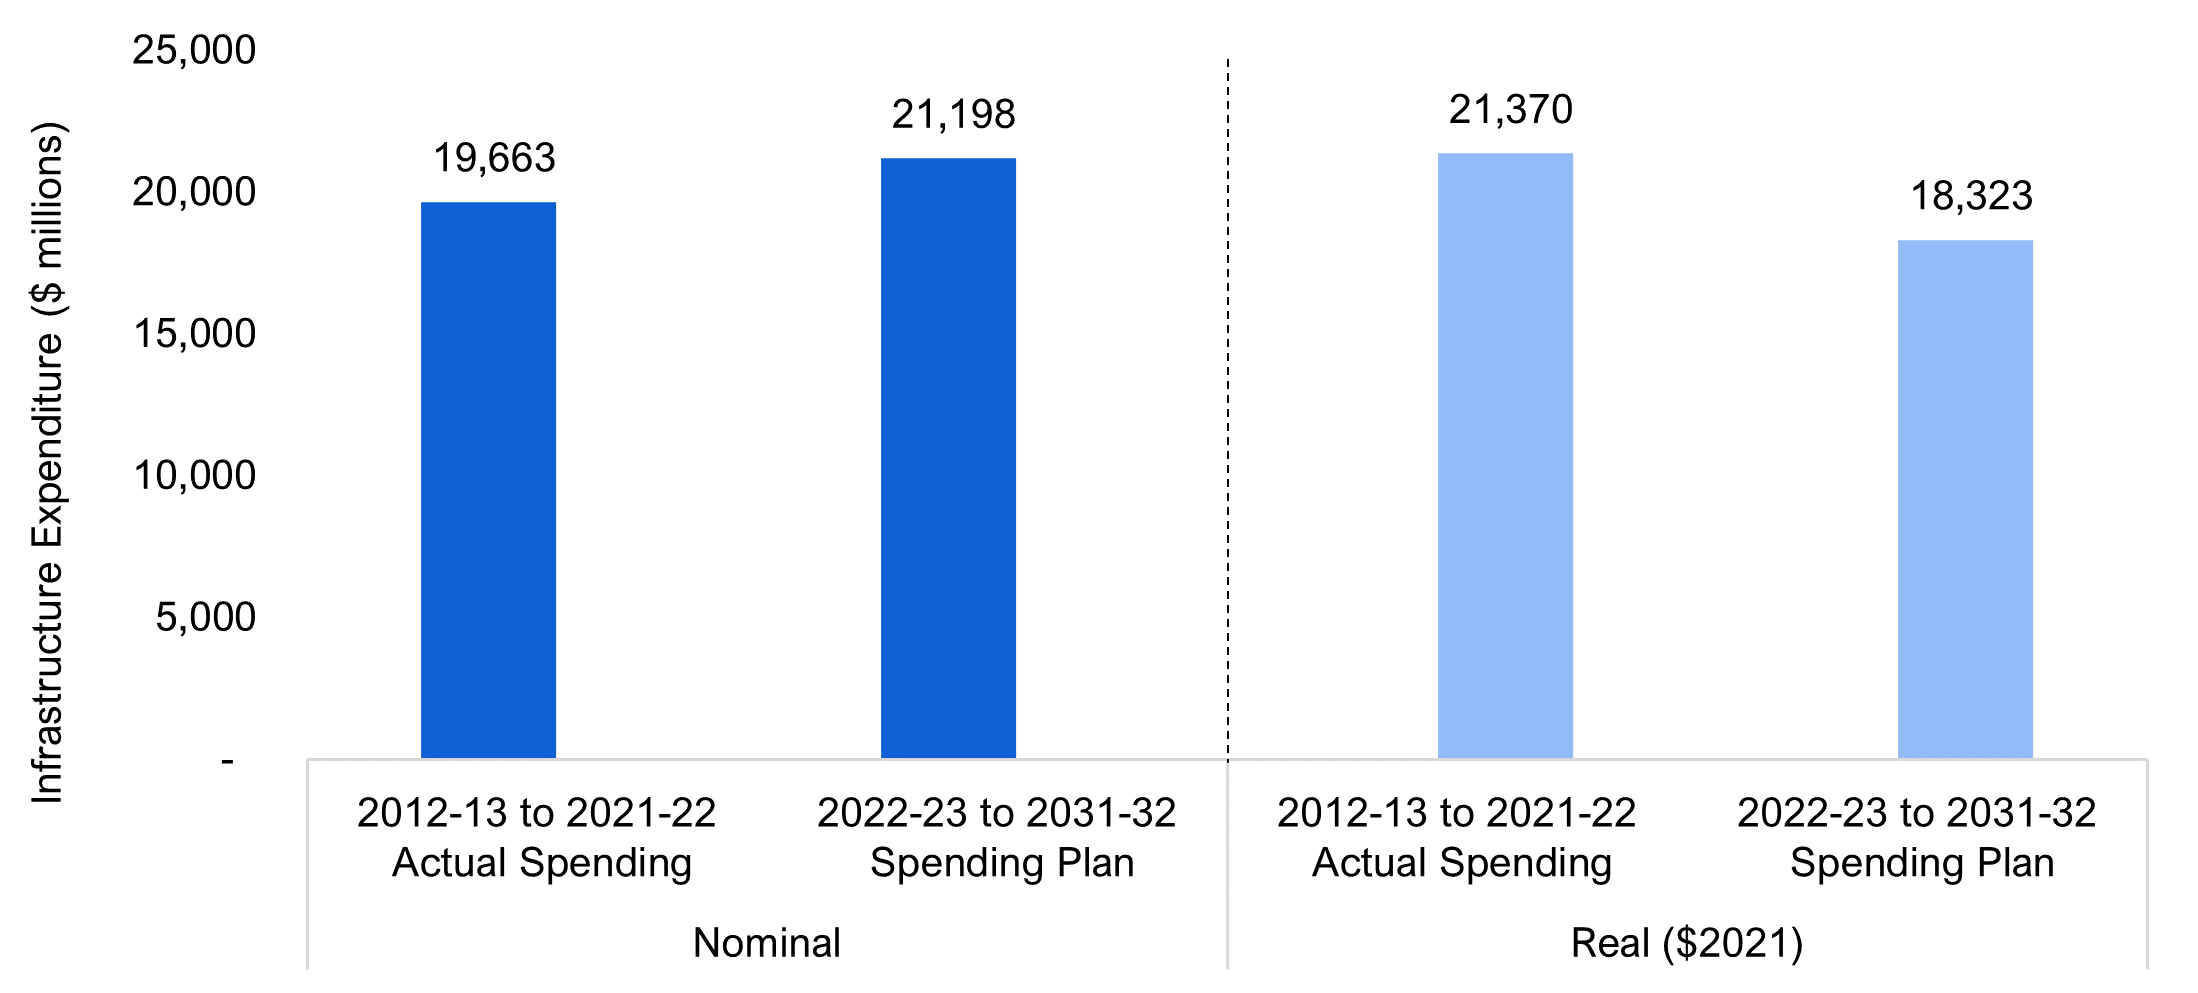
Source: FAO analysis of information provided by the Province.
Child Care
Overview
The child care program area consists primarily of transfer payments to Consolidated Municipal Service Managers and District Social Services Administration Boards to support licensed child care, and child and family programs in the province. The program area also includes funding for the Childcare Access and Relief from Expenses (CARE) tax credit and spending on other programs, including First Nations child care and EarlyON Child and Family Centres.
On March 28, 2022, the Province announced an agreement with the federal government to “lower fees for families and deliver an average of $10 a day child care by September 2025.”[13] As the Province begins to implement the new $10-a-day child care program, provincial spending on the child care program area will increase significantly, from $2.2 billion in 2021-22 to a projected $6.5 billion in 2027-28, representing an average annual growth rate of 19.9 per cent.
The Child Care Agreement
Under the Canada – Ontario Canada-wide Early Learning and Child Care Agreement (the Agreement),[14] the federal government will provide the Province with $10.2 billion over five years to support child care in Ontario, while the Province will add $268 million. Overall, the Agreement calls for a total investment in child care of $10.5 billion over five years, of which 97 per cent of the funds will be provided by the federal government.
| 2021-22 | 2022-23 | 2023-24 | 2024-25 | 2025-26 | 2021-22 to 2025-26 | |||
|---|---|---|---|---|---|---|---|---|
| Federal Contributions | - | 1,458 | 2,286 | 2,848 | 3,640 | 10,232 | ||
| Provincial Contributions | - | 33 | 55 | 77 | 102 | 268 | ||
| Total Contributions | - | 1,491 | 2,341 | 2,925 | 3,742 | 10,500 | ||
The Agreement has two main objectives. The first is to reduce the cost of licensed child care for children under age six to an average cost of $10 per day by September 2025. The ministry plans to achieve this target through four steps: an average 25 per cent reduction in child care fees retroactive to April 1, 2022; a further 50 per cent reduction in child care fees, on average, by the end of December 2022; further fee reductions in September 2024; and a final reduction to an average of $10-a-day child care by September 2025.[15] Overall, under the $10-a-day child care program, the average cost of licensed child care for children under age six in Ontario will drop from an estimated $46 per day as of January 2022[16] to an average $10 per day by September 2025, a decline of 78.3 per cent.
Figure 5 Estimated average daily cost of licensed child care in Ontario for children under age six under the $10-a-day child care program, 2022 to 2026, $
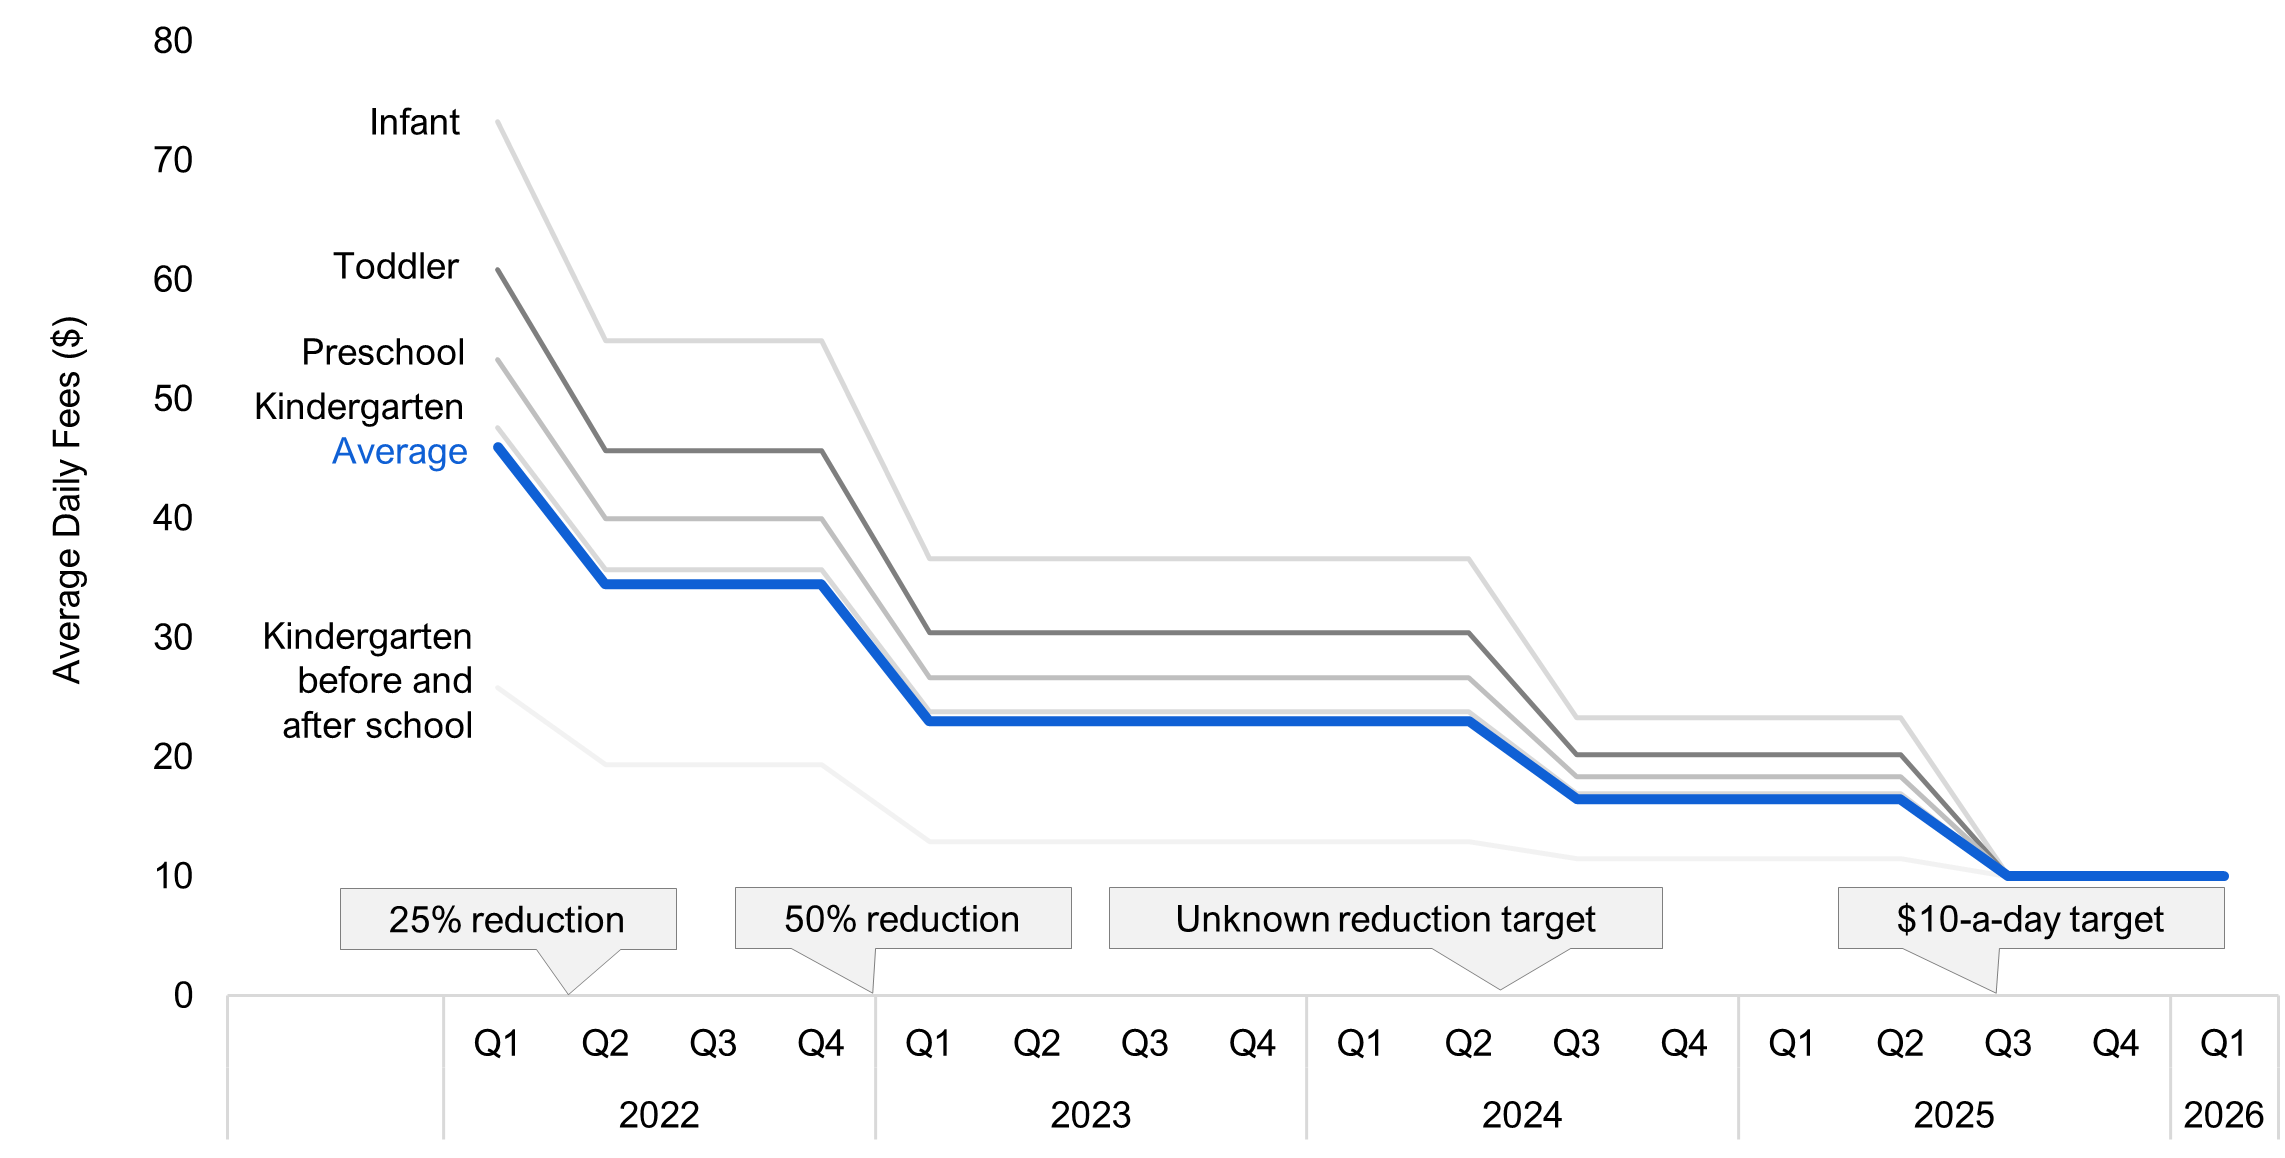
Note: “Average” daily rate includes all licensed child care (homes and centres). Daily rate by category is for licensed child care centres only.
Source: FAO analysis of the Canada – Ontario Canada-wide Early Learning and Child Care Agreement.
The second objective of the Agreement is to add 71,000 net new licensed child care spaces for children under age six by the end of 2026. This commitment includes the creation of 27,000 new spaces by the end of 2023. If achieved, Ontario would have 375,111 licensed child care spaces for children under age six by the end of 2026.
Under the Agreement, the Province has also committed to increase wages for Registered Early Childhood Educators (RECEs). Starting in 2022, RECEs at enrolled child care providers must be paid at least $18 per hour (the wage floor). Going forward, the wage floor will increase by $1 per hour in each of 2023, 2024 and 2025. In addition, all RECEs will receive annual $1 per hour wage increases in each of those years up to a maximum of $25 per hour. There are also wage adjustments for RECE supervisors and home child care visitors.
The Ministry of Education plans to spend $1.5 billion in 2022-23 and $2.3 billion in 2023-24 under the Agreement. This includes $1.1 billion in 2022-23 and $1.6 billion in 2023-24 to reduce child care fees. The remaining planned spending in 2022-23 and 2023-24 of $353 million and $694 million, respectively, is for wage enhancements, professional development, growth in spaces, start-up grants and administrative costs.
| Area | Initiative | 2022-23 ($ millions) |
2023-24 ($ millions) |
|
|---|---|---|---|---|
| Affordability | Reducing child care fees for children under age six* | $1,139 | $1,648 | |
| Quality | Wage enhancements* | $53 | $94 | |
| Quality | Professional development and other initiatives | $50 | $149 | |
| Access | Growth in spaces (including fee reductions and wage supports) | $53 | $218 | |
| Access | Start-up grants | $106 | $107 | |
| Implementation and ongoing supports | Implementation, administration and IT costs | $91 | $126 | |
| Total | $1,491 | $2,341 | ||
Key Issues
This section provides a preliminary review of several key issues associated with the Agreement. Specifically:
- How does the Province plan to create 71,000 net new licensed child care spaces for children under age six?
- How many child care providers will enrol in the $10-a-day child care program?
- Is there enough funding available to support $10-a-day child care for all who want it?
- Will the federal government continue to fully fund the program?
How does the Province plan to create 71,000 net new licensed child care spaces for children under age six?
As of the end of 2021, there were 304,246 licensed child care spaces in Ontario for children under age six. Under the Agreement, the ministry has committed to create 71,000 net new licensed child care spaces by the end of 2026, including 27,000 net new licensed spaces by the end of 2023.[17] If achieved, this would bring the total number of licensed child care spaces for children under age six to 375,111 by the end of 2026.
The ministry plans to create 71,000 net new spaces through natural growth and induced demand. Natural growth is expected to add 48,459 spaces by the end of 2026, while induced demand is expected to add 22,406 spaces.
| 2019 | 2020 | 2021 | 2022 | 2023 | 2024 | 2025 | 2026 | 2022 to 2026 | ||
|---|---|---|---|---|---|---|---|---|---|---|
| Start of year | 289,111 | 299,984 | 298,004 | 304,246 | 313,374 | 330,936 | 348,780 | 364,838 | ||
| Natural growth | 10,873 | -1,980 | 6,242 | 9,128 | 9,401 | 9,683 | 9,974 | 10,273 | 48,459 | |
| Induced demand | 8,161 | 8,161 | 6,084 | 22,406 | ||||||
| End of year | 299,984 | 298,004 | 304,246 | 313,374 | 330,936 | 348,780 | 364,838 | 375,111 | ||
| Net new spaces vs. end of 2021 | 9,128 | 26,690 | 44,534 | 60,592 | 70,865 | |||||
The ministry expects to add 48,459 licensed child care spaces by the end of 2026 through natural growth. The ministry assumes that the number of spaces will naturally grow by three per cent each year, based on a long-term historical average that excludes several years affected by the rollout of full-day kindergarten. The ministry did not identify the factors that might drive natural growth.
The ministry also expects that the number of licensed child care spaces will increase through “induced demand.” The ministry expects that, as licensed child care becomes progressively more affordable, more families will seek licensed child care, which will result in child care providers increasing the supply of spaces.
Measures to increase the supply of licensed child care spaces
To support the creation of licensed child care spaces by providers, the ministry is implementing a number of measures:
- Funding the creation of 30,000 licensed child care spaces in schools, within the Ministry of Education’s school board capital program. It is expected that part of these new licensed child care spaces will count towards the 71,000 net new spaces commitment in the Agreement.
- Providing funding for start-up grants, including $106 million in 2022-23 and $107 million in 2023-24, as part of the Agreement.
- As part of the Agreement, providing funding for training and increased wages to attract and retain more RECEs, to help mitigate potential challenges in finding qualified staff.
However, uncertainties over some aspects of the $10-a-day child care program, such as the extent of ministry reimbursement of future cost increases to child care providers, could reduce incentives for child care providers to create spaces. Child care providers are likely to open and expand child care centres if their operations are expected to be financially viable. Conversely, child care providers are likely to disenroll or close if their operations generate a loss.
Impact of creating 71,000 net new licensed child care spaces
Overall, if the target of 71,000 net new licensed child care spaces is achieved, it would represent average annual growth of 4.3 per cent from 2021 to 2026. In comparison, between 2011 and 2019, the number of spaces for children under age six increased by 6.2 per cent annually.[18]
The FAO projects that the new licensed child care spaces would increase the number of licensed child care spaces as a share of the population of children under age six from 35.3 per cent in 2021 to 40.8 per cent in 2026. For context, the number of licensed child care spaces as a share of the population of children under age six was 20.4 per cent in 2011.
Figure 6 Actual and planned licensed child care spaces for children under age six relative to their population
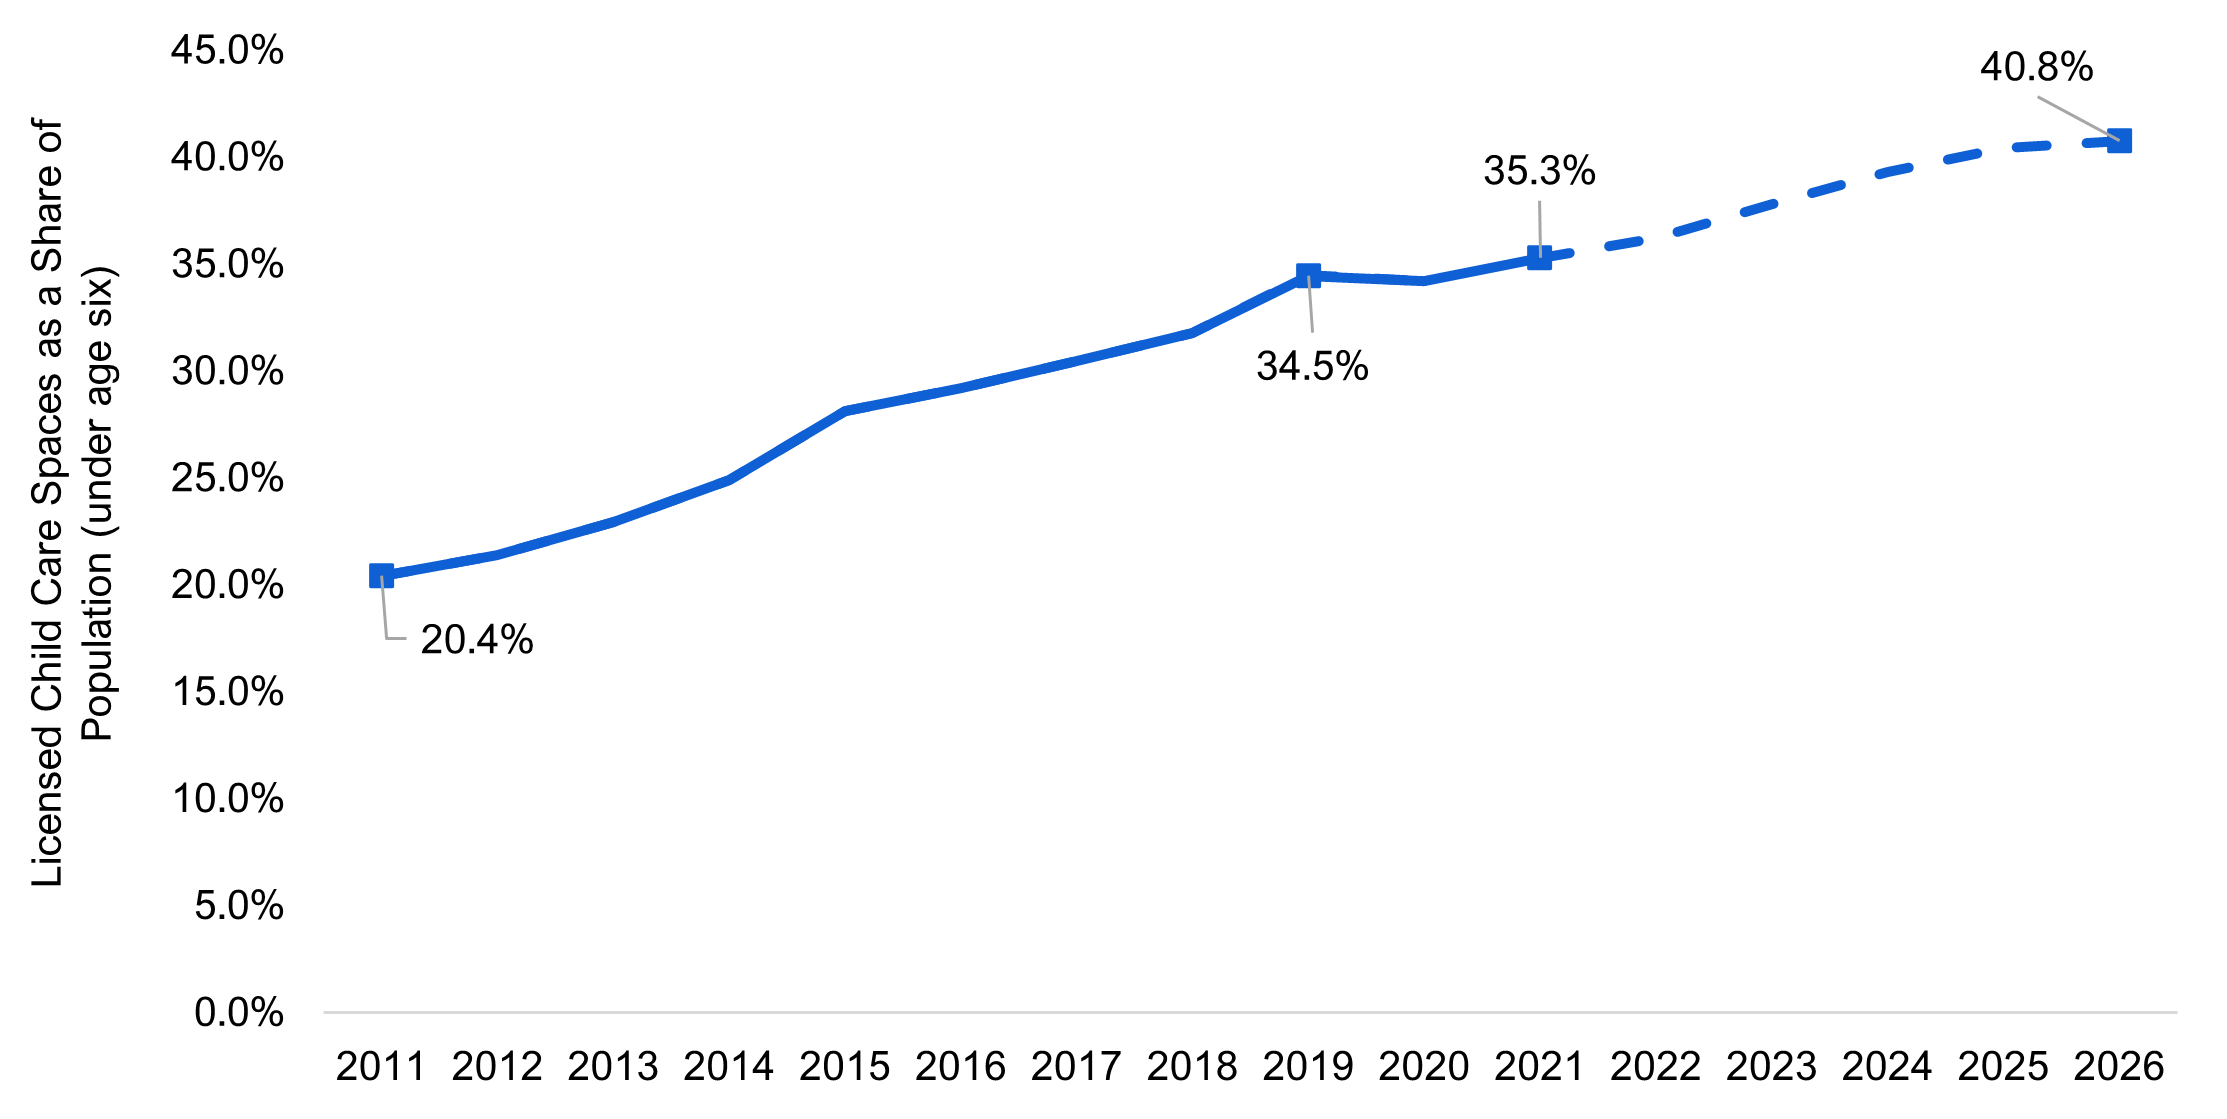
Source: FAO analysis of information provided by the Ministry of Education, Ontario Ministry of Finance, Population Projections Scenarios for Ontario by Age and Sex, 2021-2046 and Statistics Canada, Table 17-10-0005-01Population estimates on July 1st, by age and sex.
How many child care providers will enrol in the $10-a-day child care program?
Although the Agreement calls for the creation of 71,000 net new licensed child care spaces for children under age six, it does not specify a target for how many licensed child care providers (existing or new) will enrol in the program to provide $10-a-day child care. Therefore, it is not certain how many of the expected 375,111 licensed child care spaces for children under age six, as of the end of 2026, will be enrolled in the $10-a-day child care program.
Enrolment in the $10-a-day child care program is voluntary for licensed child care providers. Originally, the deadline for child care providers to enrol in the program was September 1, 2022. However, media reports have stated that many child care providers, particularly for-profit child care providers, had not opted into the program by the initial deadline of September 1, 2022.[19] In response, the ministry extended the deadline to apply to November 1, 2022 and clarified conditions relating to the right of child care providers to withdraw from the system and earn surpluses/profits.[20]
Child care providers who enrol in the program will provide discounted child care to parents in exchange for an equivalent amount in government subsidies. While the agreement offers a significant financial benefit for parents, child care providers will not receive any more revenue than they otherwise would have received for a given child. At the same time, enrolled child care providers will face new regulatory restrictions, including caps on future fee increases.
Despite the increase in regulatory burdens, child care providers may still have a strong incentive to enrol. Specifically, child care providers who do not enrol may face the risk of operating below licensed capacity as families may choose subsidized competitors.
Is there enough funding available to support $10-a-day child care for all who want it?
Based on the FAO’s preliminary analysis, the funding allocated to the $10-a-day child care program from 2022-23 to 2025-26 is likely sufficient to achieve the child care fee reduction targets for the planned 375,111 licensed child care spaces (assuming full take-up of the program by licensed child care providers). However, if more than the planned number of licensed child care spaces are created and enrolled, there is a risk that program funding could be exhausted.
Even if the Province is able to create and enrol 375,111 $10-a-day licensed child care spaces by 2026, the FAO estimates that there may still be significant excess demand for the $10-a-day program. By 2026, the FAO estimates that there will be 919,866 children under age six in Ontario, which would allow about 40.8 per cent of children to access $10-a-day subsidized child care spaces (assuming full child care provider enrolment). However, the FAO estimates that by 2026, Ontario families of approximately 602,257 children under age six will wish to have access to $10-a-day child care.[21] With only 375,111 $10-a-day licensed child care spaces planned, the families of 227,146 children under age six (25 per cent of the under age six population in 2026) would be left wanting but unable to access $10-a-day child care.
Figure 7 Planned supply and estimated demand for $10-a-day child care spaces in 2026
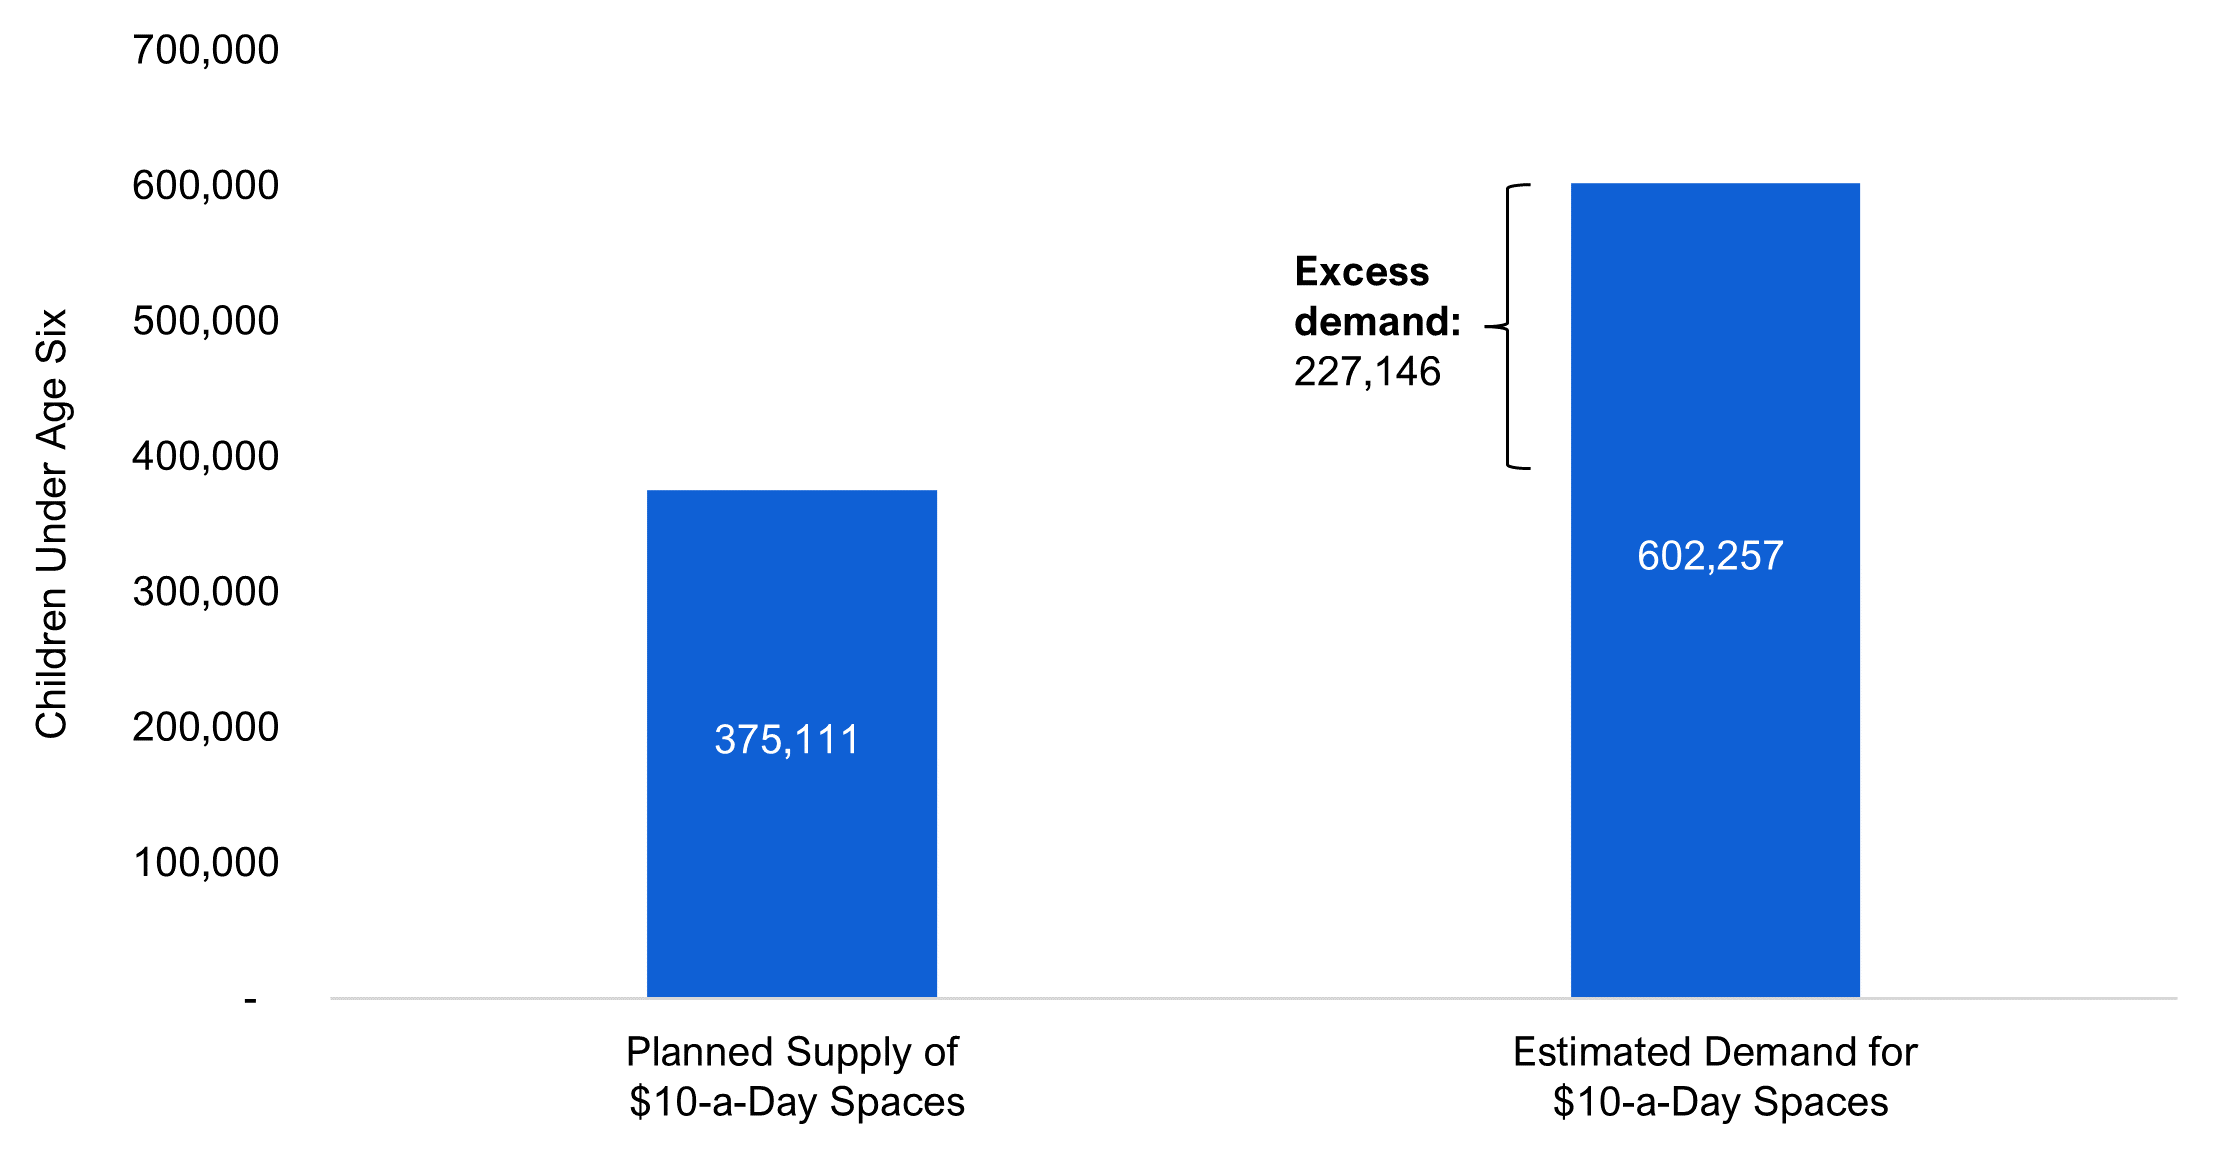
Source: FAO calculation from Statistics Canada Survey on Early Learning and Child Care Arrangements 2019 Public Use Microdata File and other sources.
Will the federal government continue to fully fund the program?
The Agreement signed by the Province and the federal government concludes in 2025-26. The federal government has signalled its intention to renew the Agreement[22] and has committed a minimum funding amount of $2.9 billion for 2026-27, while the Province has committed $128 million. Based on the FAO’s preliminary review of the $10-a-day child care program, the FAO estimates that the Province will need to spend $4.3 billion in both 2026-27 and 2027-28 to maintain the program. This means that there is a committed funding shortfall of $1.2 billion in 2026-27 (based on the minimum federal and provincial commitment) and $4.3 billion in 2027-28 (based on the absence of any federal or provincial commitment) pending a renewal/extension of the Agreement.
| 2026-27 | 2027-28 | ||
|---|---|---|---|
| Preliminary Federal Commitment | 2,926 | - | |
| Preliminary Provincial Commitment | 128 | - | |
| Total Preliminary Commitment | 3,054 | - | |
| Required Funding (FAO Preliminary Estimate) | 4,280 | 4,334 | |
| Estimated Funding Shortfall | -1,226 | -4,334 | |
In addition to the risk of program underfunding, there is a risk that the federal government could choose not to continue the program after the Agreement expires in 2025-26. For example, in 2006, the federal government cancelled its 2005 Early Learning and Child Care Agreement with Ontario and did not provide any further funding beyond 2006-07 towards its commitments under that agreement.
Ontario Teachers’ Pension Plan
The Province and the Ontario Teachers’ Federation (OTF) are joint sponsors of the Ontario Teachers’ Pension Plan (OTPP). OTPP spending represents the projected change in the provincial share of the OTPP liability for the year, net of returns on the plan’s assets. The FAO projects OTPP spending will grow at an average annual rate of 2.3 per cent, based on historical trends and other information.
In line with accounting treatment changes introduced by the Auditor General of Ontario in 2015-16, the Province has recorded an OTPP valuation allowance of $22.2 billion as of March 31, 2022. The valuation allowance reduces the value of the OTPP’s net pension asset because the Province does not have a unilateral right, or an agreement with the OTF, to access its share of the net pension asset. Changes to either the accounting treatment of the OTPP valuation allowance, or the methodology and assumptions underlying the valuations of the OTPP’s assets and liabilities, would have a material impact on the Province’s budget balance and net debt.[23]
Ministry Operations
Ministry operations includes spending to support the administration of the ministry, including financial and administrative services, human resources, and communications and legal services. This includes spending on salaries, wages and benefits for ministry staff, services to develop and provide operational support for education and child programs, and information technology services. The FAO projects ministry operations spending will increase at an average annual rate of 2.4 per cent. This is in line with the FAO’s wage growth and inflation projections.
Other Education Programs
Other education programs includes spending on non-school board education agencies and other parties including TVOntario (TVO), Télévision française de l’Ontario (TFO), the Education Quality and Accountability Office (EQAO) and any direct payments to parents. It also includes negative adjustments for education spending connected to colleges and hospitals. Corresponding positive adjustments are included with the Ministry of Colleges and Universities and the Ministry of Health. The FAO projects other education programs spending will increase at an average annual rate of 1.1 per cent, reflecting historical trends.
5. 2022-23 Expenditure Estimates Review
This chapter reviews 2022-23 requested and projected spending for the Ministry of Education, as outlined in the 2022-23 Expenditure Estimates, by program vote (Supply Bill spending), standalone legislation (statutory) spending, and other spending (consolidation and other adjustments).
Vote 1001 Ministry Administration Program
The Ministry Administration Program provides overall direction and administrative support. The total spending request for Vote 1001 is down $3 million (14.9 per cent) versus 2021-22 spending. The decrease this year is mostly attributed to lower planned services spending.[24]
| Item | Ministry Administration Program (Vote 1001) |
2021-22 Spending ($ millions) |
2022-23 Estimates ($ millions) |
1 Year Change ($ millions) |
1 Year Growth (%) |
|
|---|---|---|---|---|---|---|
| 1 | Ministry Administration | |||||
| Salaries, Wages and Employee Benefits | 14 | 15 | 1 | 7.3% | ||
| Services | 9 | 5 | -4 | -47.4% | ||
| Other Spending | -3 | -3 | <1 | -6.2% | ||
| Total Supply Vote | 20 | 17 | -3 | -14.9% | ||
Vote 1002 Elementary and Secondary Education Program
The Elementary and Secondary Education Program provides financial support to school boards, schools and agencies in Ontario. At $29.2 billion, Vote 1002 accounts for 84.3 per cent of planned EDU spending in 2022-23. The overall spending request for Vote 1002 is up by $897 million (3.2 per cent) compared to 2021-22 spending. There are three main sub-programs (items) in Vote 1002:
- Policy and Program Delivery ($26.9 billion), which funds school boards, mainly through the School Board Operating Grants and the Education Property Tax Non-Cash Expense (combined, known as Grants for Student Needs), as well as third-party organizations.
- Educational Operations ($0.1 billion), which primarily provides transfer payments to agencies, including Office des télécommunications éducatives de langue française de l’Ontario (TFO) ($25 million) and the Ontario Educational Communications Authority (TVO) ($43 million).
- Support for Elementary and Secondary Education ($2.2 billion), which provides funding for school board capital projects including rehabilitation, repairs, new buildings and child care spaces.
Significant changes in the 2022-23 spending plan under Vote 1002 include the following items:
- A combined $1.0 billion increase in planned spending for School Board Operating Grants and Education Property Tax Non-Cash Expense, which together fund the Grants for Students Needs (GSN). This represents a 3.8 per cent increase from last year’s spending, which reflects an increase in enrolment, a funding provision for salaries pending the outcome of collective bargaining negotiations, and the transfer of some COVID-19-related spending from the Priorities and Partnership Fund (PPF) to the GSN, including through the creation of the COVID-19 Learning Recovery Fund within the GSN.
- A $395 million decrease in planned funding for school boards under the Priorities and Partnership Fund (PPF) due to a decline in COVID-19 related-spending. A portion of the COVID-19 related spending previously delivered through the PPF in the 2021-22 school year will be delivered through the GSN in the 2022-23 school year.
- A $340 million net increase in planned spending on school board infrastructure through the Support for Elementary and Secondary Education sub-program including:
- $541 million (43.3 per cent) increase in the School Board Capital Grants transfer payment.
- $249 million (56.0 per cent) decline in funding for the Investing in Canada Infrastructure Program (ICIP). This is a temporary joint federal-provincial program intended to fund ventilation projects that improve air quality in classrooms, water bottle refilling stations to improve access to safe drinking water, broadband infrastructure to facilitate remote learning, and space reconfigurations to increase physical distancing.[25]
Also of note is that requested spending for Vote 1002 does not include funding for the Catch Up Payments program, which is expected to cost $365 million.[26] Funding for this program will need to be transferred from the Contingency Fund.
| Item | Elementary and Secondary Education Program Vote 1002 |
2021-22 Spending ($ millions) |
2022-23 Estimates ($ millions) |
1 Year Change ($ millions) |
1 Year Growth (%) |
|
|---|---|---|---|---|---|---|
| 1 | Policy and Program Delivery | |||||
| Priorities and Partnerships Funding - School Boards | 750 | 355 | -395 | -52.7% | ||
| Priorities and Partnerships Funding - Third Parties | 147 | 171 | 24 | 16.3% | ||
| School Board Operating Grants | 18,190 | 19,273 | 1,083 | 6.0% | ||
| Education Property Tax Non-Cash Expense | 7,076 | 6,947 | -129 | -1.8% | ||
| Provincial Benefits Trusts | 0 | <1 | <1 | |||
| Official Languages Projects | 42 | 39 | -3 | -6.5% | ||
| Education Quality and Accountability Office | 20 | 28 | 8 | 38.8% | ||
| Partner Sustainability Grants | 2 | 3 | 1 | 56.5% | ||
| Salaries, Wages and Employee Benefits | 75 | 84 | 9 | 12.7% | ||
| Services | 44 | 24 | -20 | -44.6% | ||
| Other Spending | 52 | 18 | -34 | -65.2% | ||
| Total Item | 26,398 | 26,943 | 545 | 2.1% | ||
| 2 | Educational Operations | |||||
| Payments in lieu of municipal taxation | <1 | <1 | <1 | 36.1% | ||
| Provincial Schools Student Enhancement Program | <1 | <1 | <1 | 158.9% | ||
| Office des télécommunications éducatives de langue française de l'Ontario (TFO) | 25 | 25 | 0 | 0.0% | ||
| Ontario Educational Communications Authority (TVO) | 43 | 43 | 0 | 0.0% | ||
| Salaries, Wages and Employee Benefits | 44 | 52 | 8 | 17.9% | ||
| Services | 13 | 15 | 3 | 20.1% | ||
| Other Spending | 3 | 5 | 1 | 44.4% | ||
| Total Item | 128 | 140 | 12 | 9.4% | ||
| 3 | Support for Elementary and Secondary Education | |||||
| Climate Action Incentive Fund (CAIF) | 14 | 0 | -14 | -100.0% | ||
| Investing in Canada Infrastructure Program (ICIP) | 445 | 196 | -249 | -56.0% | ||
| Priorities and Partnerships Funding – School Boards | 20 | 20 | 0 | 0.0% | ||
| School Board Capital Grants | 1,251 | 1,792 | 541 | 43.3% | ||
| Early Learning Program | 12 | 41 | 28 | 229.0% | ||
| School Board – Capital Funding for Child Care | 65 | 94 | 29 | 43.6% | ||
| Office des télécommunications éducatives de langue française de l'Ontario (TFO) | 1 | 1 | 0 | 0.0% | ||
| Ontario Educational Communications Authority (TVO) | 2 | 2 | 0 | 0.0% | ||
| Other Spending | 3 | 9 | 5 | 170.7% | ||
| Total Item | 1,814 | 2,154 | 340 | 18.7% | ||
| Total Supply Vote | 28,340 | 29,237 | 897 | 3.2% | ||
Vote 1003 Community Services Information and Information Technology Cluster
The Community Services Information and Information Technology Cluster supports digital asset management and services for the Ministry of Education and three other ministries.[27] Overall, the $53 million spending request for Vote 1003 is up $7 million (16.1 per cent) versus last year’s spending. The $11 million (25.7 per cent) increase in planned services spending is offset by increased recoveries from other ministries through ‘other spending’.[28] Planned salaries, wages and employee benefits spending is up $4 million or 13.2 per cent.
| Item | Community Services Information and Information Technology Cluster (Vote 1003) |
2021-22 Spending ($ millions) |
2022-23 Estimates ($ millions) |
1 Year Change ($ millions) |
1 Year Growth (%) |
|
|---|---|---|---|---|---|---|
| 1 | Community Services Information and Information Technology Cluster | |||||
| Salaries, Wages and Employee Benefits | 34 | 38 | 4 | 13.2% | ||
| Services | 42 | 53 | 11 | 25.7% | ||
| Other Spending | -31 | -39 | -8 | 26.0% | ||
| Total Supply Vote | 46 | 53 | 7 | 16.1% | ||
Vote 1004 Child Care and Early Years Programs
Child Care and Early Years Programs provide funding for child care programs and services, including the commitment to provide $10-a-day child care by 2025 and the Childcare Access and Relief from Expenses (CARE) tax credit.[29] At $3.8 billion, Vote 1004 accounts for 11.0 per cent of total Ministry of Education planned spending in 2022-23. There are two main sub-programs (items) in Vote 1004:
- Policy Development and Program Delivery ($3.8 billion); and
- Child Care Capital ($10 million).
Compared to 2021-22 spending, the overall spending request for Vote 1004 is up by $1.6 billion (71.4 per cent). Significant changes in the 2022-23 spending plan under Vote 1004 include:
- A $1.4 billion (70.7 per cent) increase in the Child Care and Early Years transfer payment. The increase is mostly due to the phasing in of the $10-a-day child care program.
- A $158 million (77.9 per cent) increase for the CARE tax credit (referred to in the Expenditure Estimates as the Ontario Child Care Tax Credit), which the Province expects will cost $360 million in 2022-23. The expected year-over-year increase is the result of lower spending in 2021-22 from a decline in child care utilization during the COVID-19 pandemic.
| Item | Child Care and Early Years Programs (Vote 1004) |
2021-22 Spending ($ millions) |
2022-23 Estimates ($ millions) |
1 Year Change ($ millions) |
1 Year Growth (%) |
|
|---|---|---|---|---|---|---|
| 1 | Policy Development and Program Delivery | |||||
| Ontario Child Care Tax Credit | 202 | 360 | 158 | 77.9% | ||
| Child Care and Early Years | 1,997 | 3,410 | 1,413 | 70.7% | ||
| Salaries, Wages and Employee Benefits | 17 | 19 | 2 | 10.8% | ||
| Services | 3 | 8 | 6 | 216.1% | ||
| Other Spending | <1 | <1 | >-1 | -53.4% | ||
| Total Item | 2,219 | 3,797 | 1,578 | 71.1% | ||
| 2 | Child Care Capital | |||||
| Child Care and Early Years Capital | 2 | 10 | 8 | 493.6% | ||
| Total Item | 2 | 10 | 8 | 493.7% | ||
| Total Supply Vote | 2,221 | 3,807 | 1,586 | 71.4% | ||
Standalone Legislation (Statutory) Spending
Standalone legislation (i.e., spending authorized by legislation other than the Supply Bill) primarily consists of $1.6 billion in planned spending for the Ontario Teachers’ Pension Plan (OTPP), which is $20 million (1.2 per cent) higher than 2021-22 spending. A small portion of statutory spending is for capital expenses, such as the amortization of EDU’s non-school board capital assets.
| Statutory Spending | 2021-22 Spending ($ millions) |
2022-23 Estimates ($ millions) |
1 Year Change ($ millions) |
1 Year Growth (%) |
|
|---|---|---|---|---|---|
| Ontario Teachers’ Pension Plan | 1,610 | 1,630 | 20 | 1.2% | |
| Amortization | 3 | 4 | 1 | 43.5% | |
| Bad Debt Expense | 0 | <1 | <1 | ||
| Salaries | <1 | <1 | >-1 | -3.0% | |
| Total Statutory Spending | 1,613 | 1,634 | 21 | 1.3% | |
Other Spending
The financial results of government organizations controlled by the Province, including school boards and certain provincial agencies, are consolidated into the financial results of the Province. Adjustments are made through ‘other spending’ to account for spending by school boards from sources other than transfer payments from the Province. Net capital adjustments are also made to reflect amortization expenses, mainly for school board infrastructure. Total ‘other spending’ is projected to increase by $650 million compared to 2021-22.
Other spending (operating), at $0.3 billion, is up $0.8 billion compared to 2021-22. The large year-over-year change is due to the Schools adjustment, which reflects spending by school boards. The $0.8 billion increase in the school boards spending adjustment largely reflects:
- School board spending of own-source revenues is expected to increase by $512 million in 2022-23, as revenues are forecasted to recover to near-pre-pandemic levels.
- A lower expected surplus for school boards in 2022-23 as boards return to pre-pandemic spending levels.
Other spending (capital) is projected to decrease by $0.2 billion compared to 2021-22. This mainly reflects higher planned spending on school board infrastructure in 2022-23. Spending on school board infrastructure is expensed (amortized) over the life of the asset. These adjustments ensure that the financial statements of the Province reflect the annual amortization expense of school boards’ infrastructure assets.
| Other Spending | 2021-22 Spending ($ millions) |
2022-23 Estimates ($ millions) |
1 Year Change ($ millions) |
1 Year Growth (%) |
|
|---|---|---|---|---|---|
| Operating | |||||
| Office des télécommunications éducatives de langue française de l'Ontario (TFO) | 16 | 5 | -12 | -71.6% | |
| Education Quality and Accountability Office | >-1 | -1 | -1 | 274.6% | |
| Ontario Educational Communications Authority (TVO) | 17 | 14 | -3 | -16.0% | |
| School Board Trust Debt Repayment Reclassification | -66 | -66 | <1 | -0.2% | |
| Schools | -417 | 423 | 840 | -201.4% | |
| Colleges | -22 | -22 | <1 | 0.0% | |
| Hospitals | -10 | -7 | 3 | -30.5% | |
| General Real Estate Portfolio | -1 | -4 | -3 | 321.7% | |
| Other | -4 | 0 | 4 | -100.0% | |
| Total Operating | -487 | 342 | 830 | -170.2% | |
| Capital | |||||
| Office des télécommunications éducatives de langue française de l'Ontario (TFO) | 1 | 1 | <1 | 18.6% | |
| Ontario Educational Communications Authority (TVO) | 2 | 2 | >-1 | -7.3% | |
| Education Quality and Accountability Office | <1 | <1 | <1 | 75.4% | |
| Schools | 123 | -263 | -386 | -314.7% | |
| Federal - Flowthrough Expense Reversal | -367 | -156 | 211 | -57.5% | |
| General Real Estate Portfolio | -3 | -9 | -5 | 158.7% | |
| Total Capital | -244 | -424 | -180 | 73.6% | |
| Total Other Spending | -732 | -82 | 650 | -88.8% | |
Graphical Descriptions
| 2021-22 | 2022-23 | 2023-24 | 2024-25 | 2025-26 | 2026-27 | 2027-28 | ||
|---|---|---|---|---|---|---|---|---|
| 2022 Ontario Budget | 31.5 | 34.7 | 35.9 | 36.8 | 37.5 | 38.2 | 38.9 | |
| FAO Projection | 31.5 | 35.1 | 36.1 | 37.2 | 38.6 | 40.0 | 40.9 | |
| School Year | Enrolment | |
|---|---|---|
| Historical | 2015-16 | 1,957,871 |
| 2016-17 | 1,970,722 | |
| 2017-18 | 1,981,099 | |
| 2018-19 | 2,003,421 | |
| 2019-20 | 2,020,765 | |
| 2020-21 | 1,990,938 | |
| 2021-22 | 1,999,826 | |
| Projection | 2022-23 | 2,000,321 |
| 2023-24 | 2,028,861 | |
| 2024-25 | 2,039,726 | |
| 2025-26 | 2,050,425 | |
| 2026-27 | 2,063,302 | |
| 2027-28 | 2,078,027 |
| 2021-22 | 2022-23 | 2023-24 | 2024-25 | 2025-26 | 2026-27 | 2027-28 | ||
|---|---|---|---|---|---|---|---|---|
| FAO Base Case | 19,067 | 18,809 | 19,094 | 19,393 | 19,904 | 20,463 | 21,047 | |
| Bill 124 Challenge Scenario | 0 | 1,458 | 554 | 563 | 578 | 594 | 611 | |
| Nominal | Real ($2021) | ||
|---|---|---|---|
| 2012-13 to 2021-22 Actual Spending | 2022-23 to 2031-32 Spending Plan | 2012-13 to 2021-22 Actual Spending | 2022-23 to 2031-32 Spending Plan |
| 19,663 | 21,198 | 21,370 | 18,323 |
| 2022 | 2023 | 2024 | 2025 | 2026 | ||||||||||||||
|---|---|---|---|---|---|---|---|---|---|---|---|---|---|---|---|---|---|---|
| Q1 | Q2 | Q3 | Q4 | Q1 | Q2 | Q3 | Q4 | Q1 | Q2 | Q3 | Q4 | Q1 | Q2 | Q3 | Q4 | Q1 | ||
| Infant | $73 | $55 | $55 | $55 | $37 | $37 | $37 | $37 | $37 | $37 | $23 | $23 | $23 | $23 | $10 | $10 | $10 | |
| Toddler | $61 | $46 | $46 | $46 | $30 | $30 | $30 | $30 | $30 | $30 | $20 | $20 | $20 | $20 | $10 | $10 | $10 | |
| Preschool | $53 | $40 | $40 | $40 | $27 | $27 | $27 | $27 | $27 | $27 | $18 | $18 | $18 | $18 | $10 | $10 | $10 | |
| Kindergarten | $48 | $36 | $36 | $36 | $24 | $24 | $24 | $24 | $24 | $24 | $17 | $17 | $17 | $17 | $10 | $10 | $10 | |
| Kindergarten before and after school | $26 | $19 | $19 | $19 | $13 | $13 | $13 | $13 | $13 | $13 | $11 | $11 | $11 | $11 | $10 | $10 | $10 | |
| Average | $46 | $35 | $35 | $35 | $23 | $23 | $23 | $23 | $23 | $23 | $17 | $17 | $17 | $17 | $10 | $10 | $10 | |
| Year | Licensed Spaces as a Share of Population (Under age 6) |
|---|---|
| 2011 | 20.4% |
| 2012 | 21.4% |
| 2013 | 23.0% |
| 2014 | 24.9% |
| 2015 | 28.2% |
| 2016 | 29.2% |
| 2017 | 30.5% |
| 2018 | 31.8% |
| 2019 | 34.5% |
| 2020 | 34.2% |
| 2021 | 35.3% |
| 2022 | 36.2% |
| 2023 | 37.8% |
| 2024 | 39.3% |
| 2025 | 40.5% |
| 2026 | 40.8% |
| Children Under Age Six | |
|---|---|
| Planned Supply of $10-a-Day Spaces | 375,111 |
| Estimated Demand for $10-a-Day Spaces | 602,257 |
| Excess Demand | 227,146 |
Footnotes
[1] Spending also includes transfers to 10 school authorities that oversee schools in hospitals, treatment centres and remote regions of the province.
[2] Although the Ontario legislature passed the Keeping Students in Class Act, 2022, which imposed a collective agreement on approximately 55,000 education workers who are members of the Canadian Union of Public Employees (CUPE), the Province has announced that it intends to introduce legislation that, if passed, would repeal the Keeping Students in Class Act, 2022.
[3] The FAO projects inflation will average 4.5 per cent per year between 2021-22 and 2023-24, followed by a return to a historical average of 2.0 per cent per year.
[4] Government of Ontario, “$13.2 Billion Child Care Deal will Lower Fees for Families,” March 28, 2022.
[5] Canada – Ontario Canada-wide Early Learning and Child Care Agreement.
[6] These targets are sometimes expressed relative to the start of 2019 instead of relative to the end of 2021. Measured relative to the start of 2019, the targets are a 42,000 increase in spaces by the end of 2023 and an 86,000 increase in spaces by the end of 2026.
[7] Government of Ontario, “Ontario Releases 2021-2022 Public Accounts,” September 2022 and https://www.ontario.ca/page/catch-up-payments.
[8] Spending also includes transfers to 10 school authorities that oversee schools in hospitals, treatment centres and remote regions of the province.
[9] Excluding time-limited COVID-19-related spending in 2022-23, the FAO projects compensation spending will grow at an average annual rate of 2.8 per cent from 2022-23 to 2027-28.
[10] The Protecting a Sustainable Public Sector for Future Generations Act, 2019.
[11] The FAO projects inflation will average 4.5 per cent per year between 2021-22 and 2023-24, followed by a return to a historical average of 2.0 per cent per year.
[12] The FAO’s projection for non-compensation spending reflects the FAO’s inflation forecast for education sector-specific spending, which includes a select basket of goods and services from the Consumer Price Index. Education sector spending includes spending on computer equipment, school textbooks and supplies, transportation, and consulting services.
[13] Government of Ontario, “$13.2 Billion Child Care Deal will Lower Fees for Families,” March 28, 2022.
[14] Canada – Ontario Canada-wide Early Learning and Child Care Agreement.
[15] The Agreement sets a deadline to reach an average of $10-a-day child care by “the end of fiscal year 2025 to 2026” but the ministry has committed to meeting the target by September 2025. Government of Ontario Backgrounder, “Ontario’s Child Care Action Plan Puts Families First,” March 28, 2022.
[16] The initial fee reduction targets under the Agreement are relative to 2020 average child care fees; however, the FAO has used January 2022 child care fees as a baseline as child care fees were largely unchanged from 2020 to 2022.
[17] These targets are sometimes expressed relative to the start of 2019 instead of relative to the end of 2021. Measured relative to the start of 2019, the targets are a 42,000 increase in spaces by the end of 2023 and an 86,000 increase in spaces by the end of 2026.
[18] Ninety per cent of the new licensed child care spaces for children under age six over this period were added in child care centres in publicly funded schools. From 2011 to 2019, the number of licensed child care spaces in publicly funded schools grew by 11.7 per cent annually, compared with an average annual growth rate of 1.4 per cent for licensed child care spaces in the community.
[19] CBC, Ontario extending $10/day child-care opt-in deadline in hopes of more operators, August 17, 2022.
[20] Ministry of Education, Update: Implementation of the Canada-Wide Early Learning and Child Care Plan between the Province of Ontario and the Government of Canada (August 17, 2022).
[21] The FAO’s estimate is based on Statistics Canada’s Survey on Early Learning and Child Care Arrangements using pre-pandemic data. The estimate is based on the number of children in Ontario who either already use child care, or did not use child care because it was too expensive for their family, there was a shortage of spaces, or they could not find licensed care. The share of children who would continue to use care by relatives and non-relatives in the home was estimated by analogy to Quebec.
[22] Under the Agreement, a program review is planned for completion by June 2024 and discussion on renewal is planned for fiscal year 2024-25.
[23] For a longer discussion and additional analysis, see FAO, “Expenditure Estimates 2019-20: Ministry of Education,” 2019.
[24] ‘Services’ include advertising, communications, machine repairs and other items.
[25] Government of Ontario, “Canada and Ontario Invest in School Infrastructure to Respond to the Impacts of COVID-19,” April 14, 2021.
[26] Government of Ontario, “Province Takes Action to Ensure Students Catch Up,” October 20, 2022.
[27] The Ministries of Colleges and Universities; Municipal Affairs and Housing; and Heritage, Sport, Tourism and Culture Industries.
[28] The cost of services provided to other ministries is recorded as a ‘recovery’ by the Ministry of Education and as spending by the other ministries. The net impact is to decrease Ministry of Education spending and increase spending in the other ministries.
[29] Listed in the Expenditure Estimates as the Ontario Child Care Tax Credit.