


Click here for all Ontario Service Fees reports.
The Province levies over 400 service, licence and permit fees[1] (hereafter all referred to as service fees), which it forecasts will generate revenue of $2.74 billion in 2016-17, accounting for 2.1% of total revenue.[2] Since 2011-12, the share of total revenue raised from service fees has increased from 1.8% to 2.1%.[3]
The annual Ontario budget includes a forecast for service fee revenue for the upcoming fiscal year but does not provide a comprehensive list of service fee rate changes planned for the upcoming fiscal year. Further, the budget provides no explanation for how the service fee revenue forecast is impacted by:
- changes to existing service fee rates;
- the introduction of new service fees; and
- changes in the demand for services.
This backgrounder provides a partial list of changes to Provincial service fee rates planned for 2016-17. It also includes a discussion of the growth rate of service fee revenue and questions legislators may wish to ask the government.
Service Fee Rate Changes in 2016-17
Table 1 lists planned changes to service fee rates for 2016-17. The list below does not include Provincial agencies, because the Province does not centrally track changes to service fee rates charged by its agencies. As well, the list does not include ministry service fee rate changes approved by Cabinet but not yet publicly announced. The government has determined that such service fee changes are a Cabinet record and has chosen not to provide them to the Financial Accountability Officer (FAO). The expected revenue from these changes is included in the 2016 budget plan.
| Ministry / Fee | 2015-16 Rate (dollars) |
2016-17 Rate (dollars) |
Rate Change (%) |
|---|---|---|---|
| Children and Youth Services | |||
| Fee to Place Children for Adoption | $200 | $0 | fee eliminated |
| Inter-country Adoption Fee | $1,800 | $0 | fee eliminated |
| Community Safety and Correctional Services | |||
| Ontario Police College Senior/Specialized Course Fees (over 70 courses; fee per officer) | $45 to $6,260 | $45 to $7,200 | 0% to 15% |
| Education | |||
| Child Care Licensing Fees | $10 to $25 | $25 to $450 | 150% to 1,700% |
| Environment and Climate Change | |||
| Hazardous Waste Fees (per tonne) | $20 | $30 | 50% |
| Municipal Affairs and Housing | |||
| Building Code Materials Evaluation Commission Application Fee | $7,000 | $9,000 | 29% |
| Land Use Planning Fees | $720 to $8,100 | $800 to $10,100 | 11% to 25% |
| Transportation | |||
| Bus Validation Fees | $120 to $2,015 | $122.50 to $2,055.25 | 2% |
| Heavy Commercial Vehicle Validation Fees | $185 to $4,601 | $188.75 to $4,693 | 2% |
| Farm Vehicle Validation Fees | $140 to $1,110 | $142.75 to $1,132.25 | 2% |
| Commercial Vehicle Operator Registration Certificate Replacement Fee | $28 | $31 | 11% |
| Driver’s Licence Replacement Fee | $28 | $31 | 11% |
| Motor Vehicle Number Plate Fee | $20 | $25 | 25% |
| Validation Fees – Passenger Vehicles and Light Commercial Vehicles for Personal Use (Northern Ontario) | $54 | $60 | 11% |
| Validation Fees – Passenger Vehicles and Light Commercial Vehicles for Personal Use (Southern Ontario) | $108 | $120 | 11% |
| Validation Fees – Commercial Vehicles for Business Use | $108 | $120 | 11% |
| Permit Issue Fee (Original or Replacement) for Motor Vehicle and Trailer | $20 | $32 | 60% |
| Vehicle Permit, Number Plate and Validation Fee for a Trailer | $59 | $72 | 22% |
Growth in Service Fee Revenue
The Province is projecting $2.74 billion in revenue from service fees in 2016-17, a 38.7% increase from 2011-12 (average yearly increase of 6.8%) (see Chart 1).[4] By contrast, over the same period, total provincial taxation revenue is expected to increase by 21.5% (average yearly increase of 4.0%).[5]
Figure 1 Provincial Service Fee Revenue, 2011-12 to 2016-17
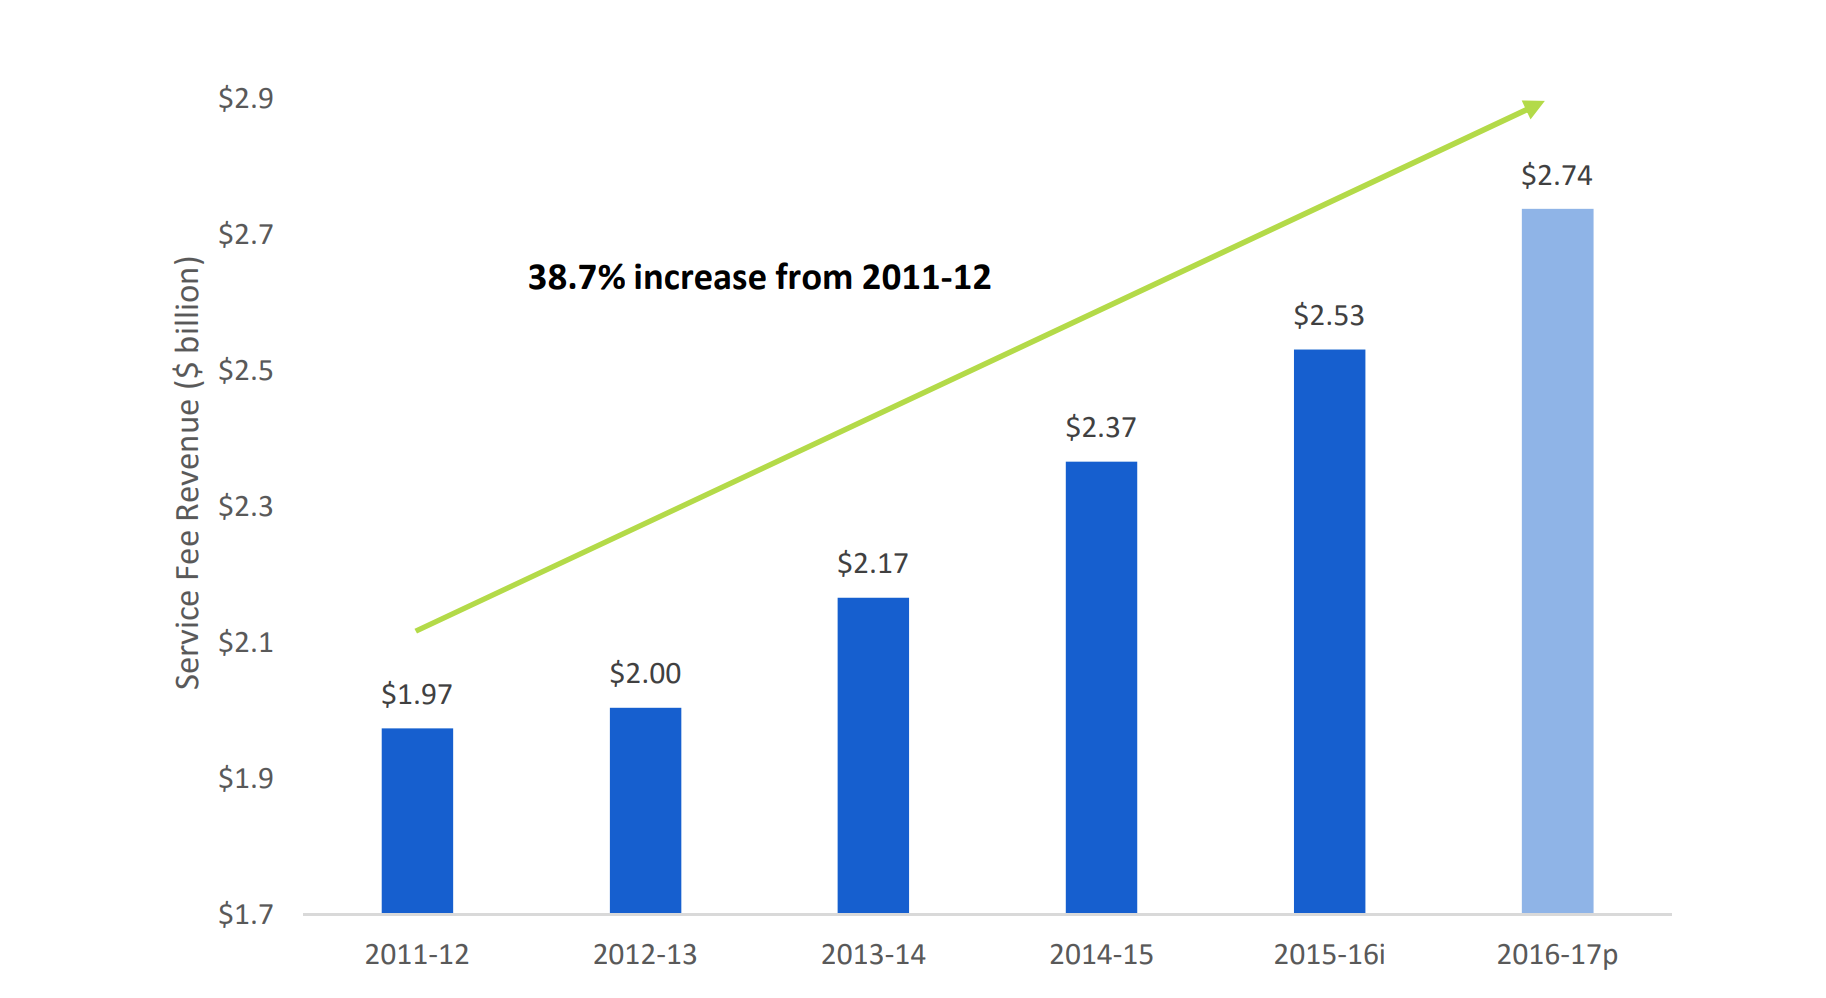
Source: FAO analysis of the Public Accounts of Ontario and 2016 Ontario Budget.
Note: “2015-16i” is the interim forecast and “2016-17p” is the plan forecast in the 2016 Ontario Budget.
Accessible version
This chart shows total provincial revenue from service fees from 2011-12 to 2016-17, as follows: 2011-12: $1.97 billion, 2012-13: $2.00 billion, 2013-14: $2.17 billion, and 2014-15: $2.37 billion. For 2015-16, the 2016 Ontario Budget interim forecast for provincial service fee revenue was $2.53 billion, and for 2016-17 the Province is projecting service fee revenue of $2.74 billion. This chart also shows an overall increase in provincial service fee revenue from 2011-12 to 2016-17 of 38.7%.
Why is Service Fee Revenue Growing so Much?
The key driver of increasing service fee revenue is vehicle and driver registration fees. These fees represent almost two-thirds of total projected service fee revenue in 2016-17. Since 2011-12, revenue from vehicle and driver registration fees has increased by 62.9%, an average annual growth rate of 10.3%, more than five times the growth rate of all other Provincial service fees.[6]
A significant change in revenue collected from vehicle and driver registration fees began in 2012 when the Province announced that it would implement on-going increases in vehicle and driver registration fees.[7] Following the announcement, the average annual growth rate of revenue from vehicle and driver registration fees increased from 1.1% (for the eight years to 2011-12) to 10.3% (for the five years to 2016-17).[8]
Excluding vehicle and driver registration fees, all other service fee revenue represents 36.0% of total projected service fee revenue in 2016-17. All other service fee revenue has increased by only 9.7% since 2011-12, an average annual growth rate of 1.9%.[9]
To further understand the growth rate of service fee revenue, the FAO requested from the Province information on how much of the increase in service fee revenue from 2011-12 to 2016-17 is the result of changes in service fee rates, the introduction of new service fees or changes in the demand for services. The Province informed the FAO that this information is not collected centrally and would require the FAO to work directly with each Provincial ministry and agency.[10]
Lastly, it is worth noting that increases to service fee rates are constrained by law. A service fee can be considered unlawful, and as a result repayable by the Province, if the amount charged is excessive and does not have a reasonable relationship to the cost of the service being provided.[11]
Looking Forward
The 2016 Ontario Budget made two additional announcements regarding service fees:[12]
- Starting in 2017-18, service fees will be adjusted annually to keep up with inflation (so far no specifics have been provided on how these adjustments would be calculated or implemented); and
- The Province is continuing to undertake a review of all service fees.
The 2016 budget did not include details on which service fees it would adjust for inflation, or how much new revenue the Province would generate starting in 2017-18.
The 2016 budget provided little detail on the objectives of the review of all service fees. The budget did note that the review would identify and eliminate fees “that do not align with government priorities.”[13] The budget also noted that the review would “identify additional opportunities to update fees to remove hidden subsidies while ensuring potential impacts on vulnerable Ontarians are considered.”[14]
Questions for MPPs
| Issue and Importance | Question |
|---|---|
| A complete list of 2016-17 changes to service fee rates charged by the Province is not available. | Which additional service fee rate changes are scheduled for 2016-17? |
The forecast for service fee revenue in the 2016 Ontario Budget does not include information on how the forecast is impacted by:
|
How much new revenue will result from changes to Provincial service fee rates in 2016-17? |
| Since 2012, the annual growth rate in revenue from vehicle and driver registration fees has averaged 10.3%. The 2016 Ontario Budget notes that the government will continue to “update” its licensing and vehicle validation fees. |
Are there final target rates for vehicle and driver registration fees? What is the timeframe for achieving the target rates? |
| The 2016 Ontario Budget announced that starting in 2017-18 service fees will be adjusted annually for inflation. |
How does the Province plan to adjust service fees for inflation starting in 2017-18? What services fees will be affected? How much revenue is expected to be generated? |
| The 2016 Ontario Budget noted that the Province is continuing its review of all service fees. |
What are the results of the Province’s review of service fees? Which service fees will be “updated”? Which service fees will be eliminated? Has the Province conducted a legal analysis (i.e. Eurig review) of all of its service fees? Are any service fees legally non-compliant? |
Footnotes
[1] “Government User Fees”, 2009 Annual Report of the Office of the Auditor General of Ontario, p. 143.
[2] 2016 Ontario Budget, p. 282. Total service fee revenue projected for 2016-17 is calculated by adding “Vehicle and Driver Registration Fees” and “Other Fees and Licences”.
[3] 2016 Ontario Budget and Public Accounts of Ontario.
[4] The FAO calculates all average rates in this backgrounder using the compound annual growth rate.
[5] Source: Public Accounts of Ontario and the 2016 Ontario Budget.
[6] Based on FAO analysis of the Public Accounts of Ontario and the 2016 Ontario Budget.
[7] Accessed on June 1, 2016 at https://news.ontario.ca/mto/en/2012/03/ontario-increasing-driver-and-vehicle-licence-fees-to-maintain-roads-and-bridges.html.
[8] Based on FAO analysis of the Public Accounts of Ontario and the 2016 Ontario Budget.
[9] ibid.
[10] Doing so is outside the scope of the current backgrounder, but represents an area for potential future work.
[11] “Government User Fees”, 2011 Annual Report of the Office of the Auditor General of Ontario, p. 341. The legal framework for service fees is based on the 1998 Supreme Court of Canada Eurig decision. The FAO did not request from the Province analysis conducted to support the legal validity of its service fees. Analysis on the legal compliance of the Province’s service fees was beyond the scope of this backgrounder.
[12] 2016 Ontario Budget, p. 191.
[13] ibid.
[14] ibid.