


Summary
- The Government of Ontario’s (the Province’s) debt is rated by four principal international credit rating agencies, based on their assessments of Ontario’s economic and financial outlook, and future risks. These credit ratings represent the credit rating agencies’ opinions on the Province’s ability to meet its debt-related financial obligations.
- Since the FAO’s last credit rating report, released in January 2023, all four credit rating agencies have reaffirmed their credit ratings for the Province in updated assessments. In general, the credit rating agencies continue to rate the Province as an extremely strong, investment-grade borrower.
- In addition to reaffirming the Province’s credit rating, three of the four credit rating agencies revised Ontario’s credit rating outlook from stable to positive. The positive outlook indicates that a credit rating upgrade for the Province within the next two years is likely, and reflects the credit rating agencies’ view that Ontario’s fiscal outlook has improved, with a quicker return to balanced budgets and a lower debt burden than previously forecasted.
- The credit rating agencies indicated that Ontario’s strong credit rating is based on its large and diversified economy, high liquidity and prudent debt management program. As well, Canada’s federal-provincial framework provides provinces with the flexibility to adjust both tax policy and program spending, in addition to predictable revenue from federal transfers. At the same time, the credit rating agencies identified challenges that negatively impact Ontario’s credit rating, including weakening domestic and global macroeconomic conditions, the Province’s elevated debt burden and spending pressures.
- Ontario’s average credit rating ranked sixth highest among the provinces, down from fifth highest since the FAO’s last credit rating report. The average credit ratings for British Columbia, Saskatchewan, Alberta, Quebec and Nova Scotia ranked higher than Ontario.
- While provinces with higher credit ratings generally have lower borrowing rates, Ontario’s borrowing costs are lower than all provinces other than Quebec and British Columbia, despite having the sixth highest credit rating.
Introduction
The Government of Ontario’s (the Province’s) debt is rated by four principal international credit rating agencies: Moody’s Investors Service (Moody’s), S&P Global Ratings (S&P), DBRS Morningstar (DBRS) and Fitch Ratings (Fitch). These credit ratings represent the credit rating agencies’ opinions on the Province’s ability to meet its debt-related financial obligations and are based on the credit rating agencies’ assessments of Ontario’s economic and financial outlook, and future risks. Credit rating agencies typically provide annual updates to their assessments of Ontario’s credit rating and outlook.
Investors use credit ratings to assess the risk that a particular borrower will not meet its debt-related financial obligations. This risk is reflected in the interest rate paid by the Province. Generally, higher credit ratings are associated with lower borrowing costs, while lower ratings are associated with higher borrowing costs.
The FAO’s credit rating report provides an update on Ontario’s current credit rating and outlook, and summarizes the common themes that the four credit rating agencies have highlighted: the credit rating agencies’ expectations regarding the Province’s economic and financial outlook; positive and negative factors that contribute to Ontario’s credit rating; and factors that could lead to a credit rating or outlook change. The report also assesses how Ontario’s credit rating and borrowing costs compare to other Canadian provinces.
Ontario’s credit rating reaffirmed, outlook revised to positive by three credit rating agencies
In March 2023, the Province released its 2023 Ontario Budget, which projected deficits of $2.2 billion in 2022-23, $1.3 billion in 2023-24, and a return to surpluses in 2024-25 and 2025-26. The projections were sizable improvements from those presented a year earlier in the 2022 budget.
Following the improved outlook, all four credit rating agencies released their updated assessments, each reaffirming Ontario’s credit rating. Based on a standardized scale,[1] Ontario’s debt continues to be rated AA- (extremely strong, investment-grade borrower – fourth highest rating) by three of the four credit rating agencies and A+ (very strong, investment-grade borrower – fifth highest rating) by S&P.
Figure 1 Ontario’s credit ratings reaffirmed by all credit rating agencies
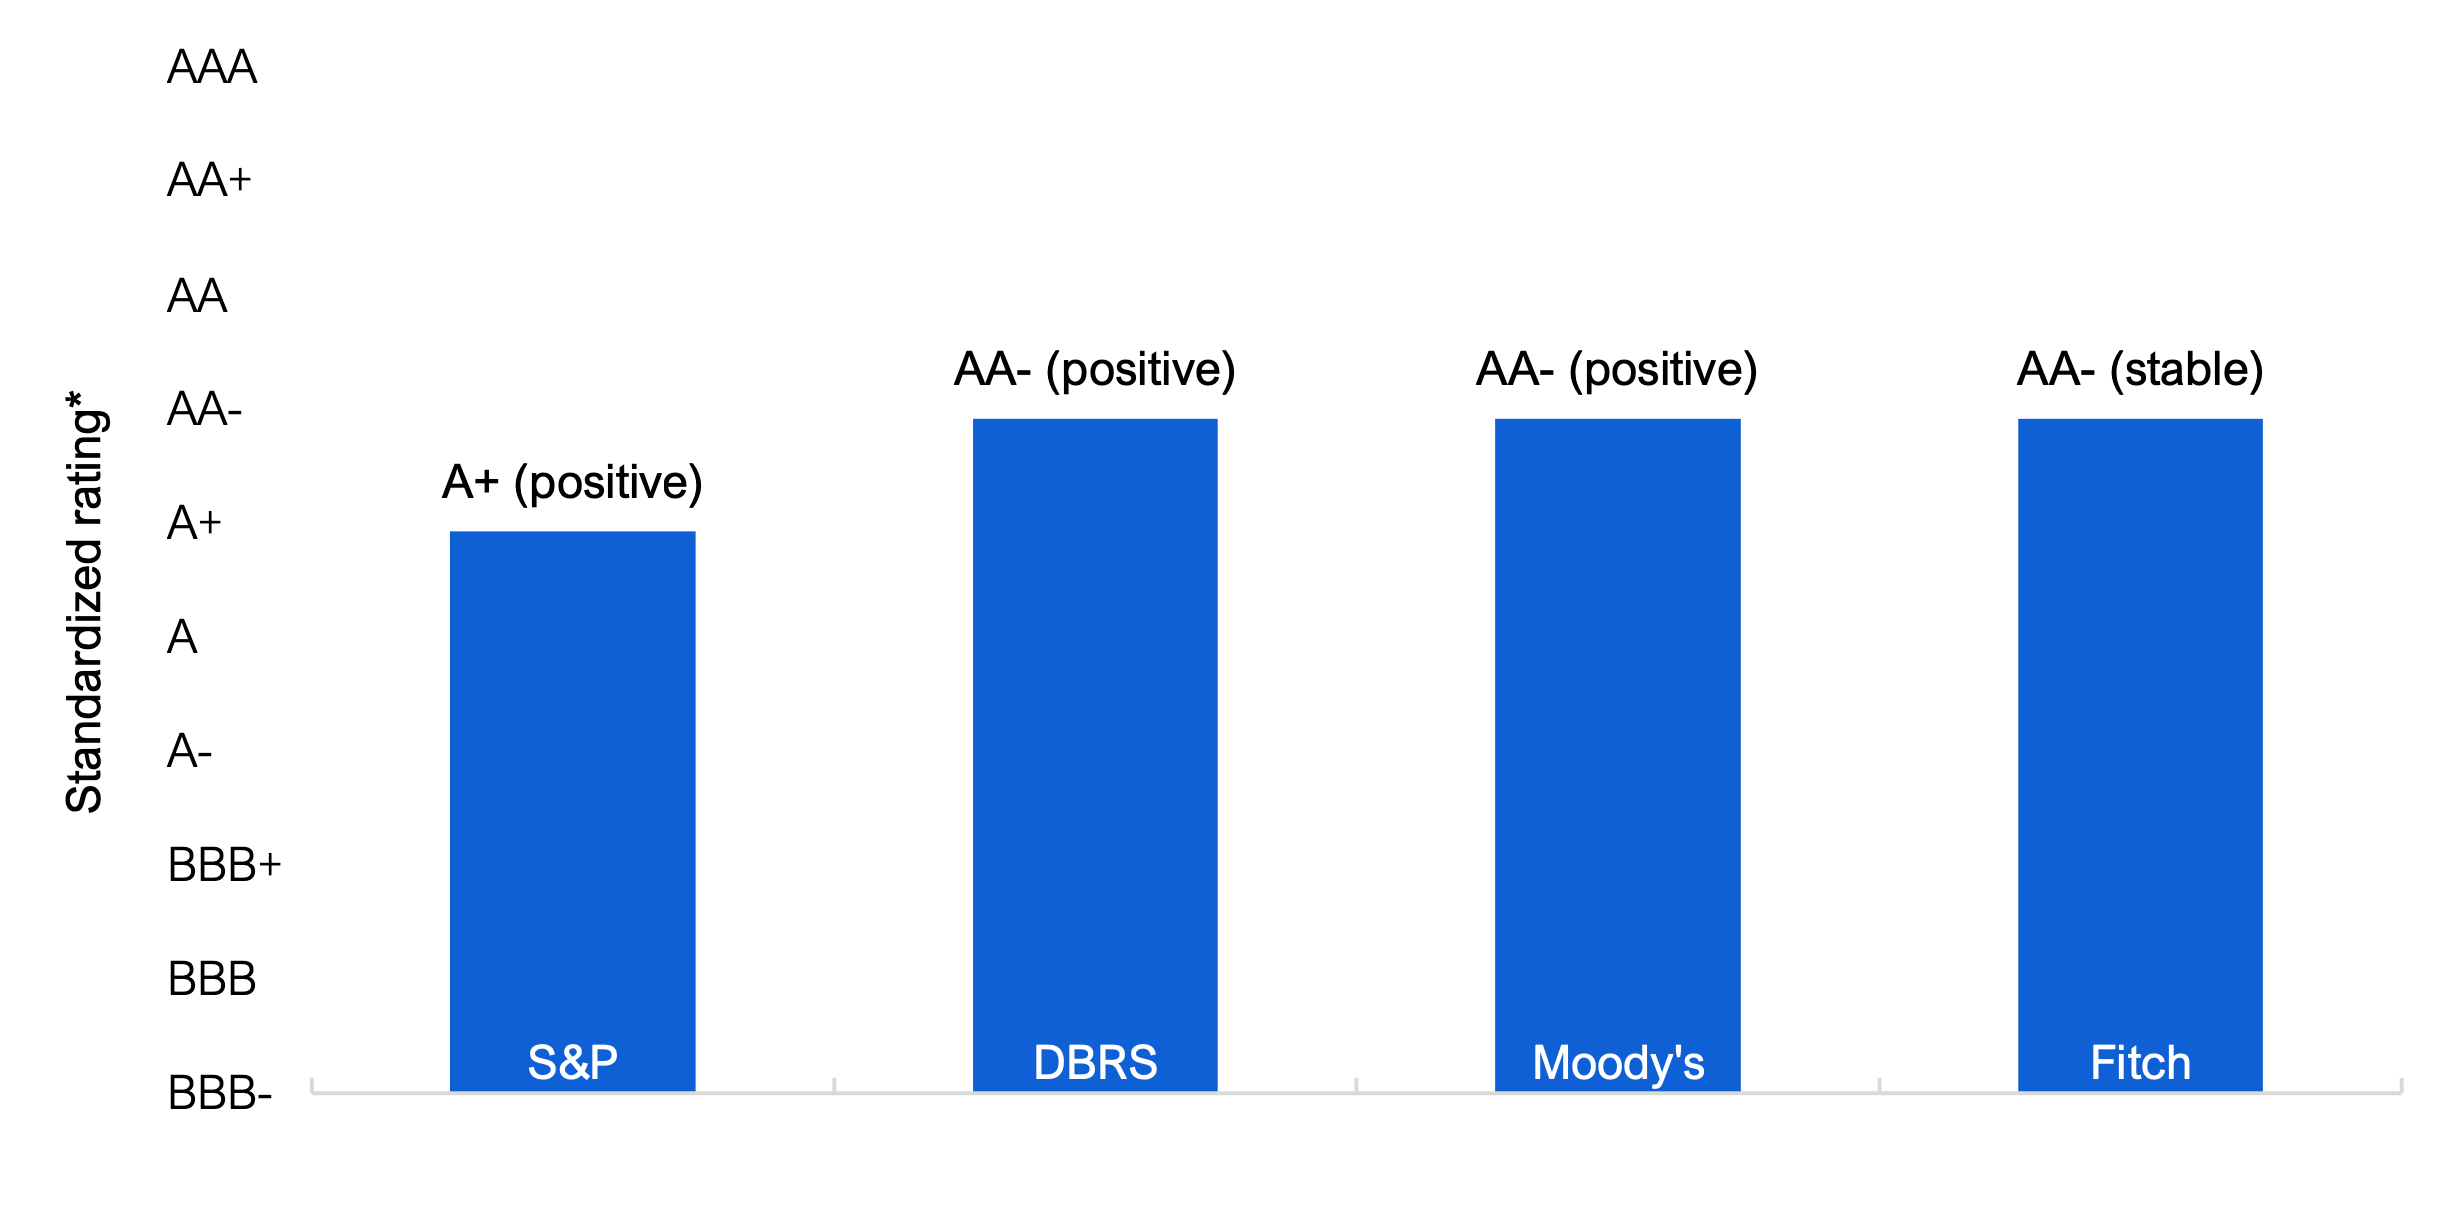
* See Table 2 for the FAO’s credit rating conversion table. The credit rating agencies’ outlook is shown in brackets.
Source: S&P, DBRS, Fitch, Moody’s and FAO
While the Province’s credit ratings remained unchanged, three of the four credit rating agencies (DBRS, Moody’s and S&P) revised Ontario’s credit outlook from stable to positive. A positive outlook generally indicates the potential for a credit rating upgrade.[2] The positive outlook reflects the credit rating agencies’ view that Ontario’s fiscal outlook has improved, with a quicker return to balanced budgets and a lower debt burden than previously forecasted.
Of the three credit rating agencies that changed the Province’s outlook to positive, each indicated that continued fiscal progress could lead to a rating upgrade. More specifically:
- DBRS is looking for the Province’s improved fiscal management to continue, noting that recent revenue increases were not offset by new permanent spending, resulting in stronger budget balances.
- Moody’s is looking for the Province to maintain close to balanced budgets and a continued decline in its debt burden; and
- S&P is looking for the Province to achieve improving after-capital deficits[3] and the stabilization of its debt burden.
However, the credit rating agencies also noted that a negative rating action, including an outlook revision back to stable, could occur if weaker than expected economic and fiscal performance leads to a rising debt burden.
Following the credit assessments, the Province released its 2022-23 Public Accounts in September, recording a $5.9 billion budget deficit for 2022-23, marking an unexpected $3.7 billion deterioration from the interim budget deficit projection in 2023 budget.[4] The results presented in the Public Accounts, as well as the fiscal and debt outlook presented in the 2023 Ontario Economic Outlook and Fiscal Review and 2024 Ontario Budget, will be incorporated into the credit rating agencies’ assessments when they update their credit ratings and outlooks for the Province.
Factors impacting Ontario’s credit rating
In the credit rating assessments, the credit rating agencies highlighted both positive and negative factors that contributed to Ontario’s credit rating.
Positive factors
Credit rating agencies indicated that Ontario’s strong credit rating is supported by its large and diversified economy, high liquidity and prudent debt management program. As well, Canada’s federal-provincial framework provides provinces with the flexibility to adjust both tax policy and program spending, in addition to continued and predictable revenue from federal transfers.
Economy
Ontario has a large and diversified economy, which includes both manufacturing and services sectors, as well as strong trade relationships throughout North America and globally. The provincial economy also benefits from its favourable demographics and wealth factors, including its high net international in-migration and its high GDP per capita. Moody’s and S&P also highlighted the Province’s transition towards a sustainable economy, including its efforts to position itself as a clean steel provider and its attraction of investments from global electric vehicle automakers and battery suppliers. These factors contribute to reliable and robust revenue generation for the Province.
Liquidity and debt management
The Province maintains large liquidity reserves to ensure it can meet its short-term obligations in periods of financial market stress. The Province also has strong access to both domestic and international borrowing markets, and a prudent debt management program, which aims to limit the impact of risks related to refinancing, changes in interest rates and exchange rate fluctuations on its debt.[5]
Federal-provincial framework
Under the federal-provincial framework, Ontario has considerable fiscal flexibility to adjust both tax policy and program spending, giving it the ability to raise revenues or decrease spending to meet fiscal challenges. The Province also receives continued and predictable federal transfers, which supplement own-source revenues (such as tax revenues, government business enterprises or other non-tax revenues). Additionally, the credit rating agencies regard the high likelihood of extraordinary support from the federal government in the event of a crisis as having a positive impact on the Province’s credit rating.
Negative factors
The credit rating agencies also identified challenges that negatively impact Ontario’s credit rating, including weakening macroeconomic conditions, the Province’s elevated debt burden and spending pressures.
Macroeconomic conditions
The Province continues to face challenges due to the deteriorating domestic and global macroeconomic outlook that could negatively impact its fiscal outcomes. While the Province projected an economic slowdown in 2023 followed by a modest recovery in 2024 in its recent budget, factors such as high inflation, elevated interest rates, slowing global trade and ongoing geopolitical instability are downward risks to its fiscal projections.
Debt burden
Ontario’s debt burden, which measures debt as a share of GDP or revenues, is high relative to other regional governments of comparable credit ratings. Credit rating agencies highlighted the Province's capital plan as a factor contributing to Ontario’s high debt burden, which is expected to remain elevated despite improvements in budgetary performance. The high debt burden means that if interest rates rise by more than expected or remain higher for a longer period of time, the Province may face greater budgetary pressure from increased interest expenses.
Spending pressures
The government faces spending pressures from public sector wage and salary demands caused by high inflation, health care sector staffing shortages and retroactive wage increases related to Bill 124.[6] These spending pressures could lead to worse budgetary outcomes than projected by the government. While S&P indicated the government has a good track record of meeting its fiscal targets, Moody’s[7] noted that the Province may underestimate the costs to address these spending pressures.
Ontario’s credit rating ranked sixth highest among the provinces
Since the FAO’s last credit rating report, both Alberta’s and Newfoundland and Labrador’s credit ratings were upgraded, while British Columbia received a downgrade. As a result of Alberta’s credit rating upgrade, Ontario’s average credit rating fell from fifth to sixth highest among the provinces.
Figure 2 Alberta, British Columbia and Newfoundland and Labrador saw changes in their credit ratings
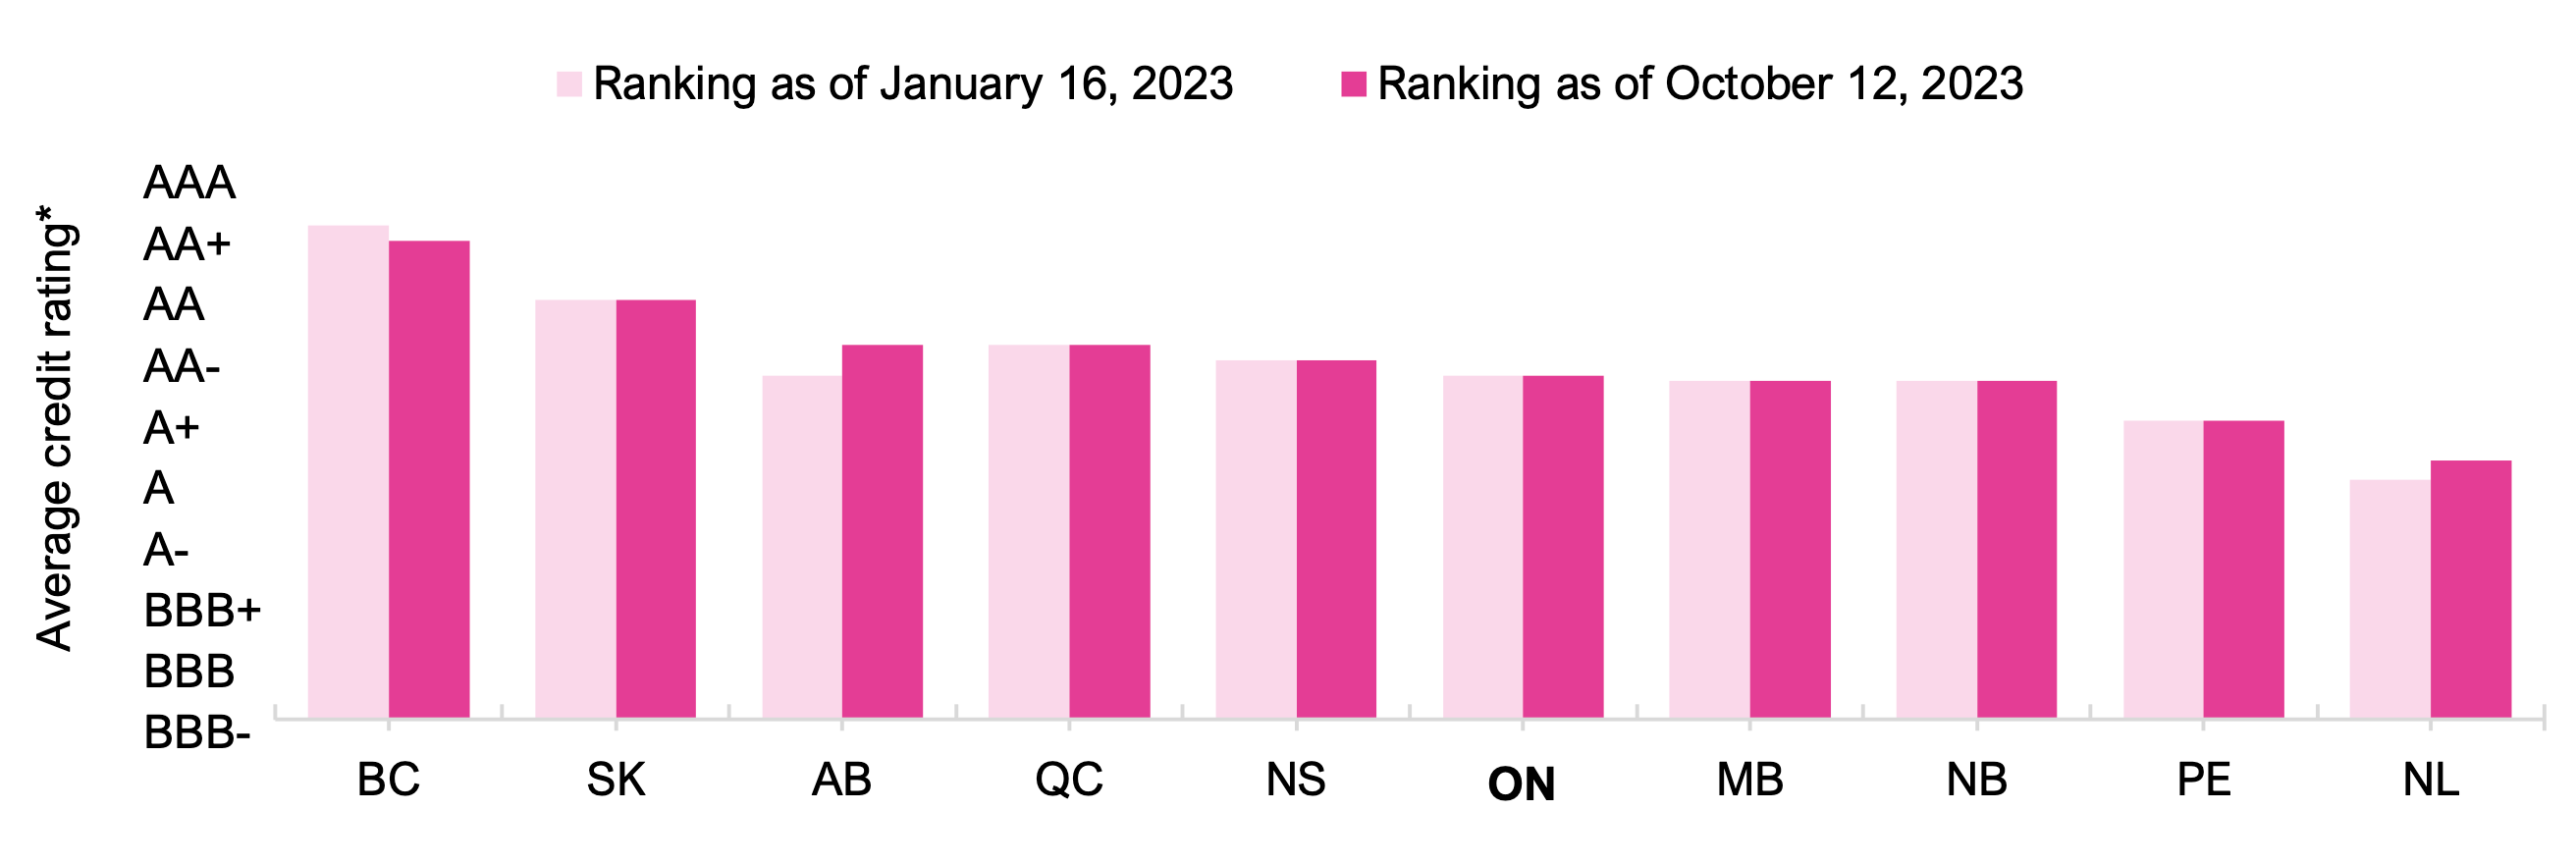
* See Table 1 for provincial credit ratings by credit rating agencies and Table 2 for the FAO’s credit rating conversion table.
Source: DBRS, Fitch, Moody’s, S&P and FAO
Provinces with credit rating changes
- British Columbia was downgraded by S&P,[8] with its outlook revised from stable to negative. The negative rating and outlook actions reflected S&P’s view that British Columbia’s increased program spending and significant capital plan set out in its 2023 budget will reverse previous fiscal gains, leading to larger deficits and higher debt burdens.
- Alberta was upgraded by both DBRS[9] and Moody’s,[10] while Fitch[11] revised its outlook from stable to positive. These changes reflected the improvements in Alberta’s budget and debt outlook, supported by strength in the energy sector, high oil prices and Alberta’s new fiscal framework.[12]
- Newfoundland and Labrador was upgraded by DBRS.[13] The credit rating upgrade reflected its improving fiscal outlook, stabilizing debt burden, and reduced concerns over the Muskrat Falls hydroelectric project, which became fully operational this year.
Provinces with outlook changes
- Ontario’s outlook was revised from stable to positive by DBRS,[14] Moody’s[15] and S&P[16] based on its improved fiscal outlook, with a quicker return to balanced budgets and a lower debt burden than previously forecasted.
- New Brunswick’s outlook was revised from stable to positive by S&P.[17] The change in outlook reflected S&P’s view that New Brunswick demonstrated prudent fiscal management, which will support operating surpluses and a stable debt burden.
- Prince Edward Island’s outlook was revised from stable to positive by S&P.[18] The positive outlook reflected S&P’s expectation of improved budgetary performance attributed to strong economic growth, steady population increases and the government’s commitment to fiscal sustainability.
Credit ratings and provincial borrowing costs
Investors use credit ratings to assess creditworthiness of a borrower, with higher credit ratings typically reflected in lower borrowing costs. A provincial comparison shows the negative relationship between credit ratings and borrowing rates – provinces with higher credit ratings tend to have lower borrowing rates.
Figure 3 Provinces with higher credit ratings tend to have lower borrowing rates
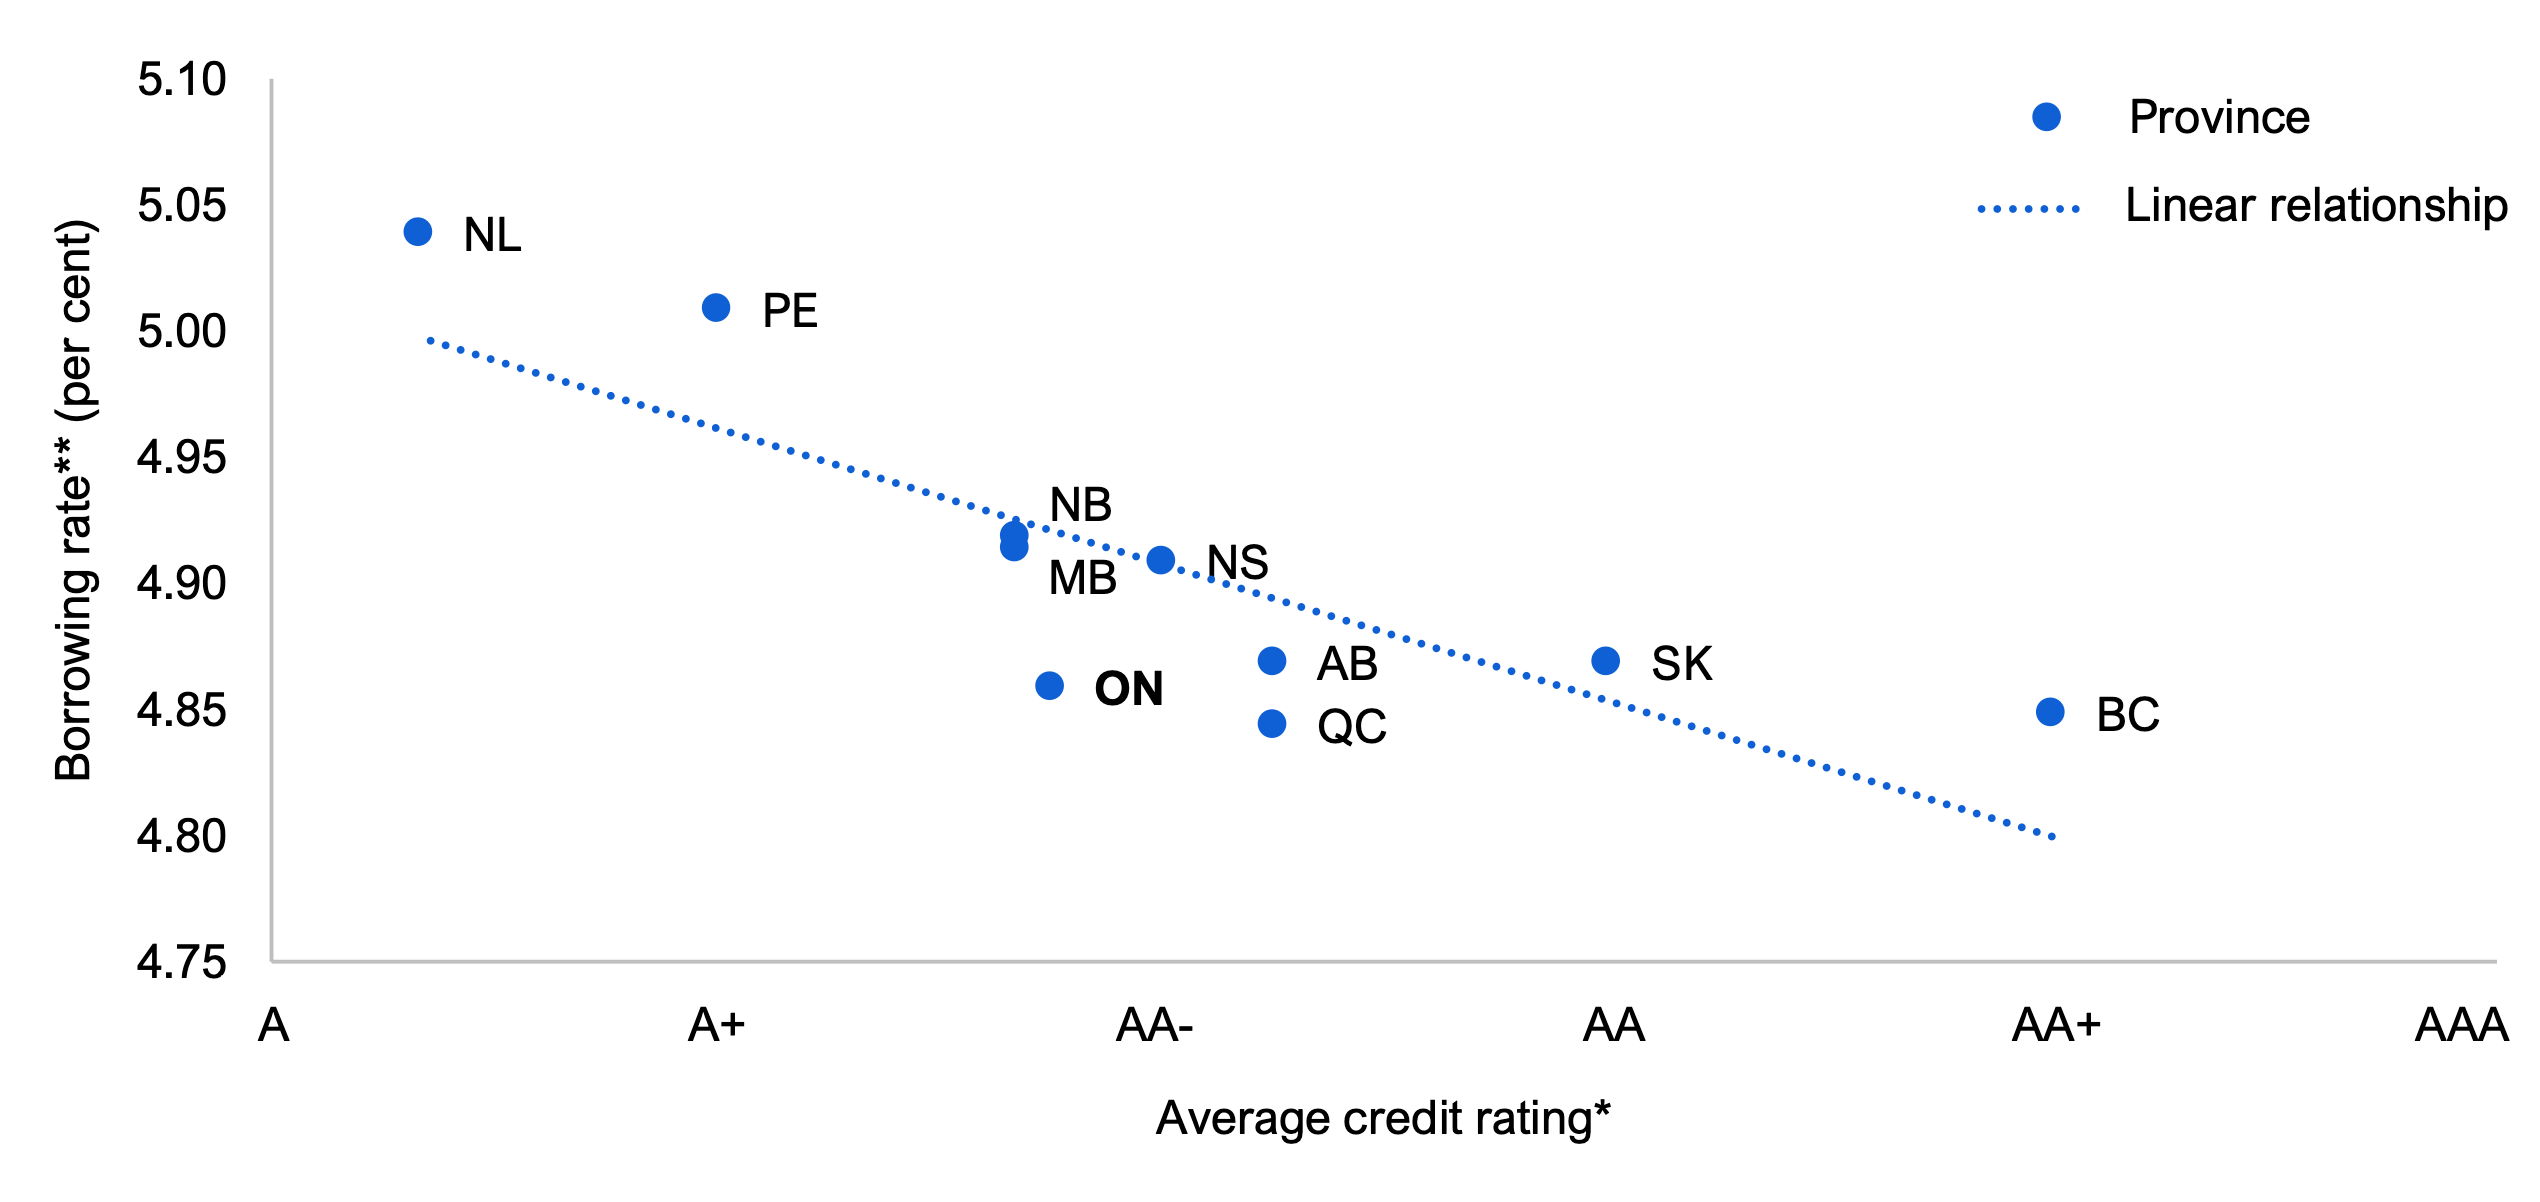
* Credit ratings as of October 12, 2023. See Table 2 for the FAO’s credit rating conversion table.
** Borrowing rates are for 10-year bonds, as of October 10, 2023.
Source: Ontario Financing Authority, DBRS, Fitch, Moody’s, S&P and FAO
While there is a general negative relationship between credit ratings and borrowing rates, provinces may have lower borrowing rates than provinces with better credit ratings. For example, Ontario benefits from lower borrowing rates than all provinces other than Quebec and British Columbia despite having the sixth highest credit rating.
Figure 4 Ontario’s borrowing rate lower than all provinces other than Quebec and British Columbia
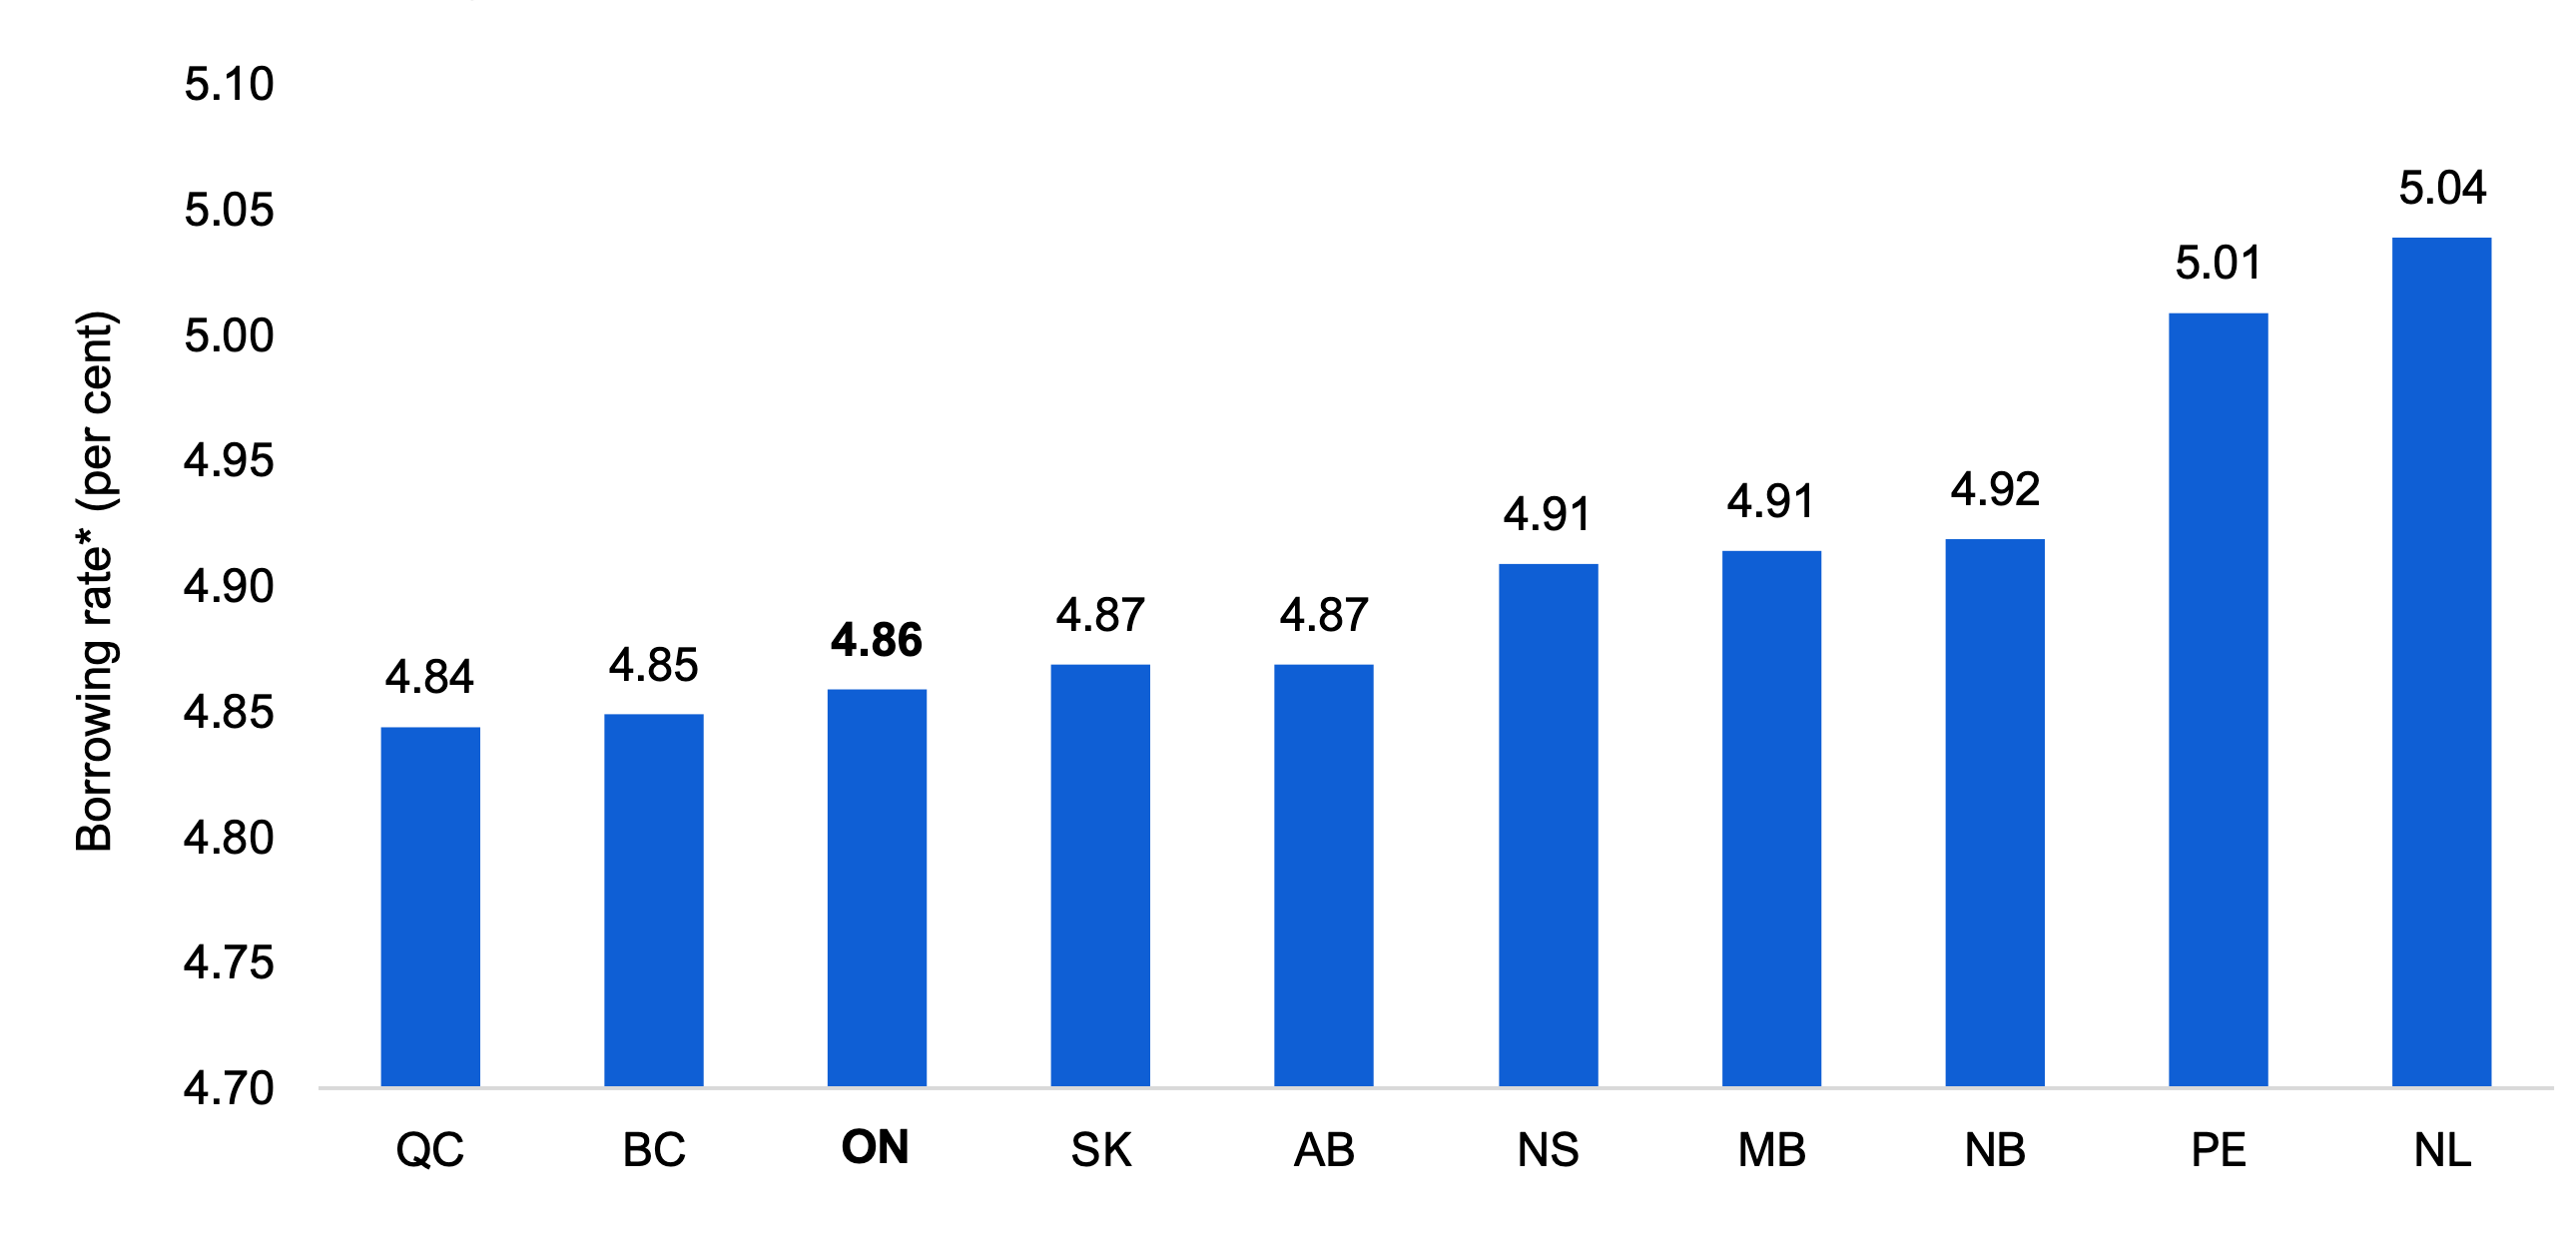
* Borrowing rates are for 10-year bonds, as of October 10, 2023.
Source: Ontario Financing Authority and FAO
Market participants rely on a broad range of public information to guide their investment decisions in addition to an entity’s credit rating.[19] This information includes the same factors incorporated into the determination of an entity’s credit rating, such as economic conditions, fiscal performance, and other factors including the bond’s time to maturity or the size of the bond issue.[20] This can result in differences between the credit ratings and borrowing rates among different entities.
Appendix
| Province | S&P | DBRS | Moody’s | Fitch | Average Rating (1 = highest rating) |
|---|---|---|---|---|---|
| British Columbia | AA (negative) | AA high (stable) | Aaa (stable) | AA+ (stable) | 2.00 |
| Alberta | A+ (stable) | AA (stable) | Aa2 (stable) | AA- (positive) | 3.75 |
| Saskatchewan | AA (stable) | AA low (stable) | Aa1 (stable) | AA (stable) | 3.00 |
| Manitoba | A+ (stable) | A high (stable) | Aa2 (stable) | 4.33 | |
| Ontario | A+ (positive) | AA low (positive) | Aa3 (positive) | AA- (stable) | 4.25 |
| Quebec | AA- (stable) | AA low (stable) | Aa2 (stable) | AA- (stable) | 3.75 |
| New Brunswick | A+ (positive) | A high (stable) | Aa2 (positive) | 4.33 | |
| Nova Scotia | AA- (stable) | A high (stable) | Aa2 (stable) | 4.00 | |
| Newfoundland & Labrador | A (stable) | A (stable) | A1 (stable) | 5.67 | |
| Prince Edward Island | A (positive) | A (stable) | Aa2 (stable) | 5.00 |
| Rating Description | Credit Quality | S&P | DBRS | Moody’s | Fitch | |
|---|---|---|---|---|---|---|
| Long Term | Long Term | Long Term | Long Term | Ranking | ||
| Investment-grade | Extremely Strong | AAA | AAA | Aaa | AAA | 1 |
| AA+ | AA high | Aa1 | AA+ | 2 | ||
| AA | AA | Aa2 | AA | 3 | ||
| AA- | AA low | Aa3 | AA- | 4 | ||
| Very Strong | A+ | A high | A1 | A+ | 5 | |
| A | A | A2 | A | 6 | ||
| A- | A low | A3 | A- | 7 | ||
| Strong | BBB+ | BBB high | Baa1 | BBB+ | 8 | |
| BBB | BBB | Baa2 | BBB | 9 | ||
| BBB- | BBB low | Baa3 | BBB- | 10 | ||
| Non-investment-grade | Speculative | BB+ | BB high | Ba1 | BB+ | 11 |
| BB | BB | Ba2 | BB | 12 | ||
| BB- | BB low | Ba3 | BB- | 13 | ||
| B+ | B high | B1 | B+ | 14 | ||
| B | B | B2 | B | 15 | ||
| B- | B low | B3 | B- | 16 | ||
| CCC | CCC | Caa | CCC | 17 |
About this Document
Established by the Financial Accountability Officer Act, 2013, the Financial Accountability Office (FAO) provides independent analysis on the state of the Province’s finances, trends in the provincial economy and related matters important to the Legislative Assembly of Ontario.
Prepared by: Yefei Zhang (Economist) and Nicolas Rhodes (Principal, Economic and Fiscal Analysis) under the direction of Paul Lewis (Chief Economist)
Graphical Descriptions
| Credit rating agency | Standardized rating* |
|---|---|
| S&P | A+ (positive) |
| DBRS | AA- (positive) |
| Moody's | AA- (positive) |
| Fitch | AA- (stable) |
| Province | Average credit rating* as of January 16, 2023 | Average credit rating* as of October 12, 2023 |
|---|---|---|
| BC | 1.75 | 2.00 |
| SK | 3.00 | 3.00 |
| AB | 4.25 | 3.75 |
| QC | 3.75 | 3.75 |
| NS | 4.00 | 4.00 |
| ON | 4.25 | 4.25 |
| MB | 4.33 | 4.33 |
| NB | 4.33 | 4.33 |
| PE | 5.00 | 5.00 |
| NL | 6.00 | 5.67 |
| Province | Average credit rating* | Borrowing rate** (per cent) |
|---|---|---|
| BC | 2.00 | 4.85 |
| SK | 3.00 | 4.87 |
| AB | 3.75 | 4.87 |
| QC | 3.75 | 4.84 |
| NS | 4.00 | 4.91 |
| ON | 4.25 | 4.86 |
| MB | 4.33 | 4.91 |
| NB | 4.33 | 4.92 |
| PE | 5.00 | 5.01 |
| NL | 5.67 | 5.04 |
| Province | Borrowing rate* (per cent) |
|---|---|
| QC | 4.84 |
| BC | 4.85 |
| ON | 4.86 |
| SK | 4.87 |
| AB | 4.87 |
| NS | 4.91 |
| MB | 4.91 |
| NB | 4.92 |
| PE | 5.01 |
| NL | 5.04 |
Footnotes
[1] See Table 2: The Credit Rating Agencies’ Credit Rating Scales in the Appendix for the scale used by each credit rating agency. The FAO’s standardized rating scale is based on the rating classifications used by S&P and Fitch.
[2] The credit rating outlook indicates the likely direction of a borrower’s credit rating within the next two years. An outlook can be stable, negative or positive. A stable outlook indicates a low likelihood of a credit rating change, while a negative or positive outlook indicates that the credit rating is likely to be lowered or raised. However, a change in a credit rating outlook does not guarantee a change in the current credit rating.
[3] Ratings agencies typically make adjustments to the Province’s reported numbers. S&P adjusts operating balances to recognize capital expenditures as incurred rather than as amortized.
[4] The $3.7 billion deterioration from the 2023 budget projection was the result of $7.5 billion in lower revenues partially offset by $2.8 billion in lower program spending and $1.0 billion in lower interest on debt expense. The 2022-23 deficit was also the largest year-over-year deterioration in Ontario’s budget position since the global financial crisis. Ontario’s budget position deteriorated by $16.3 billion from 2008-09 to 2009-10 during the second year of the global financial crisis, while the deterioration from 2021-22 to 2022-23 was $7.9 billion.
[5] Refinancing risk is the risk that a borrower will not be able to borrow to repay existing debt. Interest rate risk is the risk that movements in interest rates will increase debt servicing costs. Exchange rate risk is the risk that movements in exchange rates of foreign-denominated debt will increase debt servicing costs. For details on how Ontario manages these risks see, Ontario Financing Authority’s Risk Management.
[6] Bill 124 refers to the Protecting a Sustainable Public Sector for Future Generations Act, 2019, which limits base salary increases for most provincial employees to one per cent per year for a period of three years. On November 29, 2022, the Ontario Superior Court of Justice ruled that Bill 124 was in violation of the Canadian Charter of Rights and Freedoms and was declared to be void and of no effect. While the government has appealed this decision, which was heard by the Court of Appeal for Ontario at end of June 2023, some public sector employees have already been awarded retroactive compensation.
[7] Moody’s also noted potential policy pressures that stem from the high cost of living in Ontario which may lead to the implementation of policies that either reduce revenue or increase spending, citing the extension of the gas tax cut or the continued subsidization of electricity prices as examples.
[8] See S&P’s Province of British Columbia Downgraded To 'AA' From 'AA+' On Record Spending; Outlook Negative for more details.
[9] See DBRS’s Alberta Rating Action Press Release for more details.
[10] See Moody’s Alberta Rating Action for more details.
[11] See Fitch’s Alberta Rating Action Commentary for more details.
[12] The new fiscal framework requires annual balanced budgets and a portion of any surpluses recorded to be allocated towards debt repayment. For more information see page 17 of Alberta’s 2023-26 Fiscal Plan.
[13] See DBRS’s Newfoundland and Labrador Press Release for more details.
[14] See DBRS’s Ontario Press Release for more details.
[15] See Moody’s Ontario Rating Action for more details.
[16] See S&P’s Province of Ontario Outlook Revised To Positive From Stable On Strong Budgetary Performance; 'A+' Ratings Affirmed for more details.
[17] See S&P’s Province of New Brunswick Outlook Revised To Positive From Stable, 'A+' Rating Affirmed On Strong Finances for more details.
[18] See S&P’s Province of Prince Edward Island Outlook Revised To Positive From Stable; 'A' Rating Affirmed On Improving Finances for more details.
[19] Cantor R. & Packer, F. (1996). Determinants and Impacts of Sovereign Credit Ratings. Federal Reserve Bank of New York Economic Policy Review, 37-54.
[20] For further information see Cantor, R., Packer, F., Cole, K. (1997), Split Ratings and the Pricing of Credit Risk, Federal Reserve Bank of New York, Research Paper No. 9711.


